Munich Personal RePEc Archive
On the effectiveness of foreign aid in
institutional quality
Asongu, Simplice A
African Governance and Development Institute
8 February 2013
1
On the effectiveness of foreign aid in institutional quality
Simplice A. Asongu
African Governance and Development Institute, P.O. Box 18 SOA/ 1365 Yaoundé, Cameroon.
E-mail: [email protected]
Abstract
We extend the Okada & Samreth (2012, EL) and Asongu (2012, EB) debate on ‘the effect of foreign aid on corruption’ by: not partially negating the former’s methodological underpinning (as in the latter’s approach) with a unifying empirical framework and; broadening the horizon of inquiry from corruption to eight institutional quality dynamics (rule of law, regulation quality, government effectiveness, democracy, corruption, voice & accountability, control of corruption and political stability). Core to this extension is a hypothetical contingency of the ‘institutional perils of foreign aid’ on existing institutional quality such that, the institutional downside of development assistance maybe questionable when greater domestic institutional development has taken place. Based on the hypothesis of institutional thresholds for foreign aid effectiveness, the perilous character of development assistance to institutional quality is broadly confirmed in 53 African countries for the period 1996-2010.
JEL Classification: B20; F35; F50; O10; O55
2 1. Introduction
The Okada & Samreth (2012) and Asongu (2012a) debate on ‘the effect of foreign aid on
corruption’ has had an important influence in policy and academic circles. This paper is an
extension of the debate without partially negating the former’s methodological underpinning as in the latter’s approach. The prime motivation for this extension is the possibility that, the effectiveness of foreign aid could be contingent on institutional thresholds, such that countries with higher initial levels of institutional quality are affected differently in comparison to their counterparts with lower initial levels of institutional quality. Though not in substance, yet in form, this hypothesis is the methodological underpinning of Okada & Samreth that is partially neglected by Asongu. In light of this development, policy makers should be curious to know how the results of Asongu may change if the context were examined with the methodological underpinnings of Okada & Samreth. Put in plainer terms; are the institutional perils of foreign aid questionable when greater domestic institutional development has taken place? An answer to the question also unites two important strands in the aid-institutions nexus literature.
From the interesting literature on aid and institutions, the debate has centered around three main questions. Firstly, do donors allocate more to poor countries with better institutions? Secondly, does foreign aid induce better or worse institutional quality? Thirdly, how do outsiders engineer a transition from the present state of informal institutions towards more formal institutional settings via foreign aid? The first strand of the debate is relevant because donors have widely supposed that aid would be more effective in countries with better institutions. Accordingly, the answer to the first concern also affects the response to the second. Hence, if donors give more aid to countries with better institutions, this would create an incentive for reformers in the recipient country to adapt to better institutions. A considerable bulk of the literature has found no evidence that democracies or less corrupt states are rewarded with more development assistance (Alesina & Dollar, 2000; Alesina & Weder, 2002). On the second question, a substantial chunk of the literature has pointed to the institutional (Knack, 2001; Asongu, 2012a) and democratic (Djankov et al., 2005) perils of foreign-aid, especially in ethnically fractionalized states (Svensson, 2000). Lastly, there is the challenging third question (strand) about how aid would practically go about changing institutions in the interest of developing recipient countries. Accordingly, the transition from informal to formal institutions is somehow complex and attempts by Western aid agencies to introduce top-down formal institutions have not fared well in the complicated maze of bottom-up arrangements. To this third concern, Dixit (2004) has presented an interesting argument as to how introducing rule-based institutions could actually make things worse, as they create outside opportunities for members of relationship-based networks1.
Cognizant of the above, this paper contributes to existing literature by examining the Okada & Samreth (2012) and Asongu (2012a) debate in light of the last two strands (questions) within the same empirical framework. In adding some empirical structure to the issues raised, the present study provides answers to the following questions. Are the institutional perils of development-assistance contingent on existing institutional quality (second strand)? At what institutional thresholds is foreign-aid effective in improving institutional quality (third strand)? Are the institutional perils of foreign-aid questionable when greater domestic institutional development has taken place (second and third strands)? This study also contributes to existing literature by cutting adrift the mainstream approach to the debate that does not incorporate all dimensions of institutional quality. Accordingly, the Okada & Samreth (2012) and Asongu (2012a) debate lack a unifying framework that explores the most quantifiable government quality
1
3 indicators currently available. To bridge this gap, we provide an exhaustive assessment with eight institutional quality dynamics (rule of law, regulation quality, voice & accountability, government effectiveness, corruption, political stability, corruption-control and democracy)2.
The rest of the paper is organized as follows. Measurement and methodology issues are discussed in Section 2. Empirical analysis is covered in Section 3. We conclude with Section 4.
2. Data and Methodology 2.1 Data
We examine a panel of 53 African countries for the period 1996-2010 with data from African Development Indicators (ADI) of the World Bank (WB), Transparency International and La Porta et al., (2008, p. 289)3. Variable definitions and corresponding sources are presented in Appendix 3. Institutional quality dependent variables include: rule of law, regulation quality, corruption-control, voice & accountability, government-effectiveness, political stability (or no violence), corruption and democracy. The exogenous variable of interest is Net Official Development Assistance (NODA). For robustness purposes we use three different NODA indicators: Total NODA; NODA from the Development Assistance Committee (DAC) countries; and NODA from Multilateral Donors. While the first is used in the empirical section, the last two have been used for robustness checks. Borrowing from the literature on the determinants of institutional quality, we control for foreign investment, trade, per capita economic prosperity and public investment (Goel & Nelson, 2005; Lambsdorff, 2006). We also control for the unobserved heterogeneity by employing dummies for low-income, English common-law and landlocked countries. Landlocked countries are inherently less developed (François & Manchin, 2006). English Common law countries have higher levels of institutional quality in Africa (Asongu, 2011; Asongu, 2012b, p. 190). Also, government quality in Africa increases with income levels (Asongu, 2012b, p. 190).
Details about the descriptive statistics (with presentation of countries), correlation analysis (showing the relationships between key variables used in the paper), and variable
definitions are presented in the appendices. The ‘summary statistics’ ( Panel A of Appendix 1) of the variables used in the panel regressions shows that there is quite some variation in the data utilized so that one should be confident that reasonable estimated nexuses would emerge. Countries making-up the panel are presented in Panel B of Appendix 1. The purpose of the correlation matrix (Appendix 2) is to address issues resulting from overparametization and multicolinearity. Based on a preliminary assessment of the correlation coefficients, there do not appear to be any serious concerns in terms of the relationships to be estimated.
2.2 Methodology
Consistent with recent literature (Billger & Goel, 2009; Okada & Samreth, 2012; Asongu, 2013), to determine whether existing levels of institutional dynamics affect how development assistance comes into play, we use quantile regression. This approach permits us to assess if the relationship among institutional dynamics and foreign-aid differs throughout the distributions of institutional dynamics (Koenker & Hallock, 2001). Thus, based on this estimation technique we
2
Knack & Keefer (1995) have concluded that more indicators are needed to properly account for the quality of institutions (p. 223).
3
4 are able to carefully examine the incidence of development assistance throughout the conditional distribution with particular emphasis on countries with the best and worst institutions. Quantile regression (hence QR) yields parameters estimated at multiple points in the conditional distribution of the dependent variable (Koenker & Bassett, 1978). Accordingly, the th quantile estimator of the endogenous variable is obtained by solving for the following optimization problem.
i i i i i i k x y i i i x y i i i R x y x y : : ) 1 ( min (1)Where is in the ‘0 and 1’ interval. Contrary to OLS that is based on minimizing the sum of squared residuals, with QR we minimize the weighted sum of absolute deviations. For example the 10th or 75th quantiles (with =0.10 or 0.75 respectively) by approximately weighing the residuals. The conditional quantile of yigiven xiis:
i i
y x x
Q ( / ) (2)
where unique slope parameters are derived for each th quantile of interest. This formulation is analogous to E(y/x) xi in the OLS slope though parameters are estimated only at the
mean of the conditional distribution of the endogenous variable. For the model in Eq. (2) the dependent variable yi is an institutional quality indicator while xi contains a constant term, foreign-aid, foreign investment, trade, per capita economic prosperity, public investment and fixed effects (low-income, English common law and landlocked countries).
3. Empirical analysis 3.1 Presentation of results
The results presented in Tables 2-3 include OLS and QR estimates. OLS estimates provide a baseline of mean effects and we compare these to estimates of separate quantiles in the conditional distributions of the institutional dynamic dependent variables. In the interpretation of estimated coefficients, it is worth noting that smaller values (in conditional distributions) of the dependent variables denote less institutional quality (in terms of democracy, rule of law, regulation quality, government effectiveness, corruption, political stability, voice & accountability and corruption-control). Table 2 shows results for the rule of law, regulation quality, government effectiveness and political stability regressions while Table 3 reports those of voice & accountability, democracy, corruption and corruption-control.
5 Table 1: Summary of results (foreign-aid effectiveness in institutional development)
Q 0.1 Q 0.25 Q 0.50 Q 0.75 Q 0.90 Q 0.1 Q 0.25 Q 0.50 Q 0.75 Q 0.90
Rule of Law Regulation Quality
-0.005* -0.008** -0.012* -0.011* -0.007 -0.014*** -0.022*** -0.019*** -0.018*** -0.012
Government Effectiveness Political Stability
-0.006* -0.013*** -0.008 -0.009 -0.005 -0.004 0.001 -0.0003 -0.004 -0.006
Voice & Accountability Democracy
0.008* 0.006 0.002 -0.007 -0.014** -0.207*** -0.052 0.060 0.002 0.008
Corruption Control of Corruption
0.006 0.002 0.0007 -0.005 -0.011 -0.0008 -0.001 -0.007** -0.004 -0.008
*, **, ***, denote significance levels of 10%, 5% and 1% respectively. Lower quantiles (e.g., Q 0.1) signify nations where institutional quality is least.
3.2 Discussion
For more than half a century, the political economy of foreign-aid has been widely debated in academic and policy-making circles. A substantial literature on institutions and development suggests that, Africa is poor because it is deficient of good institutions: dictatorships, lack of property rights, weak courts and contract-enforcement, political instability, high corruption, violence and hostile regulatory environment for private business (Easterly, 2005; Kodila-Tedika, 2012a, 2012b, 2013a, 2013b). With respect to this strand, in order to end African poverty, the West needs to promote good institutions. In response to how foreign-aid might promote good institutions in aid-recipient countries, much of the literature has focused on how institutions matter in the effectiveness of foreign-aid (Alesina & Dollar, 2000; Alesina & Weder, 2002; Knack, 2001; Dixit, 2004; Djankov et al., 2005). This present paper has united two strands of the debate in light of the recent development from Okada & Samreth (2012) and Asongu (2012a).
From the available weight of empirical evidence (as summarized in Table 1 above), the following answers could be provided to the examined questions. But for a thin exception (voice and accountability in the lowest quantile), foreign-aid mitigates institutional development. The institutional perils of foreign-aid are not questionable when greater domestic institutional development has already taken place. Hence, the hypothesis that the institutional benefits of foreign aid are contingent on existing institutional levels in Africa is not valid. Drawing from the Okada & Samreth (2012) and Asongu (2012a) debate, it could be concluded that even without
partially negating the former’s methodological standpoint, foreign aid remain perilous to
6 Table 2: Rule of Law, Regulation Quality, Government Effectiveness and Political stability
OLS Q 0.1 Q 0.25 Q 0.50 Q 0.75 Q 0.90 OLS Q 0.1 Q 0.25 Q 0.50 Q 0.75 Q 0.90 Rule of Law Regulation Quality
Constant -0.755*** -1.809*** -1.199*** -0.460*** -0.266** -0.074 -0.251*** -1.432*** -0.470*** 0.083 0.121 0.252
(0.000) (0.000) (0.000) (0.000) (0.047) (0.819) (0.000) (0.000) (0.000) (0.452) (0.382) (0.107) Development Assistance -0.007* -0.005* -0.008** -0.012* -0.011* -0.007 -0.017*** -0.014*** -0.022*** -0.019*** -0.018*** -0.012
(0.068) (0.067) (0.021) (0.097) (0.093) (0.407) (0.000) (0.006) (0.000) (0.000) (0.000) (0.258) FDI -0.003 -0.004 0.005** -0.003 -0.008** -0.015*** -0.005* -0.009 -0.002 0.001 -0.004 -0.008**
(0.373) (0.527) (0.027) (0.380) (0.0149) (0.000) (0.093) (0.282) (0.827) (0.710) (0.195) (0.014) Trade -0.0001 0.0001 -0.002* -0.001 0.0009 0.004 -0.003*** 0.001** -0.003*** -0.006**** -0.004*** -0.003*
(0.876) (0.813) (0.089) (0.508) (0.506) (0.128) (0.000) (0.037) (0.000) (0.000) (0.007) (0.057)
Per capita GDP growth -0.005 -0.011*** -0.008 0.001 0.006 0.006 -0.003 -0.006 -0.015** -0.002 0.010 0.013 (0.455) (0.043) (0.209) (0.865) (0.549) (0.728) (0.631) (0.385) (0.017) (0.791) (0.274) (0.215) Public Investment 0.052*** 0.055*** 0.053*** 0.046*** 0.044*** 0.036** 0.024*** 0.016 0.017 0.032*** 0.035*** 0.024**
(0.000) (0.000) (0.000) (0.000) (0.000) (0.037) (0.000) (0.128) (0.101) (0.006) (0.000) (0.040)
Landlocked -0.030 0.134 0.125 -0.095 -0.050 -0.097 0.061 0.222** 0.065 0.041 0.079 0.067 (0.656) (0.158) (0.234) (0.214) (0.435) (0.163) (0.302) (0.038) (0.477) (0.547) (0.251) (0.319) English 0.381*** 0.294*** 0.356*** 0.388*** 0.302*** 0.241** 0.344*** 0.257* 0.443*** 0.357*** 0.415*** 0.417***
(0.000) (0.000) (0.000) (0.000) (0.000) (0.016) (0.000) (0.092) (0.000) (0.000) (0.000) (0.000)
Low Income -0.354*** 0.152* -0.108 -0.391*** -0.504*** -0.652*** -0.190*** 0.190 -0.036 -0.325*** -0.402*** -0.405*** (0.000) (0.080) (0.446) (0.001) (0.000) (0.000) (0.000) (0.300) (0.674) (0.000) (0.000) (0.002)
Pseudo R² 0.277 0.133 0.119 0.184 0.273 0.349 0.246 0.068 0.121 0.154 0.255 0.333 Observations 367 367 367 367 367 367 366 366 366 366 366 366
OLS Q 0.1 Q 0.25 Q 0.50 Q 0.75 Q 0.90 OLS Q 0.1 Q 0.25 Q 0.50 Q 0.75 Q 0.90 Government Effectiveness Political Stability
Constant -0.506*** -1.381*** -0.663*** -0.346** -0.062 0.106 -1.192*** -3.090*** -1.620*** -0.988*** -0.512*** 0.604
(0.000) (0.000) (0.000) (0.029) (0.686) (0.548) (0.000) (0.000) (0.000) (0.000) (0.016) (0.114) Development Assistance -0.008** -0.006* -0.013*** -0.008 -0.009 -0.005 -0.005 -0.004 0.001 -0.0003 -0.004 -0.006
(0.023) (0.062) (0.000) (0.218) (0.287) (0.374) (0.332) (0.592) (0.769) (0.973) (0.652) (0.644) FDI -0.003 0.001 0.003 -0.003 -0.006* -0.0009 -0.009* -0.019 -0.010 -0.009* -0.011** -0.002
(0.355) (0.255) (0.178) (0.373) (0.097) (0.959) (0.075) (0.591) (0.442) (0.090) (0.024) (0.894) Trade -0.001** -0.0001 -0.004*** -0.003** -0.002 -0.002 0.005*** 0.01**** 0.004*** 0.005*** 0.005*** 0.0007
(0.032) (0.894) (0.000) (0.022) (0.101) (0.258) (0.000) (0.000) (0.005) (0.000) (0.002) (0.764) Per capita GDP growth 0.0009 -0.002 0.002 0.017 0.011 -0.002 0.005 0.006 -0.003 0.002 0.002 0.013
(0.894) (0.716) (0.774) (0.208) (0.434) (0.808) (0.636) (0.706) (0.816) (0.911) (0.875) (0.325) Public Investment 0.040*** 0.017*** 0.038*** 0.049*** 0.058*** 0.054*** 0.060*** 0.045** 0.078*** 0.049*** 0.056*** 0.021
(0.000) (0.003) (0.000) (0.000) (0.000) (0.005) (0.000) (0.025) (0.000) (0.000) (0.004) (0.324) Landlocked -0.073 0.213** 0.050 -0.149** -0.145* -0.124* -0.122 0.048 -0.470*** -0.378** 0.066 -0.030
(0.239) (0.0173) (0.587) (0.037) (0.063) (0.079) (0.224) (0.852) (0.000) (0.022) (0.630) (0.809) English 0.389*** 0.179** 0.385*** 0.418*** 0.398*** 0.453*** 0.241*** 0.657*** 0.577*** 0.242* 0.136 0.064
(0.000) (0.037) (0.000) (0.000) (0.000) (0.000) (0.007) (0.000) (0.000) (0.053) (0.226) (0.752) Low Income -0.435*** -0.071 -0.297*** -0.559*** -0.694*** -0.733*** -0.132 0.228 -0.486*** -0.151 -0.199 -0.416**
(0.000) (0.482) (0.006) (0.000) (0.000) (0.000) (0.234) (0.268 (0.002) (0.381) (0.216) (0.029)
Pseudo R² 0.312 0.078 0.094 0.195 0.324 0.406 0.194 0.138 0.133 0.098 0.118 0.141 Observations 359 359 359 359 359 359 368 368 368 368 368 368
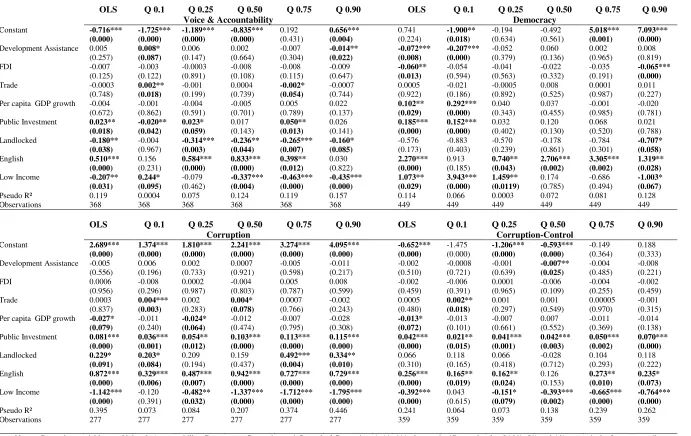
7 Table 3: Voice & Accountability, Democracy, Corruption and Corruption-Control
OLS Q 0.1 Q 0.25 Q 0.50 Q 0.75 Q 0.90 OLS Q 0.1 Q 0.25 Q 0.50 Q 0.75 Q 0.90 Voice & Accountability Democracy
Constant -0.716*** -1.725*** -1.189*** -0.835*** 0.192 0.656*** 0.741 -1.900** -0.194 -0.492 5.018*** 7.093*** (0.000) (0.000) (0.000) (0.000) (0.431) (0.004) (0.224) (0.018) (0.634) (0.561) (0.001) (0.000)
Development Assistance 0.005 0.008* 0.006 0.002 -0.007 -0.014** -0.072*** -0.207*** -0.052 0.060 0.002 0.008 (0.257) (0.087) (0.147) (0.664) (0.304) (0.022) (0.008) (0.000) (0.379) (0.136) (0.965) (0.819) FDI -0.007 -0.003 -0.0003 -0.008 -0.008 -0.009 -0.060** -0.054 -0.041 -0.022 -0.035 -0.065***
(0.125) (0.122) (0.891) (0.108) (0.115) (0.647) (0.013) (0.594) (0.563) (0.332) (0.191) (0.000)
Trade -0.0003 0.002** -0.001 0.0004 -0.002* -0.0007 0.0005 -0.021 -0.0005 0.008 0.0001 0.011 (0.748) (0.018) (0.199) (0.739) (0.054) (0.744) (0.922) (0.186) (0.892) (0.525) (0.987) (0.227) Per capita GDP growth -0.004 -0.001 -0.004 -0.005 0.005 0.022 0.102** 0.292*** 0.040 0.037 -0.001 -0.020
(0.672) (0.862) (0.591) (0.701) (0.789) (0.137) (0.029) (0.000) (0.343) (0.455) (0.985) (0.781) Public Investment 0.023** -0.020** 0.023* 0.017 0.050** 0.026 0.185*** 0.152*** 0.032 0.120 0.068 0.021
(0.018) (0.042) (0.059) (0.143) (0.013) (0.141) (0.000) (0.000) (0.402) (0.130) (0.520) (0.788) Landlocked -0.180** -0.004 -0.314*** -0.236** -0.265*** -0.160* -0.576 -0.883 -0.570 -0.178 -0.784 -0.707* (0.038) (0.967) (0.003) (0.044) (0.007) (0.085) (0.173) (0.403) (0.239) (0.861) (0.301) (0.058)
English 0.510*** 0.156 0.584*** 0.833*** 0.398** 0.030 2.270*** 0.913 0.740** 2.706*** 3.305*** 1.319** (0.000) (0.231) (0.000) (0.000) (0.012) (0.822) (0.000) (0.185) (0.043) (0.002) (0.002) (0.028)
Low Income -0.207** 0.244* -0.079 -0.337*** -0.463*** -0.435*** 1.073** 3.943*** 1.459** 0.174 -0.686 -1.003* (0.031) (0.095) (0.462) (0.004) (0.000) (0.000) (0.029) (0.000) (0.0119) (0.785) (0.494) (0.067)
Pseudo R² 0.119 0.0004 0.075 0.124 0.119 0.157 0.114 0.066 0.0003 0.072 0.081 0.128 Observations 368 368 368 368 368 368 449 449 449 449 449 449
OLS Q 0.1 Q 0.25 Q 0.50 Q 0.75 Q 0.90 OLS Q 0.1 Q 0.25 Q 0.50 Q 0.75 Q 0.90 Corruption Corruption-Control
Constant 2.689*** 1.374*** 1.810*** 2.241*** 3.274*** 4.095*** -0.652*** -1.475 -1.206*** -0.593*** -0.149 0.188
(0.000) (0.000) (0.000) (0.000) (0.000) (0.000) (0.000) (0.000) (0.000) (0.000) (0.364) (0.333) Development Assistance -0.005 0.006 0.002 0.0007 -0.005 -0.011 -0.002 -0.0008 -0.001 -0.007** -0.004 -0.008
(0.556) (0.196) (0.733) (0.921) (0.598) (0.217) (0.510) (0.721) (0.639) (0.025) (0.485) (0.221) FDI 0.0006 -0.008 0.0002 -0.004 0.005 0.008 -0.002 -0.006 0.0001 -0.006 -0.004 -0.002
(0.956) (0.296) (0.987) (0.803) (0.787) (0.599) (0.459) (0.391) (0.965) (0.109) (0.255) (0.459) Trade 0.0003 0.004*** 0.002 0.004* 0.0007 -0.002 0.0005 0.002** 0.001 0.001 0.00005 -0.001
(0.837) (0.003) (0.283) (0.078) (0.766) (0.243) (0.480) (0.018) (0.297) (0.549) (0.970) (0.315) Per capita GDP growth -0.027* -0.011 -0.024* -0.012 -0.007 -0.028 -0.013* -0.013 -0.007 0.007 -0.011 -0.014
(0.079) (0.240) (0.064) (0.474) (0.795) (0.308) (0.072) (0.101) (0.661) (0.552) (0.369) (0.138) Public Investment 0.081*** 0.036*** 0.054** 0.103*** 0.113*** 0.115*** 0.042*** 0.021** 0.041*** 0.042*** 0.050*** 0.070***
(0.000) (0.001) (0.012) (0.000) (0.000) (0.000) (0.000) (0.015) (0.001) (0.003) (0.002) (0.000)
Landlocked 0.229* 0.203* 0.209 0.159 0.492*** 0.334** 0.066 0.118 0.066 -0.028 0.104 0.118
(0.091) (0.084) (0.194) (0.437) (0.004) (0.010) (0.310) (0.165) (0.418) (0.712) (0.293) (0.222) English 0.872*** 0.329*** 0.487*** 0.942*** 0.727*** 0.729*** 0.256*** 0.165** 0.162** 0.126 0.273** 0.235* (0.000) (0.006) (0.007) (0.000) (0.000) (0.000) (0.000) (0.019) (0.024) (0.153) (0.010) (0.073)
Low Income -1.142*** -0.120 -0.482** -1.337*** -1.712*** -1.795*** -0.392*** 0.043 -0.151* -0.393*** -0.665*** -0.764*** (0.000) (0.391) (0.032) (0.000) (0.000) (0.000) (0.000) (0.615) (0.079) (0.002) (0.000) (0.000)
Pseudo R² 0.395 0.073 0.084 0.207 0.374 0.446 0.241 0.064 0.073 0.138 0.239 0.262 Observations 277 277 277 277 277 277 359 359 359 359 359 359
8 4. Conclusion
We have extended the Okada & Samreth (2012, EL) and Asongu (2012, EB) debate on
‘the effect of foreign aid on corruption’ by: not partially negating the former’s methodological underpinning (as in the latter’s approach) with a unifying empirical framework and; broadening the horizon of inquiry from corruption to eight institutional quality dynamics (rule of law, regulation quality, government effectiveness, democracy, corruption, voice & accountability, control of corruption and political stability). Core to this extension is a hypothetical contingency
of the ‘institutional perils of foreign aid’ on existing institutional quality such that, the institutional downside of development assistance maybe questionable when greater domestic institutional development has taken place. Based on the hypothesis of institutional thresholds for foreign aid effectiveness, the perilous character of development assistance to institutional quality has been broadly confirmed in 53 African countries for the period 1996-2010.
Appendices
Appendix 1: Summary Statistics and Presentation of Countries Panel A: Summary Statistics
Variables Mean S.D Min. Max. Observa
tions
Institutional Quality
Rule of Law -0.706 0.682 -2.691 1.053 633 Regulation Quality -0.687 0.674 -2.729 0.905 631 Government Effectiveness -0.681 0.614 -1.853 0.807 598 Political Stability -0.557 0.958 -3.311 1.143 636 Voice & Accountability -0.674 0.734 -2.174 1.047 636 Control of Corruption -0.607 0.623 -2.495 1.086 622 Democracy 2.373 4.093 -8.000 10.000 750 Corruption 2.984 1.065 1.000 6.400 462
Development Assistance (DA)
Total DA 10.811 12.774 -0.251 148.30 704 DA from Multilateral Donors 4.481 5.512 -1.985 64.097 704 DA from DAC countries 6.244 8.072 -0.679 97.236 704
Control Variables
Per capita Economic Prosperity (GDPpcg)
2.326 6.702 -33.073 90.140 768
Public Investment 7.449 4.500 0.000 39.984 655 Financial Openness (FDI) 4.221 8.451 -8.629 145.20 557 Trade Openness (Trade) 77.853 39.698 17.859 275.23 719
Dummy variables
English Common law countries 0.377 0.485 0.000 1.000 795 Landlocked countries 0.283 0.450 0.000 1.000 795 Low Income countries 0.584 0.493 0.000 1.000 795
Panel B: Presentation of Countries
Algeria, Angola, Benin, Botswana, Burkina Faso, Burundi, Cameroon, Cape Verde, Central African Republic, Chad, Congo Democratic Republic, Congo Republic, Côte d’Ivoire, Djibouti, Egypt, Equatorial Guinea, Eritrea, Ethiopia, Gabon, The Gambia, Ghana, Guinea, Guinea Bissau, Kenya, Lesotho, Liberia, Libya, Madagascar, Malawi, Mali, Mauritania, Mauritius, Morocco, Mozambique, Namibia, Niger, Nigeria, Rwanda, Sao Tomé & Principe, Senegal, Seychelles, Sierra Leone, Somalia, South Africa, Sudan, Swaziland, Togo, Tunisia, Uganda, Zambia, Zimbabwe, Tanzania, Comoros.
9 Appendix 2: Correlation analysis
Institutional Quality Foreign Aid Control Variables
RL RQ GE PolS VA CC Demo C DA DAMD DADAC FDI Trade GDPpcg PubI Eng LL LI 1.00 0.81 0.88 0.79 0.72 0.87 0.52 0.84 -0.20 -0.17 -0.20 0.001 0.17 0.08 0.22 0.17 0.02 -0.36 RL
1.00 0.81 0.63 0.70 0.72 0.48 0.72 -0.24 -0.22 -0.23 -0.14 0.01 0.11 0.08 0.14 0.05 -0.28 RQ 1.00 0.64 0.68 0.83 0.41 0.86 -0.27 -0.25 -0.24 -0.04 0.12 0.10 0.13 0.30 -0.05 -0.43 GE 1.00 0.65 0.68 0.52 0.67 -0.14 -0.12 -0.14 0.04 0.30 0.10 0.24 0.05 -0.04 -0.25 PolS
1.00 0.66 0.75 0.65 -0.0009 -0.002 0.002 -0.02 0.03 0.07 -0.02 0.24 0.01 -0.14 V&A 1.00 0.48 0.88 -0.14 -0.12 -0.14 0.01 0.16 0.006 0.21 0.12 0.02 -0.32 CC
1.00 0.42 -0.03 0.011 -0.05 -0.04 0.008 0.06 0.14 0.16 0.09 -0.02 Demo 1.00 -0.22 -0.21 -0.21 0.04 0.20 0.04 0.08 0.24 0.03 -0.39 C
1.00 0.90 0.95 0.16 -0.10 0.00 0.19 -0.05 0.08 0.45 DA 1.00 0.73 0.09 -0.09 0.01 0.22 -0.03 0.13 0.47 DAMD
1.00 0.19 -0.09 -0.008 0.14 -0.05 0.05 0.38 DADAC 1.00 0.45 0.20 0.07 0.10 -0.04 -0.07 FDI
1.00 0.17 0.18 0.18 -0.09 -0.35 Trade 1.00 0.11 0.01 -0.03 -0.13 GDPpcg
1.00 -0.13 0.08 -0.05 PubIvt 1.00 0.11 -0.05 Eng
1.00 0.27 LL 1.00 LI RL: Rule of Law. RQ: Regulation Quality. GE: Government Effectiveness. V&A: Voice & Accountability. CC: Corruption-Control. Demo: Democracy. C: Corruption Perception Index. FDI: Foreign Direct Investment. GDPpcg: GDP per capita growth. PubI: Public Investment. DA: Net Official Development Assistance. Eng: English Common Law countries. LL: Landlocked countries. LI: Low Income countries.
10 Appendix 3: Variable Definitions
Variables Signs Variable Definitions Source(s)
Rule of Law RL Rule of Law (estimate) World Bank (WDI)
Regulation Quality RQ Regulation Quality (estimate) World Bank (WDI)
Government Effectiveness GE Government Effectiveness(estimate) World Bank (WDI)
Political Stability PolS Political Stability/ No Violence (estimate) World Bank (WDI)
Voice & Accountability VA Voice and Accountability (estimate) World Bank (WDI)
Control of Corruption CC Control of Corruption(estimate) World Bank (WDI)
Democracy Demo Level of Institutionalized Democracy World Bank (WDI)
Corruption C Corruption Perception Index Transparency International
Development Assistance 1 DA Total Development assistance (% of GDP) World Bank (WDI)
Development Assistance 2 DAMD Development Assistance from Multilateral Donors(% of GDP) World Bank (WDI)
Development Assistance 3 DADAC Development Assistance from DAC Countries (% of GDP) World Bank (WDI)
External Debt Flow FDI Foreign Direct Investment (% of GDP) World Bank (WDI)
Trade(Openness) Trade Imports plus Exports in commodities (% of GDP) World Bank (WDI)
Public Investment PubI Gross Public Investment (% of GDP) World Bank (WDI)
Per Capita Economic prosperity
GDPpcg GDP per capita Growth (annual %) World Bank (WDI)
English Eng English Common law countries La Porta et al. (2008, p. 289)
Landlocked LL Landlocked Countries ---
Low Income LI Low Income Countries World Bank (FDSD)
11 References
Alesina, A., Dollar, D., 2000. Who gives Foreign Aid to Whom and Why? Journal of Economic Growth. 5, 33-64.
Alesina, A., Weder, B., 2002. Do Corrupt Governments Receive Less Foreign Aid? American Economic Review. 92, 1126-1137.
Asongu, S. A., 2011. Law, democracy and the quality of government in Africa. MPRA Paper No. 35502.
Asongu, S. A., 2012a. On the effect of foreign aid on corruption. Economics Bulletin. 32(3), 2174-2180.
Asongu, S. A., 2012b. Government quality determinants of stock market performance in African countries. Journal of African Business. 13(3), 183-199.
Asongu, S. A., 2013. Fighting corruption in Africa: do existing corruption-control levels matter. International Journal of Development Issues. 12(1), 36-52.
Billger, S. M., Goel, R. K., 2009. Do existing corruption levels matter in controlling corruption? Cross-country quantile regression estimates. Journal of Development Economics. 90, 299-305.
Boone, P., 1996. Politics and Effectiveness of Foreign Aid. European Economic Review. 40, 289-329.
Dixit, A., 2004. Lawlessness and Economics: Alternative Modes of Governance. Princeton: University Press.
Djankov, S., Jose, G. M., Marta, R., 2005. The Curse of Aid. World Bank, Mimeo, April, 2005.
Easterly, W., 2005. Can foreign aid save Africa, Saint John’s University.
François, J., Manchin, M., 2006. Institutional Quality, Infrastructure and the Propensity of Export. Tinbergen Institute and CEPR Working Paper.
Ghura, D., Hadjimichael, M.T., Mahleisen, M., Nord, R., Ucer, E. M., 1995. Sub-Saharan Africa: Growth, Savings and Investment, 1986-93. IMF Occasional Paper No. 118.
Goel, R. K., Nelson, M. A., 2005. Economic Freedom versus Political Freedom: Cross-country Influences on Corruption. Australian Economic Papers. 44(2), 121-133.
Knack, S., 2001. Aid Dependence and the Quality of Governance: Cross-Country Empirical Tests. Southern Economic Journal. 68(2), 310-329.
12 Kodila-Tedika, O., 2012a. Empirical Survey on the Causes of Corruption. MPRA Paper No. 41484.
Kodila-Tedika, O., 2012b. Consequences of Corruption: An Empirical Survey. MPRA Paper No. 41482.
Kodila-Tedika, O., 2013a. Corruption and Failed African States. MPRA Paper No. 44686.
Kodila-Tedika, O., 2013b. Anatomy of corruption in Democratic Republic of Congo. MPRA Paper No. 43463.
Koenker, R., Bassett, Jr. G., 1978. Regression quantiles, Econometrica. 46, 33-50.
Koenker, R., Hallock, F. K., 2001. Quantile regression. Journal of Economic Perspectives. 15, 143-156.
Lambsdorff, J. G., 2006. Consequences and Causes of Corruption: What do We Know from a Cross-Section of Countries? In Rose-Ackermann (ed), International Handbook on The Economics of Corruption, Edward-Elgar, Cheltenham, UK, Northampton, MA, USA, 3-51.
La Porta, R., Lopez-de-Silanes, F., Shleifer, A., 2008. The Economic Consequences of Legal Origins. Journal of Economic Literature. 46(2), 285-332.
Mosley, P., Hudson, J., Horrell, S., 1992. Aid, The Public Sector and The Market in Less Developed Countries: A Return to The Scene of Crime. Journal of International Development. 4, 139-150.
Okada, K., Samreth, S., 2012. The effect of foreign aid on corruption: A quantile regression approach. Economic Letters, 11, pp. 240-243.
Pedersen, K. P., 1996. Aid, Investment and Incentives. Scandinavian Journal of Economics. 98(3), 423-438.
Reichel, R., 1995. Development, Aid, Savings and Growth in the 1980s: A Cross-Sectional Analysis. Savings and Development. 19(3), 279-296.