Munich Personal RePEc Archive
Not all international monetary shocks
are alike for the Japanese economy
Vespignani, Joaquin L. and Ratti, Ronald A.
University of Tasmania, University of Western Sydney
15 July 2013
Online at
https://mpra.ub.uni-muenchen.de/48709/
Not all international monetary shocks are alike for the Japanese economy
Joaquin L. Vespignania* and Ronald A. Rattib**
a
University of Tasmania, School of Economics and Finance, Australia b
University of Western Sydney, School of Business, Australia
Abstract
It is found that over 1999:1-2012:12 China’s monetary expansion influences Japan through
the effect of China’s growth on world commodity prices, increased demand for imports, and exchange rate policy. China’s monetary expansion is associated with significant increases in
Japan’s industrial production, exports and inflation, and decreases in the trade-weighted yen. In contrast, U.S. monetary expansion results in contraction in Japan’s industrial production, exports and trade balance (expenditure-switching). Monetary expansion in the Euro area does not significantly affect Japan. Structural vector error correction models are estimated. Results are robust to various contemporaneous restrictions for the effect of international monetary variables, the interaction of foreign and domestic variables and to factor augmented VAR to identify monetary shocks.
Keywords: International Monetary shocks, Japanese economy, Oil/commodity prices, SVEC
models,
JEL Codes: E52, F41, F42, Q43
**
Not all international monetary shocks are alike for the Japanese economy
1.Introduction
In the intertemporal models of Svensson and Van Wijnbergen (1989) and Obstfeld
and Rogoff (1995) monetary expansion within a large economy decreases real interest rates
around the world and promotes aggregate demand worldwide. Work on exploring the impact
of monetary expansion in a large economy on other economies has naturally focused on the
role of the U.S. in the international transmission of monetary shocks. Evidence for this
mechanism and that monetary changes in the U.S. have implications for other economies has
been demonstrated in the literature on the diffusion of monetary shocks.1
In this paper we examine the influence of monetary aggregates shocks in the U.S.,
China and the Euro area, on Japan. The topic is particularly interesting because the potential
for big effects on income through a fall in Japan’s interest rate caused by positive monetary
shocks in a large open economy, such as the U.S. or the Euro area, are precluded, because
Japan’s interest rate is already at low levels.2
Examination of the effect of changes in
international monetary aggregates on Japan’s economy is informative since over the period of
analysis these variables capture quantitative easing, something that interest rates, already at
low levels, are unable to do.3 China is now a large economy and the transmission channels for
the influence of monetary shocks in China on other economies is likely to be different from
the mechanism outlined for the influence of the U.S. on other economies.
1
A number of papers have examined the effect of U.S. monetary policy shocks on other economies. Kim (2001) and Canova (2005) find that monetary expansion in the U.S. causes economic expansion in the non-U.S. G-6 and in Latin America by lowering interest rates across these economies. In examining the role monetary policy of the non-U.S. G7 economies Grilli and Roubini (1995) demonstrate that it is important to control for U.S. monetary policy. Di Giovanni and Shambaugh (2008) find that high interest rates in a major country depress the domestic economy of a country that ties its exchange rate to that of the major country.
2 Murota and Ono (2012) present a model in which agents’ preference for liquidity over consumption can result
in stagnation in steady state. Ono et al. (2004) reason that when liquidity preference is insatiable, a liquidity trap arises with the consequence that Keynesian fiscal stimulus can raise private consumption. Ono et al. (2004) find empirical support for the inference of insatiable liquidity preference in Japan.
3
Over the period of this study, 1999:1-2012:12, up until 2005 China operated a dollar
peg and since 2005 the renminbi has floated in a narrow margin around a fixed base rate
defined with reference to a basket of major currencies with undisclosed weights.4 Throughout
the period China has had extensive capital controls in place. In the Mundell–Fleming model
with imperfect capital mobility, sterilization actions under a fixed exchange rate permit an
independent monetary policy for as long as foreign exchange reserves permit.5
It is found that over 1999:1-2012:12 China’s monetary expansion has significant
effects on Japan’s economy that are quite different from those of the U.S. and Euro area. The
influence of China’s monetary expansion on Japan is through the effect of China’s growth on
oil and world commodity prices, China’s increased demand for imports, and China’s
exchange rate policy. The significant rise in commodity prices in response to monetary
expansion in China is reflected in significantly higher inflation in Japan. China’s monetary
expansion is associated with significant increases in Japan’s industrial production. These
expansionary effects on Japan are consistent with China’s monetary expansion accompanying
decreases in the trade-weighted yen and increases in Japan’s real exports.
U.S. monetary expansion has a statistically significant negative effect on Japan’s
short-term interest rate (as hypothesized in the literature) and lowers Japan’s exports and
industrial production. Monetary expansion in the Euro area does not significantly affect
Japan’s exports, industrial production and interest rate. Japan’s real trade balance improves
with monetary expansion in China and worsens with monetary expansion in the U.S. A
structural vector error correction model is used to examine international monetary
4 In the Mundell–Fleming model with perfect capital movement it is not possible to simultaneously have a fixed
exchange rate and an autonomous monetary policy, consequently. A fixed exchange rate links domestic to foreign interest rates with trade in asset markets. A monetary expansion starts a temporary fall in the domestic interest rate relative to foreign interest rates, with the resulting loss of foreign exchange reserves leading to a reversal in the fall of the domestic interest rate.
5
transmission to Japan from U.S., China and the Euro area. Results are robust across a number
of differently specified structural vector error correction models. Results are robust to
changes in contemporaneous restrictions for the effect of international monetary variables,
the interaction of foreign and domestic variables and to factor augmented VAR to identify
monetary shocks.
In the next section recent developments in monetary aggregates and Japanese trade
are briefly discussed. The methodology and the model for the study of the international
monetary effects on Japan are presented in section 3. The empirical results are discussed in
section 4 and checks for the robustness of results are presented in section 5. The results are
discussed in Section 6. Section 7 concludes.
2. Background on the G4
The growing importance of China’s money supply for global liquidity is illustrated in
Figure 1. In Figure 1 the log of M2 money supplies expressed in U.S. dollars in China, U.S.,
Euro area, and Japan (the G4) over 1996:01-2012:12 are presented. By 2012 M2 in China
exceeds that in the U.S., the Euro area, and in Japan. China’s nominal M2 (in USD) increased
on average by 19.5% per year from 1996 to 2011. The behaviour of China’s nominal GDP is
also strongly upward over the period, increasing on average (in U.S. dollars) by 15% per year
(not shown in Figure 1).
The U.S., the Euro area and China are by far the largest trading partners of Japan.
Developments in trade between the U.S., China and the Euro area on the one hand with Japan
on the other are presented in Figure 2, 3 and 4. The dramatic increase in trade between China
and Japan, in absolute terms and relative Japan’s total trade with all nations is illustrated in
Figures 2 through 4. In Figure 2, the ratio of exports plus imports between China and Japan to
total exports plus imports for Japan rises from 8.5% in 1999 to 20% in 2012. Over the same
exports plus imports for Japan falls from 27% (16%) in 1999 to 13% (9%) in 2012. The rise
in China’s influence in trade is particularly marked with regard to Japan’s imports. In Figure
4, Japan’s imports from China, the U.S., and the Euro area relative to total Japanese imports
were 21.5%, 8.5%, and 9%, respectively, in 2012, compared to 13%, 22%, and 13%,
respectively, in 1999. As a market for Japanese goods China has also become much more
important, with China absorbing more Japanese exports than the U.S. and far more than the
Euro area over 2009-2012.
Indices of the nominal trade-weighted index for the yen and renminbi/dollar and
renminbi/yen exchange rates are shown in Figure 5 with all indices being set at 100 at the
start of the sample in January 1999. Prior to 2005 the renminbi was pegged to the U.S. dollar.
Since July 21, 2005 the value of renminbi has been determined with regard to a basket of
currencies among which the dollar has been pre-eminent. Indeed, it can be seen in Figure 5,
that for an extended period from 2008 to 2010 the renminbi/dollar rate didn’t vary (from 6.8
renminbi/dollar). Cai et al. (2012) and Fang et al. (2012) show that post 2005, consideration
of the parity of the exchange rate of the renminbi against the U.S. dollar dominates the
influence of the other currencies in determining the overall value of the renminbi (the other
currencies include the Euro, Japanese yen and South Korean won).
In Figure 5 there is a tendency for the renminbi/dollar exchange rate to fall since 2005
as the U.S. dollar weakened against other currencies. The renminbi/yen exchange rate has
risen and fallen over 1999-2012, with an index value in December 2012 of 97.925 just over
2% below the value in January 1999. Despite this small adjustment of the renminbi/yen
exchange rate, the nominal trade-weighted index for the yen has risen over 1999-2012 with
an index value of 121.285 in December 2012. Thus, by the end of the 1999-2012 period the
yen has risen on a trade-weighted basis, but has fallen slightly against the renminbi. In line
dollar has weakened against the yen. The dollar/yen index (not shown) stands at 130.072 in
December 2012 (compared to 100 in January 1999).
In models of the international transmission of monetary shocks discussion of effects
on interest rates plays a large role. The Federal Funds rate for the U.S. and the central bank
discount rates for China, Japan, and the Euro area are reported in Figure 6. The discount rate
in Japan is at extremely low levels over 1999-2012. The Federal Funds rate for the U.S. has
been close to zero since late 2008.
3. Methodology
The impact of a monetary expansion in the U.S., Euro area and China on the Japanese
economy is analysed by constructing a structural vector error correction model (SVEC).
Building on Kim and Roubini (2000), we use a mix of stationary and non-stationary variables
to incorporate the co-integration relationship among non-stationary variables. The selection
of variables and identification restrictions in the model with be based on Sims and Zha (1995)
and Kim and Roubini (2000) to the extent possible given that the effects of U.S., Euro area
and China monetary policy shocks on the Japanese economy are the focus of the analysis.
3.1. The variables and data
The variables in the basic model are introduced here. The international variables are
the United States (U.S.) monetary aggregate M2 in U.S. dollars , Euro area
monetary aggregate M2 in U.S. dollars the Chinese monetary aggregate M2 in
U.S. dollars , and oil prices in U.S. dollars . The domestic variables for
Japan are the short term interest rate , the Japanese monetary aggregate M2 in
U.S. dollars , the Japanese consumer price index , the Japanese
The sample period 1999:1 to 2012:12 is determined by the availability of monthly M2
data for the Euro area with the creation of the European Central Bank and by the observation
that the People’s Bank of China started concentrating on balance sheet adjustment for the
conduct of monetary policy in 1998 (Johansson (2012)). M2 is chosen as measure of
monetary aggregate since it is the broadest monetary aggregate available for these four
largest economies for the full period 1999:1 to 2012:12. M2 is the only monetary aggregate
available for china over this period at monthly frequency (e.g. Chinese M3 data is not
available). Koz´luk and Mehrotra (2009) and Johansson (2012) use M2 as the measure of
China’s monetary policy. Koz´luk and Mehrotra (2009) and Johansson (2012) find that
China’s monetary expansion significantly impacts real activity equity markets, respectively,
in East and Southeast Asian countries. Fan et al. (2011) report that M2 is the key variable for
the conduct of monetary policy in China.
The monetary aggregates over the period of analysis capture quantitative easing.
Given that interest rates are at low levels, central banks have introduced quantitative easing
(increasing the monetary base and money supply by buying securities) by central banks in an
attempt to increase lending and liquidity.6 A short-term interest rate and M2 is included
among the variables for Japan. Nakashima and Saito (2012) examine alternative functional
forms for money demand in Japan and find that an interest rate semi elasticity function form
is stable for demand for M1 and for M2 plus certificates of deposit.7
6
Quantitative easing has been used because the official nominal short-term interests used for monetary policy are low and extraordinary actions are believed to be called for. The U.S. Federal Reserve announced QE1 in late November 2008, QE2 in November 2010, and QE3 on 13 September 2012. The European Central Bank has been buying covered bonds, a form of corporate debt. The Bank of Japan announced enormous expansions its asset purchase program in October 2011 and on April 4, 2013. The latter event is likely to lead to a doubling of the money supply.
7
G4 monetary aggregates, industrial production indexes, consumer price indices and
short-term interest rate (Federal Funds rate for the U.S. and discount rate for the other
countries), and oil price (West Texas Intermediate crude oil price) data are from the Federal
Reserve of St. Louis (FRED). An all commodity price index (U.S. dollar index) is from the
World Bank and an index for all energy prices (U.S. dollar index) is from the International
Monetary Fund. Japan’s nominal and real trade weighted yen exchange rate, nominal and real
exports and imports and the real trade balance are from Central Bank of Japan.8 The nominal
trade weighted indices for the U.S. dollar and the Euro are from FRED and for the Chinese
renminbi is from J.P. Morgan. Monetary aggregates M2 are measured in nominal terms in
line with Kim and Roubini (2000) and Koray and McMillin (1999). U.S. dollar amounts are
used because the global oil price and commodity price index are U.S. dollar indices.
3.2. Unit root and Cointegration
The assumption of the VAR/VEC model requires that all variables in the model must
be stationary, or that the linear combinations of non-stationary but co-integrated variables
must be stationary. In Table 1 all variables in the model are shown to be first difference
stationary.9 For robustness of the analysis, results in Table 1 are presented for both the
Augmented Dickey-Fuller (ADF) test, where the null hypothesis is that the variable has a unit
root, and the Kwiatkowski–Phillips–Schmidt–Shin (KPSS) test, where the inverse null
hypothesis is tested.10 In line with the quantity theory of money, it is standard to test for
cointegration relationships among the (log of) the variables prices, money and output.
Swanson (1998), Bachmeier and Swanson (2005) and Garratt et al. (2009) find evidence of
this long run relationship.
8
The yen's trade-weighted index is calculated using the weighted geometric average of the yen's exchange rates against 15 major currencies. The weights are based on the average of Japan’s relative exports to trading partners.
9
Note that Japanese interest rate is not included in the table because the interest rate is already express in percentage. Interest rate is widely used in the macroeconomic literature without further transformations.
10
In table 2, cointegration among the log of Japanese prices (CPI), money (M2) and
income (industrial production) is tested using the Johansen cointegration test under different
assumptions such as the inclusion of linear and quadratic trend and intercept. Results
consistently show that there is a cointegration vector among these variables during the period
1999:1 to 2012:12. Consequently, a SVEC model using an error correction term (ECT)
among the log of prices, money and output is preferred, allowing the short and long term
properties of the datato be captured.
3.3. Model and identification strategy
The SVEC model can expressed as:
∑ ∑ (1)
where is the optimal lag length, determined by the Schwarz information criterion (SIC) in
this case two lags are selected. is vector of endogenous variables. is a vectors of the
country-specific exogenous variables. We use the industrial production and the interest rate
of China, of the U.S. and of the Euro area as exogenous variables. The exogenous variables
are including to isolate the effect of foreign monetary shocks from real activity and to
distinguish between foreign money supply and demand. The , , and are matrices of
coefficients to be estimated. The is the vector of structural changes, which is serially and
mutually independent.
The vector can be expressed as:
[ ] (2)
And the error correction term :
( ) ( ) (3)
[ ] (4)
j
t X
t
Non-recursive contemporaneous restrictions are preferred in this study in line with
Bernanke (1986), Sims and Zha (1995), Kim and Roubini (2000) and Kim (2001). In
particular our identification scheme is based on Kim and Roubini (2000), to the extent
possible. Restrictions are only imposed in the contemporaneous matrix as:
[ ] ( ( ) ( ) ( ) ) (5)
In this system, the three international monetary aggregates, the U.S, Euro area and
Chinese M2 and oil prices are treated as contemporaneously exogenous assuming some
information delay from international to domestic variables. Consistent with Kim and Roubini
(2000), and following Sims and Zha (1995), the central bank reaction function (the fourth
equation in system 4) only responds contemporaneously to domestic monetary aggregates,
nominal exchange rate and oil prices as information regarding other variables are not
available within a month.
In the fifth equation restrictions are in line with Kim (1999 and 2001) and
Kim and Roubini (2000), implying that demand for real money depends on both real income
and nominal interest rate. Restrictions in both the inflation and output equations (sixth and
seventh equation respectively) are standard in the economic literature assuming that oil prices
affect these variables in the same period, as oil is crucial inputs for many sectors.11 Kim and
Roubini (2000), Kim (1999) and Kim (2001) treat oil prices and/or commodity prices as
contemporaneously exogenous. The exchange rate equation is affected contemporaneously by
11
all other variables as international exchange rate operators may arbitrage daily with all
available information.
3.3. Test of stability, Heteroskedasticity and stability condition
To test for autocorrelation the residual serial correlation LM test is carried out and
p-values results estimated. The null hypothesis of no serial correlation cannot be rejected at
conventional levels for the model set out in equations (1) to (4) and for the alternatives
specifications introduced later. Therefore autocorrelation does not seem to be a problem in
these models. Results are also confirmed by both the VAR residual cross-correlation
(correlograms) and by VAR residual Portmanteau test for autocorrelation.
To test for heteroskedasticity, the VAR residual heteroskedasticity test is performed.
In this test, all possible combinations of error term products are used as dependent variables.
The null hypothesis of no heteroskedasticity cannot be rejected at 5% level for the joint
hypothesis of all combinations for our models. The White heteroskedasticity test either using
no cross terms and cross terms also confirms the previous results. Therefore, the hypothesis
of heteroskedasticity in our models is discounted.
The stability condition for the VEC model, with r co-integrating equation and k
endogenous variables, requires that at most k-r roots should be equal to unity, while the other
roots must lie inside the unit root circle.12 Consequently, the inverse roots of the characteristic
AR polynomial test are performed for each model. These tests find that this condition is
satisfied for all model presented in this investigation.
3.4. Model extensions
To obtain more information about the transmission mechanism from international
monetary variables to the Japanese economy, we follow Kim (2001) in adding one variable at
12
the time to the system presented in equations 1-4. These variables will include Japanese real
exports, real imports and real trade balance andthe real trade weighted index of the yen.13
To establish the robustness of results, the sensitivity of results to the lag selection
strategy will be examined, and the implications of different contemporaneous restrictions for
the effect of international monetary variables on the other variables will be reported. Results
are obtained and shown to be unchanged if a global commodity price index or a global energy
price index are used instead of oil prices in the SVEC systems estimated. Extension of the
model to allow for interaction of foreign and domestic variables and to recognize the global
financial crisis will be estimated. A factor augmented VAR (FAVAR) to identify monetary
policy shocks will also be estimated.
4. The empirical results
4.1. The impulse response effects of the structural monetary shocks
Figure 7 shows the dynamic response (or impulse response function) of the Japanese
short term interest rate, M2, consumer price index, industrial production index, oil price
index, and the nominal effect trade-weighted yen exchange rate, in the SVEC in equations
(1)-(4) to generalized impulse response to monetary shocks in China, the U.S. and the Euro
area. The dashed lines represent a one standard error confidence band around the estimates of
the coefficients of the impulse response functions.14 The first, second, and third columns
show the responses of Japanese variables to structural innovations in China M2, Euro area
M2, and U.S. M2, respectively.
In the first row in Figure 7, the short term Japanese interest rate rises significantly to
innovations in China’s M2. This response is consistent with the other effects of China’s M2
13
The real trade balance is defined by the Bank of Japan as real exports minus real imports denominated in 2010 prices, indexed so that for the base year 2010 the real trade balance is equal to 100.
14
that tend to be expansionary for the Japanese economy. The short term Japanese interest rate
does not respond significantly to an innovation in Euro area M2. The short term Japanese
interest rate falls significantly to innovations in the U.S. M2. This latter result is consistent
with a defensive response by the Japan to a stimulus by the U.S. that weakens the dollar and
makes Japanese goods more expensive in the U.S. In the second row of Figure 7, Japan’s M2
tends to fall with positive shocks in M2 in China and in the U.S. and to rise with positive
shocks in M2 Euro area. The effects of the international monetary shocks on Japan’s M2 are
not statistically significant.
In the third row in Figure 7, Japan’s CPI is significantly affected by innovations in
China’s M2. A positive shock to China’s M2 results in a rise in Japan’s CPI that is
statistically significant after three months. The magnitude of the rise in the CPI is gradually
increasing. This effect on the CPI will be seen to be connected with the effect of shocks to
China’s M2 on oil and commodity prices. Japan’s CPI is not significantly affected by shocks
in Euro area M2. In Figure 7, a positive shock to U.S. M2 results in a fall in Japan’s CPI that
becomes statistically after seven months. These results on Japan’s CPI will tie in with the
effects of the international monetary shocks on global oil and commodity prices.
In the fourth row in Figure 7, Japan’s industrial production is positively and
significantly impacted by positive shocks to China’s M2, not significantly impacted by
shocks to Euro area M2, and negatively and significantly impacted by positive innovations in
U.S. M2. These results will be related to the effect on Japan’s real exports of shocks to each
of the countries’ monetary aggregates.
The effects of shocks to China’s M2, U.S. M2, and Euro area M2 on international oil
price are shown in the fifth row in Figure 7. A positive innovation in China’s M2 has a
months and then gradually increases in magnitude over 20 months.15 A positive shock in
Euro area M2 has a positive effect on oil prices, but the effect is small and only marginally
statistically significant. A shock in U.S. M2 has a statistically insignificant effect on global
oil prices.
The response effects of the nominal trade-weighted Japanese yen exchange rate
currency to shocks to China’s M2, U.S. M2, and Euro area M2 are shown in the last row in
Figure 7. The response to a positive shock to U.S. M2 is initially positive (the value of the
yen is increased) but is not statistically significant. A positive shock in Euro area M2 has a
negative effect on the nominal trade-weighted yen, but the effect is only statistically
significant in the fourth month. A positive shock in China’s M2 has a statistically significant
negative effect on the nominal trade-weighted yen from impact. This effect would raise the
price of imports in Japan and reinforce the effect on the Japanese consumer prices of the
effect positive innovations in China’s M2 on the U.S. dollar price of oil.
The significant effect of shocks to China’s M2 on the nominal trade-weighted yen
exchange rate requires further discussion. A rise in China’s M2 facilitates domestic growth in
China and increases China’s demand for imports. The currencies of the countries supplying
imports to China experience upward pressure. To stabilize the peggedexchange rate, China
intervenes in the foreign exchange market and sells foreign currency. The net effect of these
actions on the nominal trade-weighted yen exchange rate depends on the mix of imports, and
the mix of foreign currencies sold in the foreign exchange market. The latter will be
influenced by the weights assigned to currencies in the reference basket of major currencies
15
to which the renminbi is allowed to float within a narrow margin. It is found as an empirical
result that the net effect of China’s actions following a positive innovation in China’s M2 is a
decrease in the nominal trade-weighted yen exchange rate.
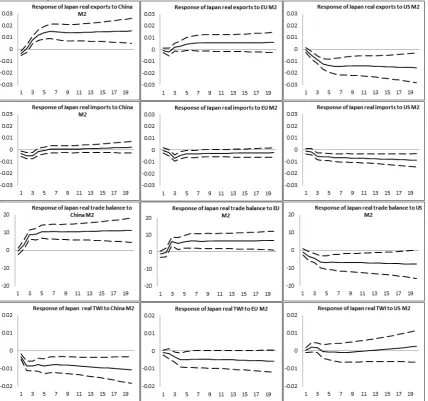
4.2. Responses of Japan’s trade variables to monetary shocks
The impact of monetary shocks originating in the U.S., China and the Euro area on
Japanese trade variables will be now examined. Following a procedure in Kim (2001) the
Japanese real exports, real imports and real trade balance are now added one variable at a
time as an additional variable in the SVEC system in equations (1)-(4). The first, second, and
third columns in Figure 8 show the responses of Japanese variables to a generalised impulse
response in China M2, Euro area M2, and U.S. M2, respectively.
In the first and second rows of Figure 8 the impulse response functions of Japan’s real
exports and real imports to the international monetary shocks are reported. A positive shock
to China’s M2 significantly expands Japan’s real exports. The rise in Japan’s real exports
builds up rapidly over five or six months and then persists. This result is consistent with
increases in China’s M2 being associated with significant reduction in the trade-weighted
Japanese yen exchange rate. A positive shock to U.S. M2 has a significant negative effect on
Japan’s real exports. A positive shock in Euro area M2 does significantly impact Japan’s real
exports. In the second row of Figure 8, the effects of the international monetary shocks on
Japan’s real imports are small compared to the effects on Japan’s real exports. The effects of
shocks to China M2 and Euro area M2 on Japan’s real imports are not statistically
insignificant. A positive shock to U.S. M2 has a significant negative effect on Japan’s real
imports.
In the third row of Figure 8 the impulse response functions of Japan’s real trade
balance to structural innovations in China’s M2, Euro area M2, and U.S. M2 are reported.
shocks in China’s M2. This is consistent with large positive increase in Japanese real exports
attendant on depreciation of trade-weighted yen following a positive shock in China’s M2 and
with Japan’s real imports being price inelastic. A positive shock in Euro area M2 also has a
significant positive (but smaller) impact Japan’s real trade balance. A positive shock to U.S.
M2 has a significant negative effect on Japan’s real trade balance.
In the last row of Figure 8, the responses of the real trade-weighted Japanese yen
exchange rate currency to the international monetary shocks are reported. The results for the
real weighted Japanese yen to shocks are very similar to those for the nominal
trade-weighted Japanese yen. A positive shock in China’s M2 has a statistically significant negative
effect on the real trade-weighted yen that persists. The response of the real trade-weighted
Japanese yen to positive shocks to U.S. M2 Euro area M2 are not statistically significant.
5. Robustness checks
In this section several changes are made to the model in equations (1) through (5) to
examine the robustness of results.
5.1. Lag length
First, we check the sensitivity of our results to the lag selection strategy. The Akaike
Information Criterion (AIC) is also widely used in time series analysis when a longer
structure is preferred; in our model this criterion selected three lags. Kim and Roubini (2000),
Kim (2000) and Kim (2001) used a more arbitrary lags structure fixing the lags at six. Our
model is robust to both the used of three lags selected by the AIC and six lags used by other
researches.16
5.2. Contemporaneous restrictions
16
Secondly, we will use two different contemporaneous restrictions for the international
monetary variables. The alternative SVEC systems are given by the following (based on
equations (1) to (4)):
[ ] ( ( ) ( ) ( ) ) (6) [ ] ( ( ) ( ) ( ) ) (7)
The first alternative restriction scheme is presented in equation (6). In this equation
we allow all monetary aggregates variables (international and domestic) to affect each other
contemporaneously. In equation (7), we allow the international monetary variable to affect
contemporaneously the Japanese TWI. Although, the log likelihood ratio test for over
identified restrictions support the restrictions selected in equation (5) (with higher chi-square
[image:18.595.73.512.157.471.2]coefficient), our general results show to be robust to this two different restrictions sets. In
Table 3, the log likelihood ratio for over-identification test Chi-square values are reported for
the three models shown in equations (5), (6) and (7). The highest value for over-identification
test restriction is for our model of choice in equation (5), indicating that the restriction cannot
The estimation of the SVEC models outlined in equations (6) and (7) results in
impulse response of the U.S. economic variables to positive shocks to China’s M2 that are
very similar to those shown in Figure 7. In all models a positive innovation in China’s M2 is
associated with a positive and statistically significant effect on oil price (or on commodity
prices) that builds up rapidly over three months and then persists for twenty month time
horizon shown. Based on the models in equations (6) and (7), a positive innovation in
China’s M2 results in a positive and statistically significant effect on Japan’s consumer price
index that persists, a statistically significant depreciation of the nominal (and real)
trade-weighted yen for about twelve months, and a positive and statistically significant effect on
Japan’s real trade balance for twenty month time horizon shown. These results are available
from the authors.
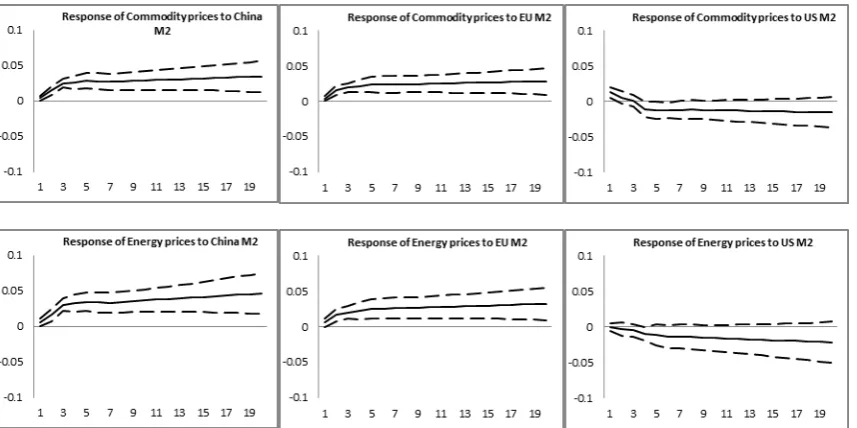
5.3. Global commodity and energy price indices
In line with Dedola and Lippi (2005) and Anzuini et. al. (2012) measures of
commodity price other than oil price are now introduced into the model. Results are
essentially unchanged if a global commodity price index (or a global energy price index) are
used instead of oil prices in the SVEC systems described in equations (1) to (5). In Figure 9
the response of global commodity price index (World Bank) and of the response of global
energy price index (IMF) to the international monetary shocks are reported when these
indices replace oil price in the equations (1) to (5). The results are similar to those for the
response of oil price to the international monetary shocks.
A positive innovation in China’s M2 has a statistically significant positive effect on
global commodity prices that rapidly builds up over four or five months and then persists, and
has a statistically significant positive effect on global energy prices that rapidly builds up
over three months, persists and gradually increases in size. A positive shock in Euro area M2
prices that persist. The effect of positive shock in Euro area M2 on global commodity prices
and on global energy prices are smaller than the effect of positive innovations in China’s M2
on global commodity and global energy prices. A shock in U.S. M2 has a statistically
significant effect on global commodity oil prices in the first month and the effect thereafter is
statistically insignificant. The responses of global energy prices to shocks to U.S. M2 are not
statistically significant.
5.4. Global financial crisis
We use monthly data from 1999 to 2012. Monetary policy has undoubtedly changed
since the global financial crisis and there may be a structural change in the way monetary
policy affects the economy. Overall, several aspects of macroeconomic variables had unique
characteristics during the recent global recession. Perri and Quadrini (2011), for example,
document an unprecedented business cycle synchronization among the developed countries
during the last two quarters of 2008.17 China is not included in the analysis and did not
experience the recession so marked among the developed countries. It would be useful to see
if the results change considering a sample where the financial crisis is not included. To this
end we will include the period of the global financial crisis
To deal with the global financial crisis we take several approaches. First, we introduce
in a dummy variable that takes the value 1 from July 2008 to December 2008 and 0 otherwise
into equation (1).18 Second, we estimate the model with truncated samples that exclude the
worst of the crisis, that is over 1999:01 to 2008:05 and 2009:01 to 2012:12 and over 1999:01
17
Perri and Quadrini (2011) find that the last two quarters of 2008 stands out in the post-war era in terms of GDP falling by so much and in all countries G7 countries. The G7 is the U.S., Japan, Germany, U.K., France, Italy and Canada. The correlation of GDP movements among the developed countries during the last two quarters of 2008 jumped from 0.3 to 0.7 and the sample standard deviation of the correlations fell from 0.19 to 0.09.
18
to 2008:08 and 2008:12 to 2012:12. Results are essentially unchanged from those in Figures
7 and 8 from following these strategies for dealing with the global financial crisis (and are
available from the authors). Results will be presented in the next subsection when taking
account of the global financial crisis is combined with changes in model identification.
5.5. Interaction among foreign and domestic variables
In equation 1, foreign industrial productions and interest rates are taking as exogenous
and consequently the model restricts the interaction among foreign industrial productions,
foreign interest rates and those with the domestic economy. In this section we show that when
both foreign industrial productions and interest rates are including in the model as
endogenous variables, so as to allow for interaction of foreign and domestic variables, results
are similar to those obtained in figure 7. To specify this alternative model we estimate a
15-endogenous-variable SVEC model where the U.S., Euro area and China interest rate are
placed ahead of those countries M2 in equation 5 and these countries individual industrial
productions are placed after foreign M2 in the same equation.19 In addition a dummy variable
that takes the value 1 from July 2008 to December 2008 to global financial crisis.
Figure 10 shows the dynamic response (or impulse response function) of the Japanese
variables in this SVEC model to generalized impulse response to monetary shocks in the
U.S., Euro area and China. Results with these additional endogenous variables and a global
financial crisis variable are remarkably similar to those in Figure 7. The results for China’s
monetary expansion are unchanged. China’s monetary expansion increases global oil prices
and increases Japan’s inflation, industrial production, exports (in results not shown) and
decreases the nominal trade-weighted value of the yen. The results for the Euro area
monetary expansion are modified somewhat, in that now the effects of innovations to Euro
19
area M2 have statistically insignificant effects on the Japanese variables. The results for U.S.
monetary expansion are little different from estimating the model (1) through (5).
5.6. The FAVAR model
The identification strategy followed in this paper is inspired by Kim and Roubini
(2000) and Kim (2001), among others. There has been a growing literature focused on the
identification of monetary policy in a VAR framework.20 For example, Uhlig (2005) uses a
methodology based on sign restrictions. In a related study, Bernanke et al. (2005) propose a
Factor Augmented VAR (FAVAR) to identify monetary policy shocks. They find that a small
number of variables in a VAR may not span the information set used by market participants,
who are known to follow hundreds of data series. Therefore, a set of factors can summarize
large amounts of information about an economy. Given that we are analysing the effects of
foreign shocks on the Japanese economy, it can be argued that there is no need to restrict the
analysis to a small number of series given that we could use a large dataset with a
methodology like the FAVAR model. Consequently, we estimate a FAVAR model to check
the robustness of our results. To construct a FAVAR model we develop a principal
component vector by including the variables: interest rate, consumer price index, industrial
production, nominal trade weighted index for each of the other three largest economies
(China, the U.S. and the Euro area). This vector is included as an endogenous variable and
placed as the first variable in augmented system (1), (2), (3) and (5).21 Results (available
20
Another approach considered in the literature is use of a global VAR (GVAR) by Dees et al. (2007). The GVAR combines separate models for each of the many economies linking core variables within each economy with foreign variables using quarterly data. The foreign variables external to a domestic economy are trade-weighted. In our study we do not pursue a GVAR or GVEC for the following reasons. With monthly data, construction of time varying weights is not possible given the absence of bilateral trade data on a monthly basis for China and the fact that the activity variable in each country, industrial production, is an index. Also, the alternative of using fixed weights is also not appropriate given the rapid increase over time in the influence of China in the trade statistics.
21
under request) are remarkably similar to those obtained in figure 7, showing the robustness of
our model.
6. Discussion of the results
The predictions of the Mundell–Fleming and the sticky price (or sticky wage)
intertemporal models provide a basis for the evaluation of expansionary monetary policy in
the Euro area and the U.S. on Japan since their capital markets are fairly well integrated. In
the Mundell–Fleming model monetary policy expansion results in beggar-thy-neighbour
effects under flexible exchange rates. Monetary expansion in a country leads to currency
depreciation and an improving trade balance through expenditure-switching, with the
implication of falling incomes in other countries. The improvement in the trade balance and
the fall in foreign income might be mitigated by the income-absorption effect (increased
income in the inflating country leading to increased demand for imports).
In the intertemporal general equilibrium model of Obstfeld and Rogoff (1995),
monetary expansion in a country leads to currency depreciation and also lowers the world
real interest rate in proportion to the increase in the world money supply and this raises global
demand.22 Currency depreciation of the country increasing the money supply shifts world
demand toward goods production in that country at the expense of production in other
countries. It is possible that output in the countries with appreciating currencies could fall, but
if the inflating country is large and integrated into the global capital market the fall in world
interest rates could have large stimulative effects on smaller economies that compensates for
the expenditure switching effect.
Our empirical results suggest that U.S. monetary expansion leads in the first three or
four months to an appreciation in the nominal trade-weighted yen (that is not statistically
statistical grounds. We choose one factor and two lags to retain parsimony in the factor augmented VEC approach.
22
significant). There is a worsening in the Japanese real trade balance (the expenditure
switching effect), with real exports falling more than real imports, and a fall industrial
production. An income absorption effect (if any) does not offset expenditure switching. A
statistically significant fall in the Japanese interest rate is associated with a positive shock in
U.S. M2, but the impulse results overall suggest that U.S. monetary expansion has a
depressing effect on the Japanese economy over the 1999-2012 period. The results suggest
that Euro area monetary expansion does not have statistically significant effects on Japanese
variables. Effects on Japanese trade variables are small from Euro area monetary expansion.
The results of U.S. monetary expansion for Japan can be contrasted with those
obtained by Kim (2001) for the flexible exchange rate period 1974-1996.23 Kim (2001) finds
that monetary expansion in the U.S. causes a reduction in interest rates and boom in the
non-U.S. G-6 (in that GDP and industrial production increase in those countries). The trade
balances of the non-U.S. G-6 with the rest of the world are not significantly affected by U.S.
monetary expansion, indicating that income-absorption is important. Kim (2001) concludes
that the boom in non-U.S. G-6 is due to the fact that the stimulative effect of the decline in
non-U.S. G-6 interest rates attendant on U.S. monetary expansion.
The results for the effects of U.S. monetary expansion on Japan over 1999-2012 are
very different from those reported for the period 1974-1996 during which positive U.S.
monetary shocks have expansionary effects on the Japanese economy. There are several
potential reasons for this difference. The U.S. economy is not as dominant as it once was and
the Japanese economy has been in depressed state for an extended period. The potential for
big effects on Japan’s economy through U.S. or Euro area monetary expansion influencing
23
Japan’s short-term interest rate are precluded because of the close to zero interest rates in
Japan.24
The discussion of the transmission mechanism of monetary shocks from the U.S. and
the Euro area to Japan in terms of the Mundell–Fleming and the sticky price (or sticky wage)
intertemporal models is about economies with flexible exchange rates that are integrated into
world capital markets. These conditions do not necessarily apply to changes in China’s
money supply. China has a fixed exchange rate regime and maintains the value of the
Chinese renminbi relative to the U.S. dollar and, since 2005, a basket of other currencies.
China has extensive capital controls and the financial system remains tightly controlled. An
interest rate mechanism is not available through capital markets even if Japan’s interest rates
were not at rock bottom levels. How are shocks to the Chinese money supply transmitted to
Japan and the rest of the world?
The influence of China’s monetary expansion on Japan is through the effect of
China’s growth on global oil and commodity prices, China’s increased demand for imports,
and China’s exchange rate policy. China’s monetary expansion is associated with statistically
significant decreases in the nominal and real trade-weighted value of the yen. The significant
rise in commodity prices in response to monetary expansion in China and decrease in the
trade-weighted yen is reflected in significantly higher inflation in Japan. China’s monetary
expansion is associated with significant increases in Japan’s real exports and industrial
production.
7. Conclusions
It is found that over 1999:1-2012:12 China’s monetary expansion has significant
effects on Japan’s economy that are quite different from those of the U.S. and Euro area.
24Ono (2006) argues that Japan’s stagnation and decline in the marginal utility of consumption relative to that
Capital controls in China provide room for monetary policy independence in China even
though the exchange rate is pegged (either to the U.S. dollar or to a basket of major
currencies). Monetary expansion in China is reflected in significantly higher oil/commodity
prices and inflation in Japan. In all models a positive innovation in China’s M2 is associated
with positive and statistically significant effects on oil price (or on commodity prices) and on
Japan’s consumer price index that build up rapidly over three or four months that then persist.
China’s monetary expansion significantly decreases the nominal and real trade-weighted yen
exchange rates. China’s monetary expansion is associated with significant increases in
Japan’s exports and industrial production.
U.S. monetary expansion has a statistically significant negative effect on Japan’s
short-term interest rate. This result is in line with economic theory that monetary expansion
within a large economy decreases real interest rates around the world. However, since
Japan’s interest rate is at such low levels over the period of analysis, large decreases in
interest rates are not possible, precluding significant positive effects on income through an
interest rate channel from monetary shocks in the U.S. (or the Euro zone). U.S. monetary
expansion lowers Japan’s exports and industrial production. Monetary expansion in the Euro
area does not significantly affect Japan’s exports, industrial production and interest rate.
Japan’s real trade balance improves with monetary expansion in China and worsens with
monetary expansion in the U.S. A structural vector error correction model is used to examine
international monetary transmission to Japan from U.S., China and the Euro area. Results are
References
Anzuini, A., Lombardi, M.J., Pagano, P., 2012. The impact of monetary policy shocks on commodity prices. Bank of Italy Working Paper, Number 851.
Bachmeier, L.J., Swanson, N.R., 2005. Predicting Inflation: Does The Quantity Theory Help? Economic Inquiry 43, 570-585.
Bernanke, B., Boivin, J., Eliasz, P.S., 2005. Measuring the Effects of Monetary Policy: A Factor-augmented Vector Autoregressive (FAVAR) Approach. Quarterly Journal of Economics 120, 387-422.
Cai, Z., Chen, L. and Fang, Y., 2012, A new forecasting model for USD/CNY exchange rate", Studies in Nonlinear Dynamics & Econometrics, 16(2), forthcoming.
Canova, F., 2005. The transmission of US shocks to Latin America. Journal of Applied Econometrics 20, 229–251.
Christiano, L.J., Eichenbaum, M., Evans, C., 1999. Monetary policy shocks: What have we learned and to what end? In: Taylor, J.B., Woodford, M. (Eds.), Handbook of Macroeconomics, Vol. 1A. North-Holland, Amsterdam, pp. 65–148.
Dedola, L., Lippi, F., 2005. The monetary transmission mechanism: Evidence from the industries of five OECD countries, European Economic Review 49, 1543-1569.
Dees, S., di Mauro, F., Pesaran, M.H., Smith, L.V., 2007, Exploring the international linkages of the euro area: a global VAR analysis. Journal of Applied Econometrics 22, 1-38.
Di Giovanni, J., Shambaugh, J. C., 2008. The impact of foreign interest rates on the economy: The role of the exchange rate regime. Journal of International Economics 74, 341-361.
Fan, L., Yu, Y., Zhang, C., 2011. An empirical evaluation of China’s monetary policies. Journal of Macroeconomics 33, 358–371.
Fang, Y., Huang, S., Niu, L., 2012. De facto currency baskets of China and East Asian economies: The rising weights. Bank of Finland BOFIT Discussion Papers, 2-2012.
Fujiwara, I., 2007. Is there a direct effect of money?. Money's role in an estimated monetary business cycle model of the Japanese economy. Japan and the World Economy 19, 329-337.
Garratt, A., Koop, G., Mise, E., Vahey, S.P., 2009. Real-Time Prediction With U.K. Monetary Aggregates in the Presence of Model Uncertainty. Journal of Business & Economic Statistics, American Statistical Association 27, 480-491.
Goodfriend, M., Prasad, E., 2007. A framework for independent monetary policy in China. CESifo Economic Studies 53, 2-41.
Grilli, V., Roubini, N., 1995. Liquidity and exchange rates: puzzling evidence from the G-7 countries. Working paper, Yale University, CT.
Hamilton, J.D., 2013. Historical Oil Shocks. Chapter 21 in The Routledge Handbook of Major Events in Economic History, Randall E. Parker (Editor), Robert M. Whaples (Editor), Routledge, New York, 239-265.
Hosono, K., 2006. The transmission mechanism of monetary policy in Japan: Evidence from banks' balance sheets. Journal of the Japanese and International Economies 20, 380-405.
Johansson, A.C., 2012. China’s Growing Influence in Southeast Asia – Monetary Policy and Equity Markets. The World Economy 35, 816-837.
Kilian, L., Hicks, B., 2013. Did Unexpectedly Strong Economic Growth Cause the Oil Price Shock of 2003-2008? Journal of Forecasting 32, 385-394.
Kim, S., 1999. Do monetary policy shocks matter in the G-7 countries? Using common identifying assumptions about monetary policy across countries. Journal of International Economics 48, 387–412.
Kim, S., 2001. International transmission of US Monetary policy shocks: evidence from VARs. Journal of Monetary Economics 48, 339–372.
Kim, S., Roubini, N., 2000. Exchange rate anomalies in the industrial countries: a solution with a structural VAR approach. Journal of Monetary Economics 45, 561–586.
Koray, F., McMillin, W. D., 1999. Monetary shocks, the exchange rate, and the trade balance. Journal of International Money and Finance 18, 925-940.
Koz´luk, T., Mehrotra, A., 2009. The Impact of Chinese Monetary Policy Shocks on East and South-East Asia. Economics of Transition 17, 121–45.
Ma, G., McCauley, R.N., 2011. The evolving renminbi regime and implications for Asian currency stability. Journal of the Japanese and International Economies 25, 23-38.
Murota, R., Ono, Y., 2012. Zero Nominal Interest Rates, Unemployment, Excess Reserves And Deflation In A Liquidity Trap. Metroeconomica 63, 335-357.
Nagayasu, J., 2007. Empirical analysis of the exchange rate channel in Japan. Journal of International Money and Finance 26, 887-904.
Nakashima, K., Saito, M., 2012. On the comparison of alternative specifications for money demand: The case of extremely low interest rate regimes in Japan. Journal of the Japanese and International Economies 26, 454-471.
Ono, Y., 2006. International asymmetry in business activity and appreciation of a stagnant
country’s currency.The Japanese Economic Review 57, 101-120.
Ono, Y., Ogawa, K., Yoshida, A., 2004. The Liquidity Trap And Persistent Unemployment With Dynamic Optimizing Agents: Empirical Evidence. The Japanese Economic Review 55, 355-371.
Pesaran, M.H., Schuermann, T., Weiner, S.M. 2004. Modeling regional interdependencies using a global error-correcting macroeconomic model. Journal of Business and Economic Statistics 22, 129-162.
Perri, F., Quadrini, V., 2011. International Recessions. National Bureau of Economic Research,NBER Working Paper 17201.
Ratti, R.A., Vespignani, J., 2013. Liquidity and Crude Oil Prices: China’s Influence Over 1997-2011. Economic Modelling 33, 517-525.
Sims, C.A., 1980. Macroeconomics and Reality. Econometrica 48, 1-48.
Sims, C.A., Zha, T., 1995. Does monetary policy generate recessions?: Using less aggregate price data to identify monetary policy. Working paper, Yale University, CT.
Sims, C.A., Zha, T., 2006. Does Monetary Policy Generate Recessions?, Macroeconomic Dynamics 10, 231-272.
Stock, J.H., Watson, M.W., 2002. Forecasting using principal components from a large number of predictors. Journal of the American Statistical Association 97, 1167–1179.
Sun, H., 2009. Autonomy and Effectiveness of Chinese Monetary Policy under the De Facto Fixed Exchange Rate System. China and World Economy 17, 23-38.
Svensson, L., Van Wijnbergen, S., 1989. Excess capacity, monopolistic competition and international transmission of monetary disturbances. Economic Journal 99, 785–805.
Swanson, N.R., 1998. Money and output viewed through a rolling window. Journal of Monetary Economics 41, 455-474.
Table 1: Test for unit roots 1999:1-2012:12:
Endogenous variables
Variables ADF KPSS First difference ADF KPSS
0.20 1.79*** -10.08*** 0.09
0.37 1.62*** -2.94** 0.73*
0.30 1.24*** -12.86*** 0.25
0.33 1.35*** -12.98*** 0.24
-2.24 0.94*** -2.76*** 0.10
-2.52 0.35* -10.36*** 0.06
-2.43 1.48*** -9.86*** 0.10
-1.71 0.58** -9.65*** 0.08
Notes: The variables are U.S M2, China M2, Euro area M2 (EU M2), Japan M2 (J M2), Japan consumer price index (J CPI), Japan industrial production (J IP), global oil price (OP), and nominal trade weighted yen exchange rate index (J TWI). The null hypothesis for the Augmented Dickey-Fuller (ADF) test is the variable has a unit root and the null hypothesis for the Kwiatkowski–Phillips–Schmidt–Shin (KPSS) test is the variable is stationary. The first difference of the series is indicated
[image:30.595.67.529.353.460.2]by ∆.The lag selection criteria for the ADF is based on Schwarz information Criteria (SIC) and for the KPSS is the Newey-West Bandwidth. ***, **, * indicates rejection of the null hypothesis at 1%, 5% and 10%, levels of significance.
Table 2: Cointegration test
Variables: , , Selected (0.05 level*) Number of Cointegrating Relations by Model
Data Trend: None None Linear Linear Quadratic Test Type No Intercept Intercept Intercept Intercept Intercept
No Trend No Trend No Trend Trend Trend
Trace 1 1 1 1 1
Max-Eig 1 1 1 1 1
*Critical values based on MacKinnon-Haug-Michelis (1999)
Table 3: Log likelihood ratio test for over-identification restrictions
Null Hypothesis : Restrictions are valid
Model restrictions/Equations 5 6 7
Chi-square value 77.9 42.6 30.1
Figure 1: M2 in billions of U.S. dollars for the U.S., Euro area, Japan and China
Figure 2: Economy region/country trade (exports plus imports) as percentage % of total trade to Japan
Source: Trade statistics of Japan (Minister of finance).
Figure 3: Economy region/country exports as percentage % of total trade to Japan
[image:31.595.74.480.526.691.2]Figure 4: Economy region/country imports as percentage % of total trade to Japan
[image:32.595.74.501.286.465.2]Source: Trade statistics of Japan (Minister of finance).
Figure 5: Exchange rates
Source: Federal Reserve of St. Louis (FRED).
Figure 6: G4 Monetary policy interest rates
[image:32.595.71.500.508.693.2]Figure 7: Impulse responses of Japanese economic variables to one standard deviation generalised innovations of Chinese, Euro area, and U.S. M2 shocks.
Figure 8: Model extensions. Impulse responses of Japanese trade variables to one standard deviation generalised innovations in Chinese, Euro area, and U.S. M2 shocks.
Figure 9: Response of commodity and energy prices to monetary shocks
Figure 10: Robustness analysis allowing for interactions between domestic and foreign variables and with global financial crisis variable