Relationship of Biometrical Aspect of Turritellidae with
Geochronological Aspect in West Java
Hita Pandita1, Yahdi Zaim2, Aswan2, Yan Rizal2
1Department of Geology, Institute of Technology Bandung, Sekolah Tinggi Teknologi Nasional, Yogyakarta, Indonesia 2Department of Geology, Institute of Technology, Bandung, Indonesia
Email: [email protected]
Received February 26, 2013; revised March 28, 2013; accepted April 25, 2013
Copyright © 2013 Hita Pandita et al. This is an open access article distributed under the Creative Commons Attribution License, which permits unrestricted use, distribution, and reproduction in any medium, provided the original work is properly cited.
ABSTRACT
Mollusk paleontology research in Indonesia so far has not been widely utilized in various kinds of applications, espe- cially in the geology. Although mollusk in Java is very rich, the study of correlation between mollusk appearances with geological condition is rare. This study aimed to determine Turritellidae base on morphological observations (qualita- tive) and quantitative (biometric method). The ultimate goal is to find out the relationship between of biometrical aspect of Turritellidae with geological development especially of chronological conditions. Stratigraphic analysis and sampling have done at five location of field survey. Site selection was based on the type locality of mollusk biostratigraphic unit arrange by Martin (1919) [1] and Oostingh (1938) [2]. The scattered analysis shows two large distribution of consistent groups based on shell size and geochronological aspect. Biometrical aspect of Turritellidae is reflection of the chrono- logical aspect in West Java. Small size was appearance in Upper Miocene to Lower Pliocene and large shell in Pliocene to Pleistocene.
Keywords: Biometry; Turritellidae; West Java; Mollusk; Paleontology
1. Introduction
Paleontology research on mollusk has not really been well developed in Indonesia so far. Mollusc paleontology research have been initiated by Jenkins (1863) [3] and continued by Martin (1919) [1], Oostingh (1938) [2], and other that deal with taxonomy and biostratigraphy. Mar- tin (1919) [1] and Oostingh (1938) [2] introduced mol- luscan biostratigraphy in Java based on assemblages and index fossil of mollusc. The research then continued by several researchers such as Pozzobon (1997) [4], Aswan (1997) [5], Shuto (1974) [6], Kase et al. (2008) [7], and others. However most of studies focused on aspects of taxonomy and less at the application of geology. Occur- rences of mollusc fossils have not been optimally utilized in various of geological applications.
Therefore, an assessment of the usefulness of fossil mollusks in various aspects of geology needs to done. One aspect is important to know the relationship of shell growth Turritellidae with the geological aspects.
The aim of this study is to determine the Turritellidae approached by qualitative and quantitative methods and the ultimate goal is to find out the relationship of the oc- currence of Turritellidae with geological development
especially of chronological in the study area.
2. Location and Method
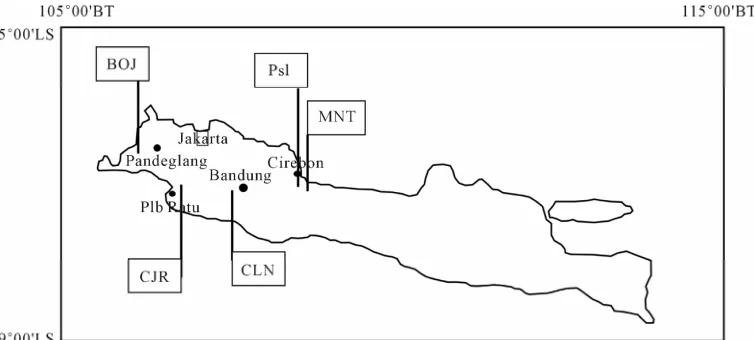
The study areas are located at five locations in West Java area (Figure 1). There are Cilanang Rivers (Mt. Halu),
Cisanggarong Rivers (Menengten/Waled Village), Pasir Ipis (Cirebon), Cijarian River (Pelabuhan Ratu) and Leu- wimeteng (Bojong). The selection of these areas is based on the type locality of biostratigraphic unit as compiled by Martin (1919) [1] and Oostingh (1938) [2].
During field investigations conducted rock sampling, stratigraphic profiling, and fossils sampling. Some rocks and 49 Turritellidae had been collected for five locations. Five stratigraphic profiling from five sites has been done during field study.
Laboratory analysis devided into molusks fossils iden- tify and age determine. Mollusc identify done by mor- phological observation and biometrical measurement of mollusc shell. Age determine based on micropaleontol- ogy data and regional stratigraphy.
3. Stratigraphy
Figure 1. Sampling sites of fossil molluscs family of Turritellidae in West Java. Description of location, CLN: Cilanang; MNT: Menengten; PsI: Pasir Ipis; CJR: Cijarian; BOJ: Bojong.
the biostratigraphic units compiled by Martin (1919) [1] and Oostingh (1938) [2]. Cijarian site for the Tjiodeng stages, Cilanang site for the Tjilanang stages, Menengten and Pasir Ipis sites for Kaliwangu formation, and Bojong for the Bantamian stage (Table 1).
According to regional stratigraphic two location are representatif age in Upper Miocene-Lower Pliocene there are CLN01 and CJR02B. Three location are represent atif age in Pliocene-Pleistocene there are MNT13, PsI, and BOJ03.
4. Fossil Identification
L
Taxonomical characters of Turritellidae have been de- veloped by several authors. Merriam (1941) [9] proposed three main parameters for identification: 1) the outer lip trace, 2) the ontogeny of primary spiral and 3) proto- conch. These parameters have been accepted by some authors such as Marwick (1957) [10] and Kotaka (1959) [11] with some detail improvements. Shuto (1969) [12] has accepted also, but he added other parameters with respect to biometry.
Wsut
Wang
In Turritellidae the morphological observation com- prises of the number of spiral ribs, sculpture, protoconch shape and teleconch. Biometric measurement including of the number of whorls, shell length (L), maximum width of the last whorl (Wang), wide sutures in the last
whorl (Wsut), and the apex angle () (Figure 2). Addition-
ally, in some taxa has been also measured the width of the whorl that changes the shape of the first whorl (Wn).
Fifty specimens have been taken from the study area as shown in Tables 2 to 6. The selection of five species was
based on their morphological resemblance of mono- carinate. These specimens are representing five species:
Turritella sp (MNT13), T. bantamensis (BOJ 3), T. sim- plex (CLN01A), T. djadjariensis (PsI), and T. javana
[image:2.595.336.500.298.562.2](CJR02).
Figure 2. Parameter measured in Turritellidae shell.
5. Analysis
Biometric data of Turritellidae have been analyzed with statistical method. The analysis is carried out on four parameters: 1) the ratio of shell length with whorl num- ber, 2) the ratio of Wang with Wsut, 3) the ratio of shell
length (L) with Wang, and 4) the ratio of shell length with
Wsut. Fixation these parameter is based on assumption
Table 1. Regional stratigraphy of mollusk sample sites in West Java (compilation from Martodjojo, 2003 [8], Oostingh, 1938 [2] and Martin 1919 [1]).
Mollusk Biostratigraphy West Java
Periode
Martin (1919) Oostingh (1938) Bandung Bogor Bayah
Upper
Quartenary Pleistocene
Lower Bantamian Bojong Fm.
Citalang Fm. Upper Sondian Sondian
Cipacar Fm
Bantam Kaliwangu Fm.
Pliocene
Lower
Cimanceuri Fm
Tjiodeng Cheribonian
Tjilanang
Cisubuh Fm. Upper
Parigi Fm. Rembangian
Nyalindung Fm.
Middle
Nyalindung
Preangerian
Saguling Fm.
Bojongmanik Fm.
Miocene
Lower West Progo Rembangian
Cibulakan Fm. Jampang Fm.
Rajamandal a Fm.
Cimapag Fm.
Upper
Middle Cikotok Fm.
Oligocene
Lower
Nanggulan Bayah Fm.
Jatibarang Fm.
Bayah Fm.
Eocene
Tertia
ry
Paleocene Ciletuh Fm.
ratio are proposed in this study.
Based on shell length, Kotaka (1959) [11] devided shell into two group, there are small shell if measurement less than 60 mm, and large shell if more than 60 mm. Result of the measurement from samples could be de- vided into two group, there are small shell represented samples code CLN-01A and CJR02B and large shell re- presented samples code MNT13, PsI and BOJ03.
5.1. Ratio of Shell Length (L): Whorl Number
This ratio is based on the results of measuring the shell length and the total whorl number. Aswan (1997) [5] proposed this parameter and proved that added of shell lenght is correlated with added of whorl number. In some species will show a different pattern on linear regression.
The measurement of specimens shows that MNT13 and CJR02B have a wide distribution, while the other sample have a narrow distribution. Approach with a clus- ter analysis it can be grouped in two clusters. Cluster A represents the shell in long less than 60 cm, included in this group are CLN01A and CJR02B (Figure 3). Cluster
B represents longer shells size are included in this group MNT13, Pasir Ipis and BOJ03.
5.2. Ratio of Shell Length (L): Wang
Table 2. The biometric measurements of Turritella sp. from Meningten area.
Code MNT 13
Species Turritella sp.
Location Waled Village, Cisanggarong river (Meningten Valley)
No. Spec L(mm) Wang Wsut Ww9 α (˚) Whorl Number Wang:L Wsut:L Wsut:Wang
1B 68.80 25.00 15.85 13.00 12.50 12 0.3633721 0.2303779 0.634
2B 73.30 28.80 16.60 14.30 11.00 12 0.3929059 0.2264666 0.5763889
3B 63.85 20.45 15.00 12.90 12.50 12 0.3202819 0.2349256 0.7334963
4B 71.90 29.40 16.50 13.35 15.00 12 0.4089013 0.2294854 0.5612245
5B 72.60 28.55 16.45 12.95 14.00 12 0.3932507 0.226584 0.5761821
6B 90.90 26.75 18.30 14.75 11.00 13 0.2942794 0.201320 0.6841121
1Y 95.70 28.30 22.50 14.00 15.00 13 0.2957158 0.235110 0.795053
2Y 85.30 32.50 19.10 15.50 13.00 13 0.3810082 0.2239156 0.5876923
3Y 97.20 30.30 20.10 16.10 13.50 12 0.3117284 0.2067901 0.6633663
4Y 64.70 22.60 15.40 10 0.3493045 0.2380216 0.6814159
5Y 89.00 27.40 18.30 12.50 12.50 14 0.3078652 0.205618 0.6678832
6Y 63.90 22.80 16.20 13.40 15.00 12 0.3568075 0.2535211 0.7105263
7Y 82.40 26.45 18.50 13.20 13.00 13 0.3209951 0.2245146 0.6994329
8Y 77.00 31.50 18.30 14.10 14.00 13 0.4090909 0.2376623 0.5809524
Table 3. The biometric measurements of Turritella bantamensis from Bojong area. Code BOJ3
Species Zaria bantamensis
Location Mekarjaya Village
No. Spec L(mm) Wang Wsut Ww7 α (˚) Whorl Number Wang:L Wsut:L Wsut:Wang
BOJ3-1B 94.60 20.50 16.00 7.75 10.00 13.00 0.216702 0.169133 0.780488
BOJ3-2B 95.00 22.30 16.95 7.00 13.00 13.00 0.234737 0.178421 0.760090
BOJ3-3B 105.00 23.40 18.00 11.90 13.00 13.50 0.222857 0.171429 0.769231
BOJ3-4B 105.80 24.95 18.25 11.35 10.00 13.50 0.235822 0.172495 0.731463
BOJ3-5B 111.20 24.00 17.70 9.40 10.00 14.00 0.215827 0.159173 0.737500
BOJ3-1Y 111.20 25.40 18.50 8.00 8.00 14.00 0.228417 0.166367 0.728346
BOj3-2Y 79.10 20.90 15.35 10.00 8.50 11.00 0.264223 0.194058 0.734450
BOJ3-3Y 114.00 26.50 18.90 10.00 9.00 12.50 0.232456 0.165789 0.713208
BOJ3-4Y 81.30 21.10 14.90 8.40 9.50 12.25 0.259533 0.183272 0.706161
BOJ3-5Y 80.80 21.80 15.10 8.90 11.00 12.00 0.269802 0.186881 0.692661
[image:4.595.56.541.479.731.2]Table 4. The biometric measurements of Turritella simplex taken from CLN01-A. Code CLN01-A
Species Turritella simplex
Location S. Cilanang, Gn, Halu, Bandung
No. Spec L(mm) Wang Wsut Ww5 α(˚) Whorl Number Wang:L Wsut:L Wsut:Wang
01A/1B 40.40 15.00 10.95 5.90 21.00 9 0.371287 0.271040 0.730000
01A/2B 41.80 16.30 11.80 7.00 21.00 9 0.389952 0.282297 0.723926
01A/3B 30.55 14.95 10.30 6.50 21.00 8 0.489362 0.337152 0.688963
01A/1Y 50.25 14.40 11.20 5.50 12 0.286567 0.222886 0.777778
01A/2Y 38.50 16.00 10.50 7.60 8 0.415584 0.272727 0.656250
01A/3Y 53.80 17.60 12.00 7.00 11 0.327138 0.223048 0.681818
01A/4Y 27.70 13.40 9.70 9.20 8 0.483755 0.350181 0.723881
01A/5Y 37.80 13.70 11.00 6.70 10 0.362434 0.291005 0.802920
[image:5.595.58.537.334.532.2]01A/6Y 37.40 15.75 11.30 7.10 10 0.421123 0.302139 0.717460
Table 5. The biometric measurements of Turritella djadjariensis taken from Pasir Ipis (PsI01). Code PsI01
Species Turritella djadjariensis
Location Pasir Ipis, Cirebon
No. Spec L(mm) Wang Wsut Ww8 α (˚) Whorl Number Wang:L Wsut:L Wsut:Wang
PI01/1Y 83.90 26.10 18.00 10.60 14 0.3110846 0.2145411 0.6896552
PI01/2Y 79.00 25.25 17.70 11.30 13 0.3196203 0.2240506 0.7009901
PI01/3Y 75.10 25.50 17.70 10.75 13 0.3395473 0.2356858 0.6941176
PI01/4Y 68.35 21.60 16.20 11.00 12 0.3160205 0.2370154 0.75
PI01/5Y 58.50 20.30 13.20 10.00 11 0.3470085 0.225641 0.6502463
PI01/6Y 64.80 21.00 15.10 10.00 12 0.3240741 0.233025 0.7190476
PI01/7Y 69.70 24.00 16.35 10.70 12 0.3443329 0.234577 0.68125
PI01/8Y 58.00 19.70 13.15 10.00 11 0.3396552 0.2267241 0.6675127
Table 6. The biometric measurements of Turritella javana taken from Cijarian (CJR02B). Code CJR02
Species Turritella javana
Location S. Cijarian, Pelabuhan Ratu
No. Spec L(mm) Wang Wsut α (˚) Whorl Number Wang:L Wsut:L Wsut:Wang
CJ02B-1B 59.60 15.75 11.40 11.00 11.00 0.264262 0.191275 0.723810
CJ02B-2B 56.85 12.60 9.20 12.00 12.00 0.221636 0.161829 0.730159
CJ02B-3B 40.75 11.90 8.75 11.50 10.00 0.292025 0.214724 0.735294
CJ02B-4B 39.65 10.75 7.55 12.50 10.00 0.271122 0.190416 0.702326
Cj02B-6B 52.30 12.30 8.85 11.00 12.00 0.235182 0.169216 0.719512
CJ02B-7B 56.60 14.60 10.55 11.50 9.00 0.257951 0.186396 0.722603
CJ02B-8B 44.80 12.50 8.60 10.00 10.00 0.279018 0.191964 0.688000
[image:5.595.59.540.558.735.2]suture at last whorl. If this occurs, different species should be show different patterns.
is based on the hypothesis that each additional the shell length will be followed by large changes in the last whorl. If this occurs, then each species may show a different pattern.
Specimens from MNT13 and PsI distributed on the same area, it’s possible because they are from the same formation. Based on size of shell it can be divide into two groups (Figure 5). Group A consists of CJR02B, and
CLN01A with short-sized shells. Group B consists of Pasir Ipis, BOJ03 and MNT13 with large shells.
The results showed that MNT13 samples have a wide distribution, and the other samples showed a narrow dis- tribution. Each species is forming an independent cluster, it is mean that each ratio of shell lenght with Wang is cor-
related with a particular species.
5.4. Ratio of Wang:Wsut
Approaching with the cluster model, the data indicates the variability represented in 2 groups. Group A consists of CJR02B and CLN01A (small shell), Group B consists of Pasir Ipis, MNT13 and BOJ03 (large shells) (Figure 4).
This ratio is a comparison between the maximum width of last whorl with maximum wide of suture at last whorl. The nature of uniformity in the Family Turritellidae is a turreted form. Turreted form should be occured if the ratio between the suture whorl with a maximum width of the whorl is relatively consistent. The comparisons be- tween one species and another will show a relatively equal ratio values.
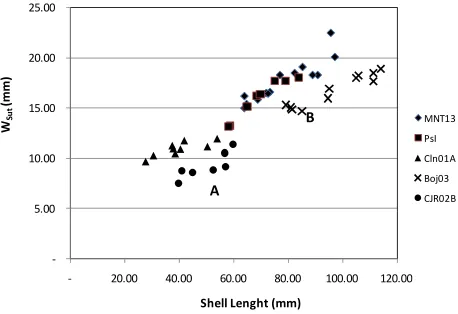
5.3. Ratio of Shell Length (L): Wsut
This ratio is based on the shell length with the maximum width of suture at last whorl. This parameter has never been used to determine a species. Based on the nature turreted it could be estimated that each additional length of the shell will be followed by additional wide of the
The samples from MNT13 show a widened spread, while other samples show the opposite. This shows that the nature of the turreted can be seen in the ratio of Wang:Wsut.
0 2 4 6 8 10 12 14 16
‐ 20.00 40.00 60.00 80.00 100.00 120.00
MNT13 PsI Cln01A Boj03 CJR02B Who rl Nu m b er
Shell Lenght (mm)
A
B
Approach taxa cluster analysis there are two large clusters. Cluster A consists of CJR02B and CLN01A, which is a cluster of small-sized taxa. Cluster B grouping BOJ03, PsI and MNT13, as large (Figure 6).
6. Discussion and Synthesis
Results of the parameters analysis show a consistent character in each population, so that each population can be synonyms as a distinct species. All parameters could be used to determinate a species.
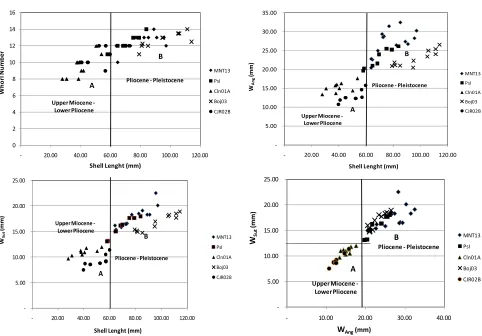
Overall cluster analysis of all chart shows two large clusters of consistent groups (Figure 7). Based on geo-
logical especially at chronological studies (Table 1), two
[image:6.595.58.287.356.509.2]groups of clusters turned out to represent several things:
Figure 3. Distribution of ratio of shell length with whorl number, tend to be distributed.
‐ 5.00 10.00 15.00 20.00 25.00
‐ 20.00 40.00 60.00 80.00 100.00 120.00
‐ 5.00 10.00 15.00 20.00 25.00 30.00 35.00
‐ 20.00 40.00 60.00 80.00 100.00 120.00
MNT13 PsI
Cln01A
Boj03
CJR02B
Shell Lenght (mm) WAn
g
(mm)
A B
[image:6.595.308.537.541.698.2]Shell Lenght (mm) WSu t (m m) A B MNT13 PsI Cln01A Boj03 CJR02B
Figure 5. Distribution of ratio of shell length to width suture of the last whorl (Wsut) Distribution points clustered into
wo groups: A and B. Figure 4. Distribution of the ratio of shell length with a
[image:6.595.57.287.547.707.2]‐ 5.00 10.00 15.00 20.00 25.00
‐ 10.00 20.00 30.00
MNT13 PsI Cln01A Boj03 CJR02B 40.00 WSu t (mm)
WAng (mm) A
[image:7.595.182.414.82.242.2]B
Figure 6. Distribution of ratio of the ratio of Wang with Wsut distribution points clustered into two groups: A and B.
0 2 4 6 8 10 12 14 16
‐ 20.00 40.00 60.00 80.00 100.00 120.00
MNT13 PsI Cln01A Boj03 CJR02B Whorl Num b e r
Shell Lenght (mm) A
B
Pliocene ‐Pleistocene
Upper Miocene ‐ Lower Pliocene
‐ 5.00 10.00 15.00 20.00 25.00 30.00 35.00
‐ 20.00 40.00 60.00 80.00 100.00 120.00
MNT13
PsI
Cln01A
Boj03
CJR02B
Shell Lenght (mm) WAn g (mm ) A B
Pliocene ‐Pleistocene
Upper Miocene ‐
Lower Pliocene
‐ 5.00 10.00 15.00 20.00 25.00
‐ 20.00 40.00 60.00 80.00 100.00 120.00
MNT13
PsI
Cln01A
Boj03
CJR02B
Shell Lenght (mm)
W Su t (mm) A B
Pliocene ‐Pleistocene Upper Miocene ‐
Lower Pliocene
‐ 5.00 10.00 15.00 20.00 25.00
‐ 10.00 20.00 30.00 40.00
MNT13 PsI Cln01A Boj03 CJR02B WSu t (mm)
WAng (mm)
A
B
Upper Miocene ‐
Lower Pliocene
Pliocene ‐Pleistocene
Figure 7. Distribution of each ratio associated with chronological. A is representative sample from upper Miocene to Pliocene, B is representative from Pliocene to Pleistocene.
1) Based on the aspects of stratigraphy, cluster A is representative group of Upper Miocene-Lower Pliocene. Cluster B is represents a group of Plio-Pleistocene.
2) Aspects of evolution shows that the trend toward the increas of body size at a younger age. It seens that the small size of cluster A realted to Upper Miocene-Lower Pliocene specemines. Whereas large-sized cluster B to younger specimens (Pliocene-Pleistocene).
7. Conclusions
This study shows biometrical aspects are reflection of geological condition. It has been seen that small size of individual appeared on Upper Miocene-Lower Pliocene, whereas large-sized ones appear in younger level Plio- cene-Pleistocene in age.
[image:7.595.58.540.263.599.2]be used to identify rocks from Pliocene to Pleistocene. While the small shells can be identify to older age of rocks. This research needs to be developed further, which is valid only in Java alone or also in other areas.
8. Acknowledgements
Special thanks for Dr. Tomoki Kase and Dr. Yukito Ku- rihara (National Museum of Nature and Science, Tokyo) whose helped sample collected during field works. Great thanks for Ministry of Education which give fund pass- ing on doctoral research funding.
REFERENCES
[1] K. Martin, “Unsere Paleozoologische Kenntnis von Java, Mit Einleitende Bemerkungen Űber die Geologi der In- sel,” E. J. Brill, Leiden, 1919.
[2] C. H. Oostingh, “Mollusken als Gidsfossielen voor Het Neogeen in Nederlandsch-Indie,” Handelingen van het Achste Nederlandsch-Indisch Natuurwetenschap-Pelijk Congres Gehouden te, Soerabaja van, 20-23 July 1938, pp. 508-516.
[3] H. M. Jenkins, “On Some Tertiary Mollusca fron Mount Sela, in the Island of Java. With a Description of a New Coral from the Same Locality, and a Note on the Scindian Fossil Corals. By P. Martin Duncan,” Quarterly Journal of the Geological Society, Vol. 20, No. 77, 1863, pp. 45-74.
[4] M. Pozzobon, “Le Malacofaune Cenozoiche di Nang- gulan e di Panggang Presso Yogyakarta (Giava, Indonesia) Inquadrate Nelle Fauna Della Tetide,” Tesi di Laurea,
Dipartimento di Geologia, Paleontologia e Geofisica, Universita Degli Studi di Padova, 1997.
[5] Aswan, “Penggunaan Metode Biometri Dalam Menen- tukan Evolusi Fosil Moluska Turritella Dari Beberapa Tempat di P. Jawa & Penerapannya Dalam Biostrati- grafi,” MS Thesis, Graduate Program, ITB, Bandung, 1997.
[6] T. Shuto, “Notes on Indonesian Tertiary and Quarternary Gastropods Mainly described by the Late professor K. Martin, I. Turritellidae and Mathildidae,” Geology and Paleontology of Southeast Asia, Vol. XIV, 1974, pp. 135- 160.
[7] T. Kase, F. Kitao, Y. M. Aguilar, Y. Kurihara and H. Pandita, “Recontruction of Color Markings in Vicarya, a Miocene Potamidid Gastropod (Mollusca) from SE Asia and Japan,” Paleontological Research, Vol. 12, No. 4, 2008, pp. 345-353. doi:10.2517/prpsj.12.345
[8] S. Martodjojo, “Evolusi Cekungan Bogor,” Institut of Technology, Bandung, 2003.
[9] C. W. Merriam, “Fossils Turritellas from the Pacific Coast Region of N. America,” University California Pub- lished Bulletin, Dept. of Science, Vol. 26, No. 1, 1941, pp. 1-214.
[10] J. Marwick, “Generic Revision of the Turritellidae,” Pro- ceedings of the Malacological Society of London, Vol. 32, No. 4, 1957, pp. 144-166.
[11] T. Kotaka, “The Cenozoic Turritellidae of Japan,” Sci- ence Reports of Tohoku University Series 2, Vol. 31, No. 2, 1959, pp. 1-135.
[12] T. Shuto, “Neogene Gastropods from Panay, the Philip- pines,” Memoar Faculty of Science, Kyushu University,
![Table 1. Regional stratigraphy of mollusk sample sites in West Java (compilation from Martodjojo, 2003 [8], Oostingh, 1938 [2] and Martin 1919 [1])](https://thumb-us.123doks.com/thumbv2/123dok_us/7781410.721640/3.595.57.540.111.540/table-regional-stratigraphy-mollusk-compilation-martodjojo-oostingh-martin.webp)