TECHNICAL SERIES
Number 1Database Access Using TROLL on the CCS Computer by
John Costigan, ESRI
Alan MeQuaid, Dept. of Fiaaace
John FitzGerald, ESRI Adrian Redmond, CSO
June 1986
The Economic and Social Research Institute
I
I
I
I
I
I
I
I
I
I
I
I
I
I
I
I
I
I
I
I
I
June 1986
Database Access UsingTROLL on the CCS Computer
by
John Costigan, ESRI
John FitzGerald, ESRI
Alan McQuaid, Dept. of Finance
Adrian Redmond, CSO .
Economic and Social Research Institute
I
I
I
I~I
I
I
I
I
I
I
I
I
I
I
I
I
I
I
l
I
Section
Appendix
!
2
3
4
5
6
7
8
9
I0
11 12"
13 14
CONTENTs¯
Title
Introduction
Description of Databases available
How to Access Troll version 12 on the CCS computer
The Department of Finance Databank
Online Information on the CSO Databank
OECD Economic Outlook
OECD F~in Economic Indicators
OECD Cyclical Indicators and Business Surveys
OECD Indicators of Industrial Activity
OECD°Annual Labour Force
OECD Quarterly Labour Force OECD Capital Stock Data
OECD Annual National Accounts
OECD Trade Data (Series A)
Transferring Troll data to other Programmes Database manager’s guide to OECD tapes
Using Troll task Database with OECD Osiris tapes
Page
15
23
3O
39
47
51
55
62
66
69
81
84
87
ACKNOWLEDGEmeNTS
The authors are solely responsible for the contents of this manual.
Every effort has been made to ensure that its contents are correct at the
time of going to press. However, some errors may still remain. Users
should notify the authors of any problems which they encounter in using it.
The authors would like to thank Paul O’Dwyer and Dave Hurley of the Department
I
I
I
I
I
I
I
I
I
I
I
I
I
I
I
I
I. INTRODUCTION
A wide range of economic databases are currently available to
TROLL users on. the CCS computer in Dublin. However, the means of access have,
in the’past, been badly documented and, in some cases, have been difficult to
implement. The purpose of this paper is to describe the databases which are
currently available and how to access them*. The TROLL programme itself has
been amended to facilitate users. The means of accessing the CSO Data Bank has
been substantially altered to improve efficiency, to allow greater flexibility
to users, to reduce the level of maintenance required by those responsible for
that database, and to transfer an individual comment describing each series
loaded into TROLL.
Section 2 of this paper describes, in general terms, the databases
available. Section 3 gives details of how to access the current version of
TROLL on the CCS computer in both interactive and batch mode. The Appendices
give details for each database of its contents and how best to access the
relevant data.
I
I
I
This paper replaces the following papers
"TROLL experimental programs - Database CDPS", Department of Finance 1981 "Using TROLL version 12 on the CCS computer", ESRI mimeo, 1985
I
I
I
I
I
l
I
i
I
I
I
I
I
I
I
I
I
I
I
I
2
2. Description of Databases Available
The databases available fall into three separate categories:
(i) Data "for Ireland maintained in the TROLL file SYSLIB by the Department of Finance
(ii) Data for Ireland in the SAS database of the CSO
(iii) Data available from the OECD. Some of these data are made available in the TROLL file SYSLIB by the Department of Finance and the remainder are available on tape at CCS
(i) The Department of Finance database for Ireland grew out of the requirements
of macro-economic modellers. The range of data available reflects this interest.
Tney are almost all annual time series and are primarily derived from the National
Accounts for Ireland. The complete contents of the National Income and
Expenditure volume Tables A.I to A.21 and Table A.25 are available. These data
have in all cases been carried back to at least 1960, and in many cases to 1958
or 1953. Where discontinuities exist they have been ironed out to produce
consistent series by linking relevant sets of data. The databank also includes
all the data for Ireland contained in the EEC national accounts and the investment
series for Ireland published in the OECD and UN national accounts.
In addition to the national accounts data £here are a range of series
covering certain categories of public expenditure and tax revenue. These
latter series include a wide range of time series on rates of direct and indirect
taxation. Other series include a limited range of labour force and monetary
data. The monetary data are particularly weak due to problems obtaining
consistent series for long periods. The 1975 input-output table for Ireland is
also available in the database.
The National Accounts data are all available consistent with both
I
I
I
I
I
I
I
I
I
I
I
I
I
I
I
I
I
I
I
I
3
series are at present only available consistent with NIE 1982. The NIE ’83
version should be available la~er in 1956." Further details of this database are
¯ given in Appendix ~. .’
(ii) The CSO Data Bank for Ireland at present contains approximately 5,000 time
series. They are updated regularly by the CSO. In addition to the time series
files the database contains a range of cross section files. However, it is not
yet possible to transfer these cross section files to TROLL using standard
procedures. The time series files may be accessed by TROLL users as described
in Section 3. (Details of how to obtain online SAS documentation on this database
together with more details on its contents are given in Appendix 2). Set out
below is a summary of the range of time series files available in the CSO
Data Bank.
Data Bank Contents
Currently, the Data Bank contains about 50 data files, which in turn contain about 5,000 time series and 3,500 cross-sectional variables.
The areas that are at least partially covered at the moment are:
- Census of Population - Labour Force Survey - Labour Costs Survey
- Household Budget Survey - Unemployment
- Quarterly Industrial Employment, Earnings and Hours Worked
- Monthly Industrial Production and Turnover
- Census of Industrial Production
- Quarterly Consumer Prices - Monthly Agricultural Prices
- Monthly Retail Sales
- Building and Construction
- Monthly Trade, Transport and Tourism
- National Accounts - Balance of Payments
- Quarterly Births, ~rriages and Deaths
- Life Expectancy Tables
I
l
I
I
I
l
I
I
I
I
I
I
I
I1
I
I
I
I
I
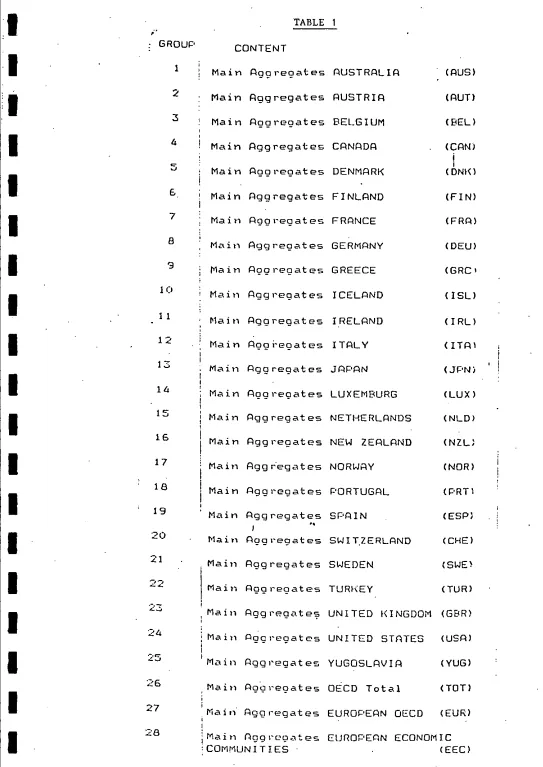
(iii) The OECD database: The vast bulk of the data published by OECD in
book form are also available on magnetic tape. These tapes also contain
much additional material which’ is notavailable in book form. The Department
of Finance receives most of these tapes. In the case of the more frequently
used publications their complete contents have been ll~unted permanently in the
TROLL file SYSLIB. In total they amount to over 4,000 series. They are
updated regularly by OECD. Generally the data are available in SYSLIB from
the official publication date of each new publication. As the vast range of
data available on the computer can be intimidating to first time users, they
should first consult the relevant OECD publications to familiarise themselves
with what is available. The range of data available are described below in two
sections depending on whether they are available in the TROLL file SYSLIB or
whether they have to be loaded into TROLL from tape. The data cover all members
of OECD and groupings of members such as the EEC.
(a) Available in SYSLIB:
OECD Economic Outlook: Most of the data in this publication,
together with historical series and forecasts up to next year for a wide range
of data used, but not published in the Economic Outlook, are available in
SYSLIB in the archive OECDOUT. These data include major national accounts
aggregates, e.g., employment data, major trade aggregates and limited information
on exchange rates and interest rates. More details are given in Appendix 3.
OECD Main Economic Indicators: The contents of this publication together with
some additional data. They are archived under OECDMIN in SYSLIB. They are
updated monthly and many series run from 1960 to 1986. The data are predominantly
monthly in periodicity with quarterly and annual averages or totals, as appropriate.
I
I
I
I
I
I
I
I
I
I
I
I
I
I
I
I
I
I
I
I
OECD Business Survey and Cyclical Indicators: These data cover the OECD’s
system of leading indicators for individual countries and the results from
business surveys carried out among heads of enterprises in member countries.
They are generally not available in hardcopy or book form and are monthly in
periodicity. They are archived under the name OECDMIN in SYSLIB. More details
are given in Appendix 5.
OECD Indicators of Industrial Activity: The contents of the publication of
the same name are available in the archive OECDQIN in the TROLL file SYSLIB.
These data cover indices of industrial output, output prices and orders broken
down by industrial sector. Depending on availability these series are either
monthly or quarterly with quarterly and annual averages or totals as appropriate.
They are updated quarterly. Further details are given in Appendix 6.
OECD Annual Labour Force: The contents of the-OECD annual labour force publication
are archived under OECDALF on the TROLL file SYSLIB. These data are annual
series for all OECD member states covering population, labour force unemployment
and employment by sector. They are updated annually. Further details are
given in Appendix 7.
OECD Quarterly Labour Force: The contents of this publication have a somewhat
more limited coverage than the annual publication. The series are quarterly and
are only available for 13 OECD countries, not including Ireland. They are
updated quarterly. They are archived under OECDQLF in the TROLL file SYSLIB
and further details are given in Appendix 8.
OECD Capital Stock Series: A limited range of capital stock data on an annual
basis broken down by sector are available for 12 countries, not including Ireland.
(Some of these data are also available on the National Accounts tape). These
data are archived under oEcDKSTK in the TROLL file SYSLIB. Further details
I
l
l
I
I
i
I
I
I
l
I
I
l
l
I
I
I
I
I
I
6
(b) Available on Tape¯
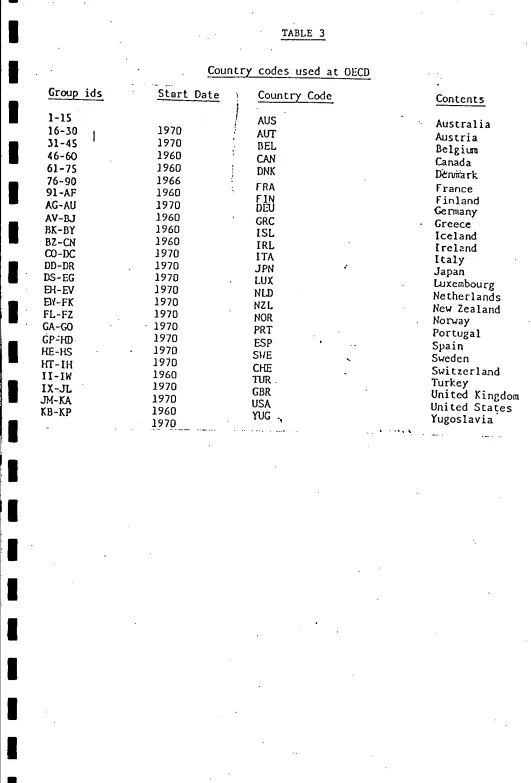
OECD Annual National Accounts: The contents of the two volumes of this publication
are available on separate tapes in CCS. The number of series is very large, over
50,000, so that permanent storage on disk would be very expensive. The main
aggregates data, on the tape corresponding to Volume I of the publication, cover
the main national accounts series (GNP etc.) on an annual basis for all countries
from 1960 to 1983. The tape containing the detailed data of¯Volume II covers
annual series for the years 1970-1983 for all countries and for 1960-1983 for
Certain Countries. In loading these data it is recommended that the tables and
countries required be first identified in the published document and these tables
can then be loaded as described in Appendix 10.
OECD Monthly Trade Series: The data in the OECD A series trade publications are
available on tape to TROLL users. These tapes contain up to 40,000 monthly
series. Due to the quantity of data a number of tapes are necessary to contain
them all. Due to the quantity of data and number of tapes users may find that
accessing this file is more difficult than is the case for other OECD files.
The tapes generally contain information on trade cross classified by trading
partners at the aggregate level and for certain SITC groups. They also contain
certain information for some countries on prices and volumes. (A much more
detailed set of tapes covering the OECD C series trade publications is available
direct from OECD, at a price.) Further details of how to access these data are
I
I
l
I
l
I
I
l
I
I
i
l
I
I
I
I
I
3. How to Access TROLL version |Z on the CCS Computer
There are two ways of using TROLL: interactively under TS0, or in
BATCll mode using the SPF file editor to prepare the BATCH input. For accessing
the various databases there are some restrictions on the manner of accessing
TROLL. For the databases available on the TROLL SYSLIB file, described in
Section 2, either mode of access may be used. To access the CSO database users
are at present restricted to the interactive version. The BATCH version must
be used to access those OECD databases which are stored on tape*.
The procedure for obtaining normal interactive access to TROLL without
access to the CS0 Data Bank (but including access to the databases on SYSLIB)
is described below in subsection A. The additional commands needed to access
the CSO Data Bank are given in subsection B. Subsection C describes the method
to be used for submitting BATCH jobs, i.e., where a prepared sequence of TROLL
commands is submitted to the computer in a batch, preceded by JCL (Job Control
Language) commands which instruct the machine on how to proceed.
The interactive mode has the advantage of obtaining an immediate response
by the computer to each command, which is either a prompt to type in your next
command, or an error message. Errors can be corrected immediately in interactive
mode, whereas in batch mode, an error will usually terminate the job.
Batch mode is generally used for large jobs ~ich could be expected to
tie up a terminal for very lengthy periods in interactive mode, or where the task
is repetitive in nature or where a hardcopy of the input is required. An example
is a job to document each of the series in a databank with a description, source,
etc. It is assumed that each user has his or her own library. In the examples
I
I
i
I
I
I
I
I
I
I
I
I
I
I
I
I
I
I
I
I
sho~cn the user is assumed to have the name TA64ZTR.
Department of Finance users have names beginning RO6~
Department of Transport users have names beginning PC6A
Department of the Environment users have names beginning CA05
ESRI users have names beginning TA64
A. Interactive Access
To enter TROLL first log into TSO. e.g.,
LOGON TA64ZTR/SPLOD
where TA64ZTR is your ID and SPLOD is the password.
When the machine returns with three asterisks press enter.
When the machine returns with the message READY then type TRL12 followed
on the same line,obY any (or some) of the options specified below. Each
successive option should be separated from the previous option by at least
one blank space.
e,g.,
T,~64ZTR I_I]GON IiN I~ I~O..,I,L~,~ AT NO IROADCA.~ T MI:.,’~.,A{.,E..,
Ri.~)’~l)y
-"[1{1_t ’2 LJ~F;~I::(RO6,D.O)
i’.:~:4Eg:E~4 ON MAY.:.,’~ 1986
The options available are divided into two groups - options used in normal
TROLL operation, and options used to access the CSOData Bank discussed in
subsection B. If it is desired, options can be spread over a number of lines
I
i
i
I
I
I
I
l
I
I
I
I
I
I
I
I
I
I
I
I
(i) the ability to access files other than the user’s own file and the
system files to Which the user has automatic access. (These latter
are TROLLSYS, SYSLIB and USERLIB).
USR2(TA6~.A) These options allow the user to specify the USR3(TA64.M) additional files that they require access to.
The name in brackets should be the first two segments of the name by which the computer knows the file. These two segments correspond USR7(R060.R) respectively to the first four and fifth
characters of the LOGON ID.
Up to a maximum of six additional users can be accessed in this way.
(ii) If the TROLL user wants to work in a TROLL library other than that
associated with the user’s logon ID permission must be given under
ACF (the CCS security package). Provided permission has been granted
this option is invoked by coding.
UgRNAM(TA64.A) where the user wants to work in the library of
user TA64ATR
(iii) If the TROLL user wants to vary the destination of offline output
this can be done using the OUT option. The default is that offline
output (using TROLL commands beginning with "0") generated in a
TROLL session is routed to the W queue when the user terminates the
TROLL session in a normal manner. (This option also applies to output
destined for device 7 such as offline graphics output).
OUT(A) In this case the output is routed to the A queue.
(iv) The user has the option of running TROLL with all the input to TROLL
being taken from a member of a partitioned data set (PDS). (This
amounts to the same thing as running TROLL in batch mode except
that the job begins execution immediately and the terminal is locked
till the job completes). The name of the partitioned data set and
I
I
I
I
I
I
I
I
I
I
I
I
I
I
I
l
l
I
I
DSNA~(TA64.PDS.A(SPLOD)) where the PDS is TA64.PDS.A and its member, SPLOD, contains the input for a batch TROLL job
(v) In the case where the user elects to exercise option (iv) and to take
the input for TROLL from a stored member of a PDS it may be useful to
route all TROLL output to a destination other than the screen. This
allows the user to store all output to look at it at leisure and, if
so desired, route the output to the printer. This option is invoked
by coding:
OUTNA~(W) where the "W" specifies the W queue as the destination for all TROLL online output.
(vi) A further option which may be useful when the PLOT package is used is
the ability to route all output destined’for device seven to a permanent
disk file. For example, if certain graphics devices are to be used,
the output for them from the PLOT package will be directed by TROLL to
device 7. A further programme will read this data as input and route
the output to the chosen plotter. Another possible use is where the
DATABASE option is used to transfer TROLL data to an outside programme
or file in a FORTRAN readable format as described in Appendix 12. In
this case it is necessary to specify the temporary storage file directly.
This is done by the following command;
DISK(TA64.PDS.A(GRAPHICS)) where the output is to be stored in the member called GRAPHICS of the partitioned data set TA64.PDS.A. The file referred to in th~s option must already exist and must have previously been catalogued. Care
should be taken if using the working PDS if the output from TROLL is
likely to be large.
B. Accessing the CSOData Bank interactively
In addition to the options specified above, if the user wishes to access
I
I
l
I
I
l
I
I
l
I
I
I
I
I
I
I
l
I
I
I
11
If the user does not Specify these options when entering TROLL with the TRL12
command, access to the csOData Bank can only be obtained by logging out and
starting again. An innovation compared to the earlier interface between TROLL
and the CSOData Bank is that in the current version co~ents are transferred to
TROLL on all the individual series.
The options entered at the time of first entering TROLL must specify, as
set out below, the series to be copied from the CSO Data Bank into TROLL. When
these options are entered the TSO cormmand list first calls the SAS programme and
the names of the required series are passed automatically to it. A number of
screens of information on SAS will then appear while SAS automatically copies
the required data to a temporary disk file. The cormnand list then automatically
calls TROLL. Up to this point the user has only had to specify the names of
the required series when calling the command list (TRL12). At this point the
user finds himself or herself in TROLL in the normal way. After entering the
normal system option (SYSINSO or BATCH) at the start of the execution of the
TROLL programme the user should immediately call a TROLL macro which" reads the
CSO data from the temporary file into TROLL, storing each series in TROLL under
the same name used in the CSO Data Bank. The macro is executed by typing
&CSODB
The macro prompts the user for the (optional) name of an archive in which the
CSO data are to be stored. It also asks the user whether, in the event of
series already existing with the same names as those to be loaded, the pre-existing
series are to be overwritten. When the macro completes execution the user is then
in a normal TROLL environment into which the CSO data have been loaded and execution
continues in the normal manner. If more series are to be loaded the user must log
out of TROLL and commence this procedure again. It is strongly recommended that
the user load the CSO series using ~he relevant TROLL macro before carrying out
any other TROLL task as that macro deletes all existing SEARCH arguments which
I
I
I
I
I
I
I
l
I
I
I
I
I
I
I
l
l
l
I
I
12
If the CSOData. Bank is to be accessed parameter (i) below must be
specified. The other parameters are optional.
(i) GROUPI(!LRAM’) The GROUPI parameter can contain either the name
of a databank file* (all series will be output), or
a range of codes. The names should be given in
single quotes.
e.g. GROUPI(’LRAM’)
or GROUP~(’RSAM001 RSAM004-RSAM012’)
(ii) GROUP2( )
up to
GROUP4( )
(iii) START(’1981 4’)
Optionally the user may specify up to four groups
of files to be transferred to TROLL. However, all
the files must have the same periodicity, i.e., the
fourth character of their name must be identical ’M’
for monthly, ’Q’ for quarterly data, etc.
This option allows the user to specify the start date
for all the series to be transferred. If a start
year is specified then a start period must also be
specified, otherwise it defaults to the series start
date. The year may be in 4 or 2 digit form, e.g.,
(1984)(84). If this option is taken then the values
must be enclosed in apostrophes, e.g., (’1983 2’). If
the start date is not specified the data are transferred
for the full period for which they are available in the
CSO Databank.
(iv) END(’1985 12’) This option allows the user to specify the end date
for all the series to be transferred. Coding
instructions are the same as for START. if END is not
coded values for the series requested are transferred
up to the latest date available in the CS0 databank.
13
Note on using START and END dates:
It is up to the use~ to make sure that the START
date specified is on or after the series start date.
If it is not it defaults to the series start date.
Likewise with the end date it must come on or before
the series end date. The start and end periods of
monthly time series range from I to 12, for annual
and longer than annual the period is I, for quarterly
it is I to 4 and for half yearly the periods are I and 2.
Any other periods are invalid and if specified will cause
the date to default to the series date.
Examples:
TRL12 GROUPI(’LRAM’) GROUP2(’RSAM001-RSAM003’)
This transfers all the series in the file LRAM and the series RSAM001, RSAM002
I
!
I
and RSAM003 to TROLL.
TRL12 GROUPI(’BCAQ’) START(’]979 I’) END(’1980 3’)
This transfers all the series in the file BCAQ for the period 1979 quarter
one to the third quarter of 1980.
Example of execution of macro to load the data into TROLL:
I
TROLL COMMAND:’ >&CSODB
DO YOU WANT TO ARCHIVE THE CSU DATA? ’YEs’ OR ’NO’
>YES
I
WHA1 ARCHIVE t.IIAME DO YOU WAZJT : >CSOO0 YOU WA~,IY "fn OVERWRITE F~,<!STING SFRIES? ’YE~’ O~
I
>YES ’NOt :SAS-TPOLL INTFRFaCE: COPyp[’.=HT ECONnMIC AND SOCIAL ,~ESEAR(;,’4 INSTITUTE AP# 19£~ JUHN D FITZ ,aERALD
JOHN COSTIGA,J
LOA~ED: LRAHAnI
i
TROLLI
I
I
I
I
i
I
I
I
I
I
I
I
III
I
I
I
I
I
B Running TROLL in Batch Mode
The following example of the JCL required is given for the user with
LOGON ID TA64ZTR. It assumes that the user only wants to access his or her
own TROLL library, together with those system libraries normally accessed
(TROLLSYS, SYSLIB and USERLIB).
//TA64Z:T’I~’,tI,’..!~JOB (TA64, O(-)(~’l ) , ’ J F:’I’T’ZGIT.]:~.gLD / "x-..l () BI::’ A I:t:i’4 ,S;:::;A 7~0;?; /ILl’ ’1 1:.’3’<IEC’~- :T’ROI...L.t ’2
//LID;’EI7 DD DD’ixI=TA64 , Z., "T’R[-II_L, D I,~71::’::::0 LD
II~’Y.S’tN DD .×.
’ I.,L.A.S..>=.SI
The name of each TROLL user’s own library must be coded on the USER DD card.
This name is formed from the logon ID by taking the first four characters of
the ID, .followed by a full stop and the fifth character, followed by a full
stop and then the name TROLL. Additional users~ libraries can be accessed
by adding the following DD card(s) before the SYSIN DD ¢ard.
//FT14F001DD DSN=RO60.R.TROLL,DISP=SHR
//FTI5FO01DD etc.
up to //FTI9F001.
The default output for this procedure is queue W. This can be changed
to the A queue by replacing the EXEC card with the following
//EXEC TROLL12,CL=A
I
I
I
I
I
I
I
I
I
I
I
l
I
I
I
II
I
I
I
I
15
APPENDIX I: The Department of Finance Databank
I. Introduction
The Department of Finance databank contains a wide range of series for
Ireland, most of them of annual periodicity. All the data are stored in the
TROLL, file SYSLIB. In principle this database is updated once a year
subsequent to the publication of the National Income and Expenditure. The data
in it can be broken down into four separate groups. Section 2 of this Appendix
describes the first group, the annual national accounts database. Section 3
describer the second group, the data prepared for use in macro-economic modelling.
Section 3 describes briefly the third group of miscellaneous data and Section 4
describes the Input-Output data.
2. National Accounts Data
The complete contents of National Income and Expenditure tables AI to A21
and table A25 and the EEC National Accounts for Ireland are available in SYSLIB.
The data from tables AI to A21 from National Income and Expenditure 1983 (NIE83)
are archived under IRL .Z in SYSLIB. The same data from NIE82 are archived under
IRL .Y and the data from table A25 of NIE82 are archived under IRL BAL. These
data ail cover, at a minimum, the period 1960 to 1982. In many cases they begin
in 1953 or 1958. The EEC National Accounts data for Ireland cover the period
1970-82 and are consistent with the NIE82. They are archived under IRL Y. The
Irish National Accounts data are derived from many issues of NIE using the latest
editions with data for a particular year. The data have been adjusted to provide
continuous series for the entire period. In particular:
(a)
(b)
(c)
all constant price data have been brought to 1980 prices by linking (1975 prices in IRL__Yj1950 prices in IRL Z);
the government data prior to 1974, which were published in NIE on a financial year basis, have been brought to a calendar year basis by linear interpolation;
I
I
I
I
I
I
l
I
I
I
I
I
I
I
I
I
I
I
16
The names of these adjusted series all begin with the letter B followed by
four digits. ~e first two digits determine the table number in NIE and
the secondpair of digits determines the position of the series within the
table reading from the top. (It should be noted that these numbers are
different from the number published in NIE). For example, B0402 is the second
series from the top in Table 4, i.e., industrial output at constant 1980 prices.
Full comments are not yet available on the series from NIE83 in archive IRL Z
but they are available for the series in IRL Y derived from NIE82. The
disaggregated tables for consumption (11 and 12) in NIE83 were altered from
previous years. Data on the new basis are only available from 1975. However,
data in the old format are also available in the archive IRL g with names
beginning CONB11 and CONB12.
Th’e balance of payments data in archive IRL BAL which are derived from
table A.25¯of NIE82 have eight character mnemonics. Each series has a descriptive
con=nent stored with it.
three commands:
ACCESS SYSLIB;
SEARCH SYSLIB;
These colmments can be printed by giving the following
PRTDATA SEARCH SYSLIB CO~NT IRL BAL >;
The EEC National Accounts data all have names beginning with the letter C.
The next two digits distinguish the table in the EEC National Accounts from
which they are taken and the following two to four characters distinguish the
series within the tables. Comments are stored on these series. Further details
of the NIE data, together with a listing of the contents of archive IRL Z,
are available in Hurley and McQuaid, "Department of Finance Data Bank of
Economic Time Series, Part I: National Accounts Data (adjusted)", Department
I
I
I
I
I
I
I
I
I
I
I
I
I
II
I
I
I
I
I
I
17
3. Model Data
These data are stored in the archive IRL_Y. They are consistent
with the data in NIE82. Many of the series are derived from the National
Accounts. They are annual series and, at a minimum, cover the period 1960-1982
In addition to the national accounts data taken from NIE, national accounts data
from a range of other sources is included. Additional data on investment by
sector from the UN and OECD National Accounts for Ireland are included with
names beginning with the letter I. Disaggregated trade data have been adjusted
to make them consistent with the National Accounts. The monetary data are not
very satisfactory due to definitional changes by the Central Bank. The employment
series are based on the work of J. Sexton (1982). Where possible they tie in
with the series in Trends in Employment and Unemployment. The Government sector
data are drawn from a number of sources as is made clear in the notes on individual
series. A high proportion of the series shown here have been derived from
transformations of other series given in this databank. The transformations
used are shown in the notes on each series. Detailed notes on the generation
of the databank using the TROLL computer package are given in FitzGerald and
McQuaid "Generating the Databank", Department of Finance Research Paper, 3/83.
Additfonal information on the series available is given in FitzGerald, Keegan,
McQuaid and Murphy, "Department of Finance Databank of Economic Time Series",
Department of Finance Research Paper 2/83.
In forming the mnemonics used for the series in this section the set of
rules given below has been used. The mnemonics are constructed round a number
of prefixes and suffixes. The letters, A, I, S are frequently used in forming
mnemonics to represent the agricultural, industrial and services sectors
respectively. These may be preceded or succeeded by other letters showing
which part of the relevant sector is covered by the series, e.g., IM for
I
I
I
I
I
I
I
I
I
I
I
I
l
I
I|
I
I
I
I
I
Prefixes
AAE ...
BM ...
BP ...
C lie,,,.°,o
CCV ...
CC ...
E t,,o°°.,.~
EEC ...
FD ...
G 6e.,.°,°°,
GC ...
GCG ~ ...
GCS . . . ~ ...
GCT ...,
GK ...
CKI ...
GKL ...
GKT ...
GR ...
GRB ...
GRL ...
GRT ...
GT ...
GTE ...
GTEX ...
GTY ...
INg ...
IOB ...
Average:annual earnings
Monetary data not classified elsewhere
Balance of payments data not classified elsewhere
Consumption data
VAT Base
Cost of capital data
Employment
EEC data
Final demand weighted in different ways
Government sector data
Government current expenditure
Government current expenditure - goods and services
Government current expenditure -subsidies
Government current expenditure - transfers
Government capital expenditure
Government capital investment
Government capital - loans to other sectors
Government capital transfers
Government capital revenue
Government capital - borrowing
Government capital revenue - loan repayments received
Government capital revenue - transfers
Government current revenue
Government current revenue r taxes on expenditure
Government-current revenue - taxes on expenditure - excise
Government current revenue - taxes on income
Investment
Investment non-building
I
I
I
I
I
I
I
I
I
I
I
i
I
I
I
I
I
I
I
I
IRB K M P PC PCNT PG PH PI PM POP PQ PST PW PX Q QPR R ST W WC X Y ,,o*o,otoo ,°°°°,Io,, ,°.°°o,~,, °,°°,el°o. o°,°,..°°° ,,°°,e,*o, .,°.°°,o,o °,o,,oe,°° °°°°°°°°°° °°,°°°°°°° ,°°°°°°°.° °o°°°.,°~° ..,.°°.°.. °°..o°°°°~ °,°*°°I°°° ~,Ji°°°°°° ,°,o,.°.°° ¯ .°°,i 0°° ¯ o,.°°°°°°I *o°°o°°°°.Investment residential building
Capital stock
Imports
Price Indices etc.
Price indices - consumption
Price indices - consumption net of special taxes
Price indices - government current expenditure
Exchange rate indices
Price indices - investment
Price indices - imports
Population variables
Price index - output
Price index - stocks
Price index - world prices
Price index - exports
Output
Index of output per person
Tax rate indices, tax bands, tax rates, rates of benefit,
interest rates
Stocks
Weights used in other equations, wages
Index of wage costs per unit of output
Exports
Income, GNP etc.
Suffixes
B: Base year
DL: Change in a variable
DOT and DT: Percentage change in a variable
VA and V: Value (as opposed to volume)
I
I
I
!.
I
!
I
I
I
I
I
I
!
I
!
!
I
I
I
I
OT|IER SYMBOLS
AG: Agriculture
I: Industry
OS: Non-public administration services
PA: Public Administration
PR: Private Sector
20
4. Other Data
A range of other miscellaneous data are stored in the archives IRI,GOV.
These data are consistent with NIE82.
A range of monetary data
The data included in this archive cover:
A range of data on consumption of different products liable to excise tax
A range of indices of excise tax rates, on different commodities (prefix REX)
¯ A range of series giving the rates of unemployment benefit and assistance
for different family categories (prefixes RUA and RUB)
A range of series giving numbers in receipt of unemployment benefit and
assistance broken down by family circumstances (prefixes UA and UB)
Comments are stored on all these series.
commands:
ACCESS
SEARCH
SYSLIB;
SYSLIB;
PRTDATA SEARCH SYSLIB COMMENT IRL GOV >;
They can be printed by giving the
5. Input-Output Data
These data relate to the 1975 input-output table for Ireland. They are
archived under the name IO in the TROLL file SYSLIB. Their derivation is
explained in Murphy, "Analysis of the 1975 Input-Output Tables", Department of
Finance Research Paper, 1984. Details of the matrices are given in the attached
ESA format tablesl
(i) Interindustry flows (40 X 40):
: 0 ESA_A
! 0_EAS_AD
! O ESA_~
-’,~ ESA_~TTA 0 ESA_NTAD I0 ESA ~ITAM
Total (Producers’ Prices)
Domestic Origin (Producers’ Prices) Imported (Producers’ Prices) Total Net Taxes on Products
Net Taxes on Products of Domestic Origin Net Taxes on Imports
[ii) Final uses (40 x 5):
Total (Producers’ Prices)
Domestic Origin (Producers’ Prices) Imported (Producers’ Prices) Total Net Taxes on Products
Net T~xes on Products of Domestic Origin Net Taxes on Imports
IO ESA_F Pp Total Final Uses at Purchasers’ Prices (as supplied)
(iii] "Primary" Inputs (Ii x 40):
I0 ESA_P Primary Inputs (including transfers)
TraditiOnal format tablesl--Standard Tables
~0 A Interindustry flows matrix (40 X 40)
~0 F Final demand matrix (40 x 6)
TO ’?A Primary Inputs into Domestic Industry (8 x 40)
~O_PF Primary Inputs Direct into Final D~mand (8 x 6)
(ii) Merchandise Imports Tables: -~0 A MM
TO F MM
(iii)
Merchandise Imports into Domestic Industry (40 ¯ 40) Merchandise Imports Direct into Final Demand (40 x 6)
Final Deman,ds (6 cate?ories):
Col. I Personal Consumer Expenditure Col. 2 Services Exports
ZOl. ~ Merchandise Exports
Col. 4 Public Authority Net Current Expenditure ZDI. 5 Chan~es in Stocks
Col. ’6 Gross Fixed Capital Formation
% :iv) Primary Inputs (8 catecories)t
Row i Merchandise Imports ROW 2 Services Xmports
Row 3 Indirect Taxes
~ow 4 Subsidies (negative) ,.
ROW 5 Wapes and Salaries Row 6 Profits
~c~ 7 Depreciation Row 8 Transfers.
~ot____£,
20 F and lO PP havo been adjusted and are not the sa~e as supplied by CSO or as pub|.ish~d. In IO F chanpes in the bresding stock have been transferred from gross fixed capital formation to changes in
m m m mm m n mm n m m m
I
m m m m m m m m m
())
(1)
10 A_ADJ
.!0B
(ii)
10 F D
I 0 F_DM ARG X 14/
r 03_D_A DJ
(ill)
[0PA_D
Derived Tables
Etcz-Inter-lndustry Flows (40 x 40).
Adjusted A matrix (i.e. intsrindustry flow matrix adjusted for the elimination of transfers from the primary input matrix),
10_A ADJ - I0 A + I0 A_TR~
Transfsrs Matrix;
Adjusted A matrix in coefficient form,
¯ IOA.C m MATMULT (/O__A__ADJ, SETREP (IDEN (40), SEO(b.0).
~0,~o) , q(ROWSUM (10_A_ADJ) + Rowsu~ (lO_Z))));
(I-A)-l matrix using adjusted A matrix,
lO_~ - I[IV (IDEU (40) - IO_A.C);
Final Demands (40 x 20):
Disaggregated final demands (before distribution of margins;
Margins Matrixj
Adjusted disaggregated final demand matrix (i.e. after distribution of margins).
10_F_D ADJ - I0 F_D ÷ IO F_D_ MARGIN:
Primary Inputs into Domestic Industry (13 x 40)I
Disaggregated pri’mary inputs into domestic industry (with transfers eliminated);
10_P^.co
(ill)
10_PF_D
10_PF_DD
(iv)
[O_D.FD
I0 pAF D
rO P D
, [0P. 00
Disaggregatsd primary inputs in coefficient form, IO PA.C D " MATMULT "(IO_PA_D, SETREP (IDEN (407, SEO (1,40). SEQ (1,40), i / (ROWSUM(IO A ADJ) + ROWSVM
(lO_P))))/
Prima~ Inputs Direct into Final Demand:
Disaggregated primary inputs into final d~mand (13 x 6)~
Disaggregated primacy inputs into disaggregated final demaod (13 x 20);
Calculations:
Gross Outputs implied by dlsaggregated (domestic) final demands (40 x 20),
¯ IO B.F D ~ MATMULT (IO B, IO_F_DLADJ)2
Disaggregated Primary ~nputs implied by disaggregated (dc4nestic) final demands (13 X 20),
lO PAF_D m MATMULT (IS PA.C D, IO_8.P_D);"
Total Primary Inputs implied by total final demands, (13 x 20)
rO_P_D - ~0 PAF D + ~O_PF Dp:
Total Primary Inputs as proportion Of total final demands
I
I
I
I
I
I
I
I
I
I
I
I
I
I
I
I
I
I
I
I
I
23
APPENDIX 2: CSO DATA BANK
The Central Statistics Office Data Bank System
Introduction
The CSO Data Bank, on which the CSO started work in 1984, is a fully integrated system held on a shared IBM mainframe computer at the CCS installation in Kilmainham. Statutory constraints on confidentiality imply that it can only contain published or publishable macro-data. Currently, the Data Bank can be accessed, in batch or interactive mode, by organisations that have direct links to CCS. Users can access any of the data in the data bank; they can display the data, print or plot them, manipulate or analyse them, transfer them to TROLL or other
personal files, or download them to micros.
SAS
The Central Statistics Office chose the SAS system to manage their Data Bank. SAS is a large general-purpose system that is used in thousands of installations around the world.
.i
SAS can be used for: file and data management and manipulation;
information storage and retrieval; data entry, validation and editing; statistical analysis; report and letter writing; plotting; etc. It consists of a high-level programming language and a library containing a large number of ready-to-use procedures, from basic data management procedures to advanced statist¯ical ones.
Although the language and facilities are powerful and extensive, the basics can be learnt fairly quickly. The documentation is excellent, both printed and on-line.
The SAS products currently installed in CCS are
- SAS: The Base Product
- SAS/FSP: The Full-Screen Product, used for data entry, display
and interrogation
- SAS/ETS: for Econometric and Time Series analysis
- SAS/AF: for designing and implementing customised interactive
menu-driven systems
I
I
I
I
I
I
I
I
I
I
I
I
I
I
I
I
I
I
I
24
Structure of the Data Bank
The Data Bank consists of a single SAS library, which in turn contains a number of SAS files.
SAS Files are simple rectangular structures. The rows are called observations and the columns are called variables. Variables can be numeric or character, and information such as formats and labels are automatically linked to each variable. There are no practical
restrictions on the size of SAS files, - they can be as big or as small as one need~. Since SAS automatically maintains a lot of information on each file-,~ the files are to a large extent self-defining.
Currently, the Data Bank contains about 50 SAS files. Each file contains either a group of time series or a unified table of
cross-sectional data. In the case of time series files, the series come from a single source and have the same periodicity. For
cross-sectional files, the data all come from a single inquiry or census and relate to a single period of time. Data Bank files contain anything from a dozen to several hundred variables or time series.
Certain conventions were followed in naming files and variables. In the case of time series, file names are 4 characters long, and the 4th. ¯ character indicates the periodicity. For example, the file LRAM
contains about 90 of the main monthly Live Register series. Each variable, name consists of the file-name plus a serial number. For
example, LRAM001 is the code of the series measuring Total Unemployment.
In addition to the data files, there is a special file called INDEX, which contains structured information on each time series Qr variable in the Data Bank. This information includes series code, full title, start and end date, units used, date and time last updated, etc. It is easy for users to display, browse and search through INDEX. For example, users can get answers to questions such as:
- What is the duration of the Retail Sales Index series?
- When were the Live Register series last updated?
- What are the codes of the series whose titles contain the word
’Births’?
Users can also easily get a hardcopy of part or all of the INDEX.
Command Language
The user is not required to know SAS, unless one wants to do some
fairly complicated or specialised" extraction, manipulation or analysis.
!
I
!
II
!
!
I
!
I
!
I.
I
I
I
I
I
I
I
I
I
25
the CSO. ~en a macro is call’ed, it generates and executes the required SAS code.
There are macros for px’inting series or cross-sectidnal data, for printing information from the INDEX file, for plotting and charting, for changing the periodicity of series, for subsetting and merging, for calculating percentage changes, for seasonal adjustment, etc.
Many macros can be specified with optional parameters to control the way they work: these parameters could specify the list of series, the start or end dates, whether titles should be printed, and other factors that can control the operation involved.
Since the Data Bank contains a SAS library whose elements are files, many macros can easily work on complete files or on groups of variables rather than on a single variable. For example, the COMPRESS macro,
which is used to reduce the periodicity of series, can be used in a single statement to change, say, a file of several hundred monthly series to a file of quarterly or annual averages.
The macros can be used equally well on Data Bank variables or on user-created data, such as data derived from Data Bank variables.
The more advanced user, who might not want to be confined to the special commands that were created, has the full range of the SAS programming language and procedures at his or her disposal.
"Documentation
The third major component of the Data Bank system, apart from the data files and the command language, is the documentation.
All of this documentation is held in machine-readable form as an integral part of the system. The complete set of documentation is called the HELP Catalogue; the reason for this is that the
documentation is broken into a number of modules or members, and any one member can be displayed on the screen or printed using the HELP command.
There are now over i00 such members. There are general members which give an introduction to the system, describe how it’s organised, how to access and use it, etc. In addition, there is a separate member for each time series or cross-sectional file and for each Data Bank command or macro.
I
I
I
I
I
I
I
I
I
I
I
I
I
I
I
I
I
I
I
I
26
displayed when a user scrolls through any Bank file is organised under these 12 ¯ The information that is
member relating to a Data headings:
Introduction File Description¯
Revisions (Are the data final?)
- Updating (This applies to time series only)
- Technical Notes
Re-basing (this applies to series of Index Numbers only) - Discontinuities, etc. (If any)
Seasonal Adjustment (If applicable for this file) Related Data Bank Files
References (i.e. to published articles)
- Contact (Person to contact if queries arise)
- Source
Data Bank Contents
Currently, the Data Bank contains about 50 data files, which in turn contain about 5,000 time series and 3,500 cross-sectional variables.
The areas that are at least partially covered at the moment are:
- Census of Population
- Labour Force Survey
- Labour Costs Survey
- Household Budget Survey
- Unemployment
- Quarterly Industrial Employment, Earnings
- Monthly Industrial Production and Turnover
- Census of Industrial Production
- Quarterly Consumer Prices
- Monthly Agricultural Prices
- Monthly Retail Sales
- Building and Construction
- Monthly Trade, Transport and Tourism
- National Accounts
- Balance of Pa3~ents
- Quarterly Births, Marriages and Deaths
- Life Expectancy Tables.
and Hours Worked
I
I
I
I
I
I
I
I
l
I
l
I
I
I
I
I
I
I
I
I
27
Accessing the Data Bank
One can access the CSO Data Bank directly, either in batch or interactive mode.
For interactive access, from READY give the command qa62sas db
When the ’Welcome’ message appears, read the information that displayed and follow the instructions. At this stage, one has tO all of the data in the Data Bank, to all of the CSO macros, all of the documentation. One also has access to all of SAS.
is access
and to
To access the documentation, type HELP on any command-line and hit the ENTER key.
TO exit from SAS and the Data Bank, type BYE on any command-line and hit the ENTER key.
For batch access, use these JCL statements (in addition to a standard job-card):
// EXEC QA62SAS,CL=A,COPIES=I //SYSIN DD *
(Your statements go here)
//
To get & hardcopy listing of the main INDEX details for each time series in the Data Bank, use this statement in a QA62SAS batch job (don’t forget the semicolon):
prlabel ts;
The HELP Catalogue (i.e. the Data Bank documentation) is d~signed for on-line use, but to print it in its entirety, use this JCL statement in any batch job:
// EXEC QA62HELP,CL=A,TYPE=ALL
The member TSFILES in the HELP Catalogue is given on the following pages. It gives a very brief description of each time series file currently in the Data Bank.
The CSO Data Bank can be accessed indirectly via the SAS/TROLL
I
I
I
I
I
I
I
I
I
I
I
I
I
I
I
I
I
I
I
28
(TSFILES) CSO Data Bank
Files of Time Series
Introduction:
A complete list of the Time Series Files currently in the Data Bank is given below. The list is in alphabetical order by filename. Time series codes consist of filenames plus a 3-digit serial number
(except for the file NAAA where a 4-digit number is used). In addition to the time series variables, each file contains a
variable called DATE. For further information on the structure and organisation of Data Bank files, and on related conventions, enter
’HELP DBFILES;’
For a list of Cross-sectional Files, enter ’HELP CSFILES;’ For details of a particular file, enter ’HELP filename;’
Time Series Files:
AIAA:
APAM :
600 annual series from the Census of Industrial Production. All series start in 1973. q~ere are series for each of 6 variables and for i00 NACE categories.
54 monthly Agricultural Price Index series, to base 1980=100. There are 25 Output and 29 Input series. All series start in January 1980.
ApBM: 83 monthly Agricultural Price series. These are all~ absolute
price series, not index series. Most series start in January 1976.
BCAQ:
BCBM:
25 quarterly Building and Construction series. The series relate to Planning Permissions, and to Earnings and Hours Worked in the Industry. Some series start in QI,1969, but others have later start dates.
5 monthly Building and Construction series, - Index of Employment, Cement Sales and 3. Dwellings Completed series. Start dates vary from January 1971 to January 1979.
BPAQ: 43 quarterly Balance of International Payments series, relating
to the Current Transactions Account and the Capital Account. All series start in QI, 1981.
CNAL: 320 Census of Population series, covering all Censuses from
1841. Population and other variables are given bySex, County, etc.
CNBL: 500 Census of Population Series, starting in 1926. Population
and other variables are given by Sex, Marital Status and Age Group.
CPAQ: 97 quarterly Consumer Price series. 72 are Index series to the
!
I
!
I
i
I
!
I
I
I
I.
!
I
I
I
’i
t:
LRAM :
LRBM:
LRCQ :
LRDH:
MIAM:
MIAQ:
MIAA:
MIBM;
NAAA:
QIAQ:
QIBQ:
RSAM :
TRAM:
TRBM:
TSAM:
VSAQ:
29
94 monthly Live Register series, including all series from the Monthly Live Register Statement. The main series start in
January 1967.
423 monthly Live Register series. 372 of these are the Industrial Analysis series, given by sex for each of 124
industries, starting in January 1973; the remaining 51 are the Short-Time series, starting in January 1980.
312 quarterly series from the Age Analysis of the Live Register. All series start in QI,1980.
384 half-yearly series from the Age-by-Duration Analysis of the Live Register. All series start in HI,1980.
106 monthly index series from the Monthly Industrial Inquiry. Series are given, both unadjusted and seasonally adjusted, for each NACE category. Most series start in July 1975.
106 derived quarterly index series from the Monthly Industrial Inquiry. Most series start in Q3,1975.
56 derived annual index series from the Monthly Industrial Inquiry. Most series start in 1976.
47 monthly index series from the Monthly Industrial Turnover Inquiry. The series are classified by NACE and all begin in January 1980.
414 annual National Income and Expenditure series. Most series start in 1970.
45 quarterly employment series from the Quarterly Industrial Inquiry. The series are classified by NACE. The earliest series start in QI,1973.
387 quarterly earnings and hours worked series from the Quarterly Industrial Inquiry. The series are classified by NACE. The earliest series start in QI,1973.
70 monthly Retail Sales Index series. Series are given for description of business, both unadjusted and seasonally adjusted. All series start in January 1968.
each
33 monthly Motor Registration series. The earliest series start in January 1961.
65 miscellaneous monthly Tourism and Transport series, relating to passenger movement, etc. All series start in January 1961.
225 monthly Trade series: Imports, Exports and Import Excess for each of the 75 Sections and Divisions. Most series start in January 1972.
56 quarterly Vitai Statistics’series, including the main series from the quarterly CSO publication. The main series start in QI, 1960.
I
I
I
I
I
I
I
I
I
I
l
I
l
I
I
I
I
I
I
I
I
30
APPENDIx 3: OECD Economic Outlook Database
I. Introduction
This database is stored in SYSLIB. Section 2 describes the contents
of the database. Section 3 gives an example of how to access the data.
Section 4 describes how the database manager should load the data from tape.
1.2 Description of contents of database
The Economic Outlook 38 tape contains data, both historical and
forecast, corresponding to the December 1985 issue of OECD’s Economic Outlook.
Series are presented in level form beginning as early as 1970 (depending on the
series), and extend through a forecast horizon ending in the first half of 1987
¯ for semi-annual series and 1986 for annual series. They are available for
individual OECD member countries (semi-annual forecasts are available fo~ Canada,
France, Germany, Italy, the United Kingdom and the united States), groupings of
OECD countries and regional groupings of non-OECD countries’~ It should be
noted, however, that not every series will necessarily be available for every
country or grouping. The data are updated at the time of the publication of
the Economic Outlook - June and December.
Annual and semi-annual series are expressed in terms of volumes or
values in local currency, number of people, indices, etc. The precise measure
is found in the series documentation. All data, with the exception of those
expressed as percentages or indices, are provided in natural units. Indices
are based on I rather than ~00 and vary as to base year depending on national
conventions. OECD aggregate series are weighted together using 1982 gross
national product and exchange rates, and the base year for these indices is
1982. Additional information is available in:the OECD mimeo"Economic Outlook,
I
I
I
I
I
I
I
I
I
I
I
I
I
I
I
I
I
I
I
I
Documentation
Each time series is documented. The documentation provides the
exact title, the source (if drawn from OECD databases), other sources (e.g.,
official national statistics), the original frequency, frequency conversion
(e.g., average or additive), units, whether or not seasonally adjusted, the
series derivation (if derived from other basic statistics) and other relevant
information.
Set out below is a list of the countries and regional groupings
covered by the database together with the mnemonics used in the database:
AUS
AUT
BEL
BLX
CAN
Fib/
FRA
DEU
6ttC
1SL
IRE
I TA
oPi~
LUX
NIA?
NZL
NOR
PRT
ESP
SWE
CHE
GBR
USA
Australia
Austria
Belgium
Belgium-Luxembourg
Canada
Denmark
Finland
France
6ermany
Greece
Iceland
Ireland
Italy
Japan
Luxembourg
[~therlands
New Zealand
Norway
Portugal
Spain
Sweden
Switzerland
Turkey
United Kingdem
United States
I
I
I
I
I
I
I
I
OECD regionat groupings_
O Fr_.D
T-US
BIt;7
LITL
B0R
. EUR4
EUR1
EEC
All Ohcb countries
OECD countries minus the United States
Seven major OICD countries (USA, JPg, DE"O, ~, GBR, I’fA, G~N)
Smaller OECD countries
OISCD European countries
Four major European countries (DEU, FRA, GBR, ITA)
Smaller OECb European countries
European coat, non market countries
b?on-O]’CB regional groupine~.ss
OPt
}DP
OOP.
h:IC
DII
OPCbl
hODC
bDLN
hOP
h’LD
SOV
OPEC {LOP + 14OP)
"Low absorbing" OPEC countries(l}
"High absorbing" OPEC countries(2)
Other oil producers(3)
Ke~,’l)’-indust rim1 ising countries(4)
Lo~..,- and middle-income countries(S)
OPEC plus ~n
Oa~a n
Non-oil developing countries[6)
Non-OECD, non-OPEC countries
Non-OPEC(7 ]
I’gorld
Soviet group
2.
3.
,
6.
7.
Bahrein, ku~,ait, Libya, ~nan, Qatar, Saudi Arabia, United Arab F~,qirates
Algeria, ~uador, Gabon, indonesia, 1ran, Iraq, Nigeria, Ve1:e.:ue!a
Brunei, Cameroon, Congo, Egy.’pt, ~talaysia, ,’.~exico, Peru, Syria, Trinidad
and Tobago, Tunisia
Argentina, Bra:il, Hong Kong, lsrael, Philippines, Singapore, South
Africa, South Korea, .Taiwan, "lhai]and, Yugoslavia
All otl,er dv:v~.IcTing countries
OOP + £iC + DII
I
I
I
I
I
l
I
I
i
I
I
I
I
I
I
I
I
I
I
I
1BY 1EN’IG 1G IGG I6¥ 1HV 1 NDPRO 1 N’FDBT I NVBD 1PV IRL I RS 1Sk’V 11¥ KTRRG LF bliP, MFV bIGBD .MGSV b~VC M;,IV blONEYS blRV NLG OFfD O1LODN0 1LIo D.I
O1LDIS
Ol L%,\T
0 1 LPRO
OILSTO OILSOP OILXNr O~,Po PCP PCP82 PDTY 33
I/WES%tL\’F BY TIlE BUSIN-’ESS S}~TOP,, VOLU.’.IE
1N\i’£h. I:NI OF COVERN.1E?¢I EKFtTRPRISES
GOVI~IU¢.IENI" 1 ~\,’ LS’Ii’,IEKr
GROSS GOVkRN’4E.",T IN\-ES’I}.IEN’F A.~ OTt~_R btlSCELtAi\T.OUS
CRPl T:M. "fiU.aKSACI IONS
C-OV~k’,ll~.~’r 1NVF.STMENI’, VOLUME ]N\lg’g131"-EN’f IN IDUSING, VOLUME
INDUSTRIAL PRODUCTION
1N’I’H{EST ON CONSUblER D}~’l" BAb’~XCE ON ]N¥]SIBLES, $
PRIVATE FIXED ]NYES’IMENT’, EXCL. STOCKBUILD1NG, VOLUME
]KIT_REST RATE, LONG-TERM
IKfEREST RATE, S~-DRT-TEP4,1
STOCKBUIIZ.)ING, PRIVATE, VOLUbff.
"IDTAL FIXED ]NYEST.LEXCL S’IOCKBUILI)ING) VOL~IE
NET O"d~ITAL TRANSI:EI~ RECEIVED BY (./J",,’EIZI~,IENT
D’W’O UR PONCE
IHt-’ORTS OF Fa\g~.GY, VOLUblE
I..’,ff"ORTS OF I-DOD, VOL~,II"
IblPORTS OF GOODS, GDP BASIS, $
1Mt~P.’IS OF C/)O[.JS AND SERVICI£, N.A.BASIS, VOL[BIE
IMPORTS OF CLK)DS, CUSTO.XkS BASIS, VOLUblE
IbiPORTS OF b!..%\UFAUIMRES, VOLU?,IE
HO,",E Y STOCK
IblI"ORTS OF I~,W blATERIALS, VOLUblE
Z
NEq’ LENDING, G3VHL’q.IENT
OFI-IC1AL ~TRANSFERS, $
OIL CONSUYtPTION, blBD
OIL DD.L~O, MBD
DISCI<EP,:\NCY BE’II’,~EEN DEx~.&~,’D ANI) SUPPLY OF OIL, MBD
NET IMPORTS OF OIL, :~BD
OIL PRODUCTION, HBD
S’IOCKS OF Oil., ,’,~D
SUPPLY OF OIL, ,’,~D
NET EXPORTS OF OIL, MBD
OTHER OFFICIAL F1K-L\CING, $
I)EFL-\TOR FOR CONSLI?.r"IER E\PENDITLRE
C,~ ~’d’, _~ 1982
t.r:.t ^,Ft,;~ ~O~. ,.o, ~1 ~ a~ I::yD :KI) ’l’llp~
I
I
I
I
I
I
I
I
I
l
I
I
I
I
il
I
I
I
I
I
¯ . 34
The following is a list of the series and related mnemonics. Only a subset of these series are available for any one country or group of countries.
Codes Description BANTdJ BOSD CAPDCL CAPDD I CAPDOF CAPD(YO CAPDXC CBII CBUDPR CFKG CG . CGh~’, CGV C£3~ CD~\ CPV .0~, U..’,~qJ CRUI~O CRUSCR CRUSTO C~uxP EE EG KS ET EXCH EXC21E. EXOIUD FBGSV FDDV GDP GDPV , GDP82D GDFV82D
IOTAL BANKING FIDWS, $
BALANCE OF OFFICIAL SETTLINI~\’fS $
CAPITAL, O3NCESSIONAL IJ3ANS, $
CAPITAL, DIRECT IN’VES% -VEN’I’, $
CAPITAL, OTHER FLOt’IS, NET
CkPITAL, OII~H~, OFFICIAL FLOVS, $
CAPITAL, EXPORT O>,EOI’fS, $
CUP, RLNT BAL,’vNCES, $
CUIkRENT BAL.~NCI£ AS A PERCEN-D, GE OF GDP (%)
GOVEILX\IEa\T CONSUMFY1ON OF FIXED CAPITAL
GOVDL~,IENT CONS~I!?TION .
COVEIL\’,I "EkT CONSU>ii~’IION EXCLUI)ING WAGES
GOVD~’,51L\’I’ CDNSU,HPTION, VOLUME GOVEIgN.\IENT C/-JNSU~.-PP’I’ION) WAGES
PR1VATE CONSU?.fi)T!ON, HOUSEIIOI.D ACCOUN’I" B.:~IS PRIVATE CONSUS~zFION, VOLLbIE
CRUDE OIL IMPORT PRICE (CIF) $/BBL
CRUDE OIL PRObUCI’ION, blBD
CRUDE OIL STOCK/CONSLb.~TION P~\1"IO (DAYS) CRUDE OIL STOCK LE’~q~L, b~D
EXPORT PRICE OF CRUDE OIL (F.O.B.) $/BBL
"IOTAL DEPEKDENf EMPLOYEES
GENHL-’LL GOVHL’,t-E\’I" EXDLDYI, LENT S ELF- E~qPLOYEIJ
TOTAL laxfl’ LO~N L\T
EXCI%L\’G E RATE
EFFECflVE EXCNANGE RATE (INDEX)
EXCII)LKGE PATE, UNI1"S PER DOLLAR
FOREIGN BAL~u\CE, N,A. BASIS VOLUMF
FIKkL I.~.HESTIC DExD_:XI), "vOLUME
~,OSS NATIu,WLL/IX3:~ES’rlC PRODUCT
(~.OSS Na.T!ONai/IXT-!FEST!C FRODUCT, ~,~LLb!E CROSS iT.);.tESTiC PRODUCT, i982 $
I
I
I
I
I
I
I
I
I
I1
I
I
I
I
I
I
I
I
I
PGDP PGDP82WA~
HqF W~ H,IOS R&I B,fll PR IARD PRIBD PR] FBD PRIFD PR I~YOD PRITD PD)D PXE PXF PXG , PXG5[ PX~
RESERD RESTG RLC SAVG .SPTD SRATIO SSPG SSRG STDSCV TBD TDDV TDDV8ZD TIM.) TRPG TRPH 1RRGDLFIJ~]’OR FOR GDP AT iVARKET PRICES ’
DEFLATOR ILL)R GROSS IYOMESTIC F’RODUCT, 1982
lblPORT UNIT. VAI.UE, EKERGY (IN~)EX)
lblPORT ~IT VALUE, FOOD (lt~!tX)
I?,fl~)l(’l’ UN]T VALUE, GOODS (INDEX)
I~h°ORT PRICE, C_£ODS AND SERVICES (INDEX)
IHPOP, T ut, rr VALUE; LOCDkL CURP, EhCY, .bIANJFACTURES (1N])EX)
lb~ORT UNIT VALUE, RAng HA’I’ER]ALS (It.,DGX)
bI~KE1" i)RIC-l~ OF AGRICUL’I1JI~I. P,2,3f bIATERIALS, $ (INDEX) MAP, KEr PRICES OF TROPICAL BEV]XAGES, $ (INDF.X)
bD, RKET PRICES OF FOOD (Iba)EX)
bl;~,KEF PRICES OF FOOD, $ (INDEX)
bPdO(E’]’ PRICES OF M],VERAI.,S, ORES AND blETALS, $ (INDEX) blARKET PRICES OF SELECr PRIMARY C~,t�