Abstract: This paper investigates the layout design and optimization for an assembly line system in an industrial case
based on the Discrete Event Simulation (DES) technique. The
purpose of the simulation system was to build up different
layouts of the prepared manufacture system and, especially, to
propose a solution designed to decrease the need for workforce
and to settle bottlenecks problem in the system. In this study,
based on the analysis of the manufacturing process of the
typical manufacturing part and the available facilities in the
assembly system, three layout designs are proposed based on
Straight-line, U-shape and Parallel U-shape patterns
respectively. A DES simulation environment by using the
software of Witness is the established in line with the
machinery data provide by the company as well as the
experiential data identified from the literature. The three
layout designs are then tested in the simulation environment,
whose simulation performances are compared and analyzed in
terms of the line balance and production efficiency. The results
show that the Parallel U-shape line gives rise to the best
solution.
Key words: Discrete Event Simulation; Witness modeling; computer simulation; U-shaped layout
Manuscript received March 19th, 2019; revised March 29th, 2019. This work was supported by UK-China Advanced Aerospace Structure Manufacturing Technology Laboratory.
Yang Li, UK-China Advanced Aerospace Structure Manufacturing Technology Laboratory, University of Exeter, Exeter EX4 4QF, England, United Kingdom. (Phone: +44 07419819071; e-mail: [email protected]).
Naihui He, UK-China Advanced Aerospace Structure Manufacturing Technology Laboratory, University of Exeter, Exeter EX4 4QF, England, United Kingdom. (Phone: +44 1392724540; e-mail: [email protected]).
David Z.Zhang UK-China Advanced Aerospace Structure Manufacturing Technology Laboratory, University of Exeter, Exeter EX4 4QF, England, United Kingdom. (Phone: +44 1392723641; e-mail: D. [email protected]).
1. INTRODUCTION
Effective factory layout planning is imperative to the cost
and time efficiency of manufacturers in a globally
competitive environment [1], particularly when
manufacturers are required to be agile in order to keep up
with varying customer demand and product mix [2].
Well-designed facilities result in efficient materials
handling, reduced resource transportation times and
decreased production cycle times [3]. In addition, effective
layout design of arranging facilities can reduce average
manufacturing costs and improve operational performance
of manufacturing systems [4].
As an effective technique to improve the performance of
manufacturing systems, simulation-based optimization has
received great attentions from both academic scholars and
industrial practitioners. In fact, for this particular category of
systems, discrete event models are usually adopted to
reproduce their dynamics.[5] Computer simulation of the
material flow in a production system is commonly employed
before launching a new production line or to enable a
predictive production control.[6] Also, The simulation
provided a visual aid that helped to assure that all of the
required processes were taken into account. The model
provided a graphical representation of the flow of material,
indicated WIP levels, and identified blockages. These are
features that are easily identifiable through the use of
simulation. Therefore, there were very few surprises when
the line was installed and operational. [7]
The aim of this paper is to outline the possibilities
afforded by the Witness simulation environment for
theconstruction of models and the subsequent simulation
ofconcrete manufacturing systems. In our workplace
forinstance, we have used this environment to verify
thefunctionality of suggested designs for the production
lines ofthe company; or in the course of designing
solutionsdesigned to increase productivity and the discovery
Simulation Based Layout Design and
Optimization for Assembly Line System
ofbottlenecks in the production line.
2. LITERATURES’ REVIEW
A. computer simulation of DES in the manufacturing
system
Discrete Event Simulation (DES) is an effective tool to
analyze complex manufacturing operations with product and
process variability. In addition, DES has advantages for
performing analysis to any future scenarios for improved
process time and efficiency.[8]
Automotive, electronics and other general production
industries have identified simulation modeling as a method
to analyze and improve their manufacturing facilities.DES
in particular has been widely applied to model and optimize
complex manufacturing systems and assembly lines. DES is
particularly well suited for modeling manufacturing
systems, as DEScan explicitly model the variation within
manufacturing systems using probability distributions.[9]At
the same time, the reconfiguration of manufacturing and
repair facilities can be a disruptive, expensive and time
consuming process. This leads to the requirements for
virtually modeling the system to assist managers in
understanding the effects of proposed changes on their
manufacturing systems [10]. Manufacturing facilities are
often too complex to be modeled mathematically; this gives
rise to the need for Discrete Event Simulation (DES)
methods. DES can be used to assist managers in modeling
and simulating the performance of their manufacturing
systems [11].DES ha sbeen used for many applications in
manufacturing environment. Sharda and Akiya [12] used
DES to select postponement and make-to-stock policies for
different products in a chemical plant. An approach which
combines simulation and mathematical modeling for setting
order due date in a produce-to-order manufacturing
environment was presented in Tunalietal [13]. Mehrai et al.
[14] modeled the logistics for production and then optimized
parameters for autonomous objects. Wischnewski and
Freund [15] presented a solution for modeling transportation
systems within a production environment. Alrabghi &
Tiwari[16] provided an up-to-date review of simulation
optimization for maintenance systems.
B. The U-shaped layout of manufacturing assembly line
Flexibility is one of the most crucial criteria of modern
manufacturing systems to satisfy customized demands in a
cost-effective manner. As mentioned by Miltenburg [17],
U-shaped lines (or U-lines shortly) do not only provide the
flexibility and efficiency of a proper line design but also
increase functionality of workers on the line. Fig.1 provides
a schematic depiction of a U-shaped line configuration.
Ibrahim Kucukkoc [18] proposed a hybrid line
configuration, namely parallel U-shaped assembly line
system which is illustrated in Fig.2, with the view
tomaximizing resource utilization and decreasing the need
for workforce. Two U-shaped lines are located in parallel to
each other to establish an assembly environment where
operators are multi-skilled and located between two adjacent
lines, being able to handle tasks on both of the lines.
Fig.1 Typical illustration of a U-shaped line configuration
Fig.2 Schematic representation of the proposed parallelU-shaped assembly line system
There are authors who cover the use of simulation for
designing U-shaped assembly lines. Wang et al. [19] used a
combination of mathematical modeling and simulation in
order to analyzea linear walking worker assembly line, i.e. a
one-piece flow system. Tiacci[20] described a JAVA-based
simulation for model-mix assembly lines including
stochastic operation times, parallel stations, a fixed
scheduling sequence and buffers between work stations. His
straight-line and U-shaped systems. Martinez and Bedia [21]
presented a modular program based on the WITNESS
simulation procedure, which is used to model a U-shaped
assembly system. Baykoç[22] used an adapted heuristic
method, which had originally been developed by Arcus[23]
under the name of COMSOAL (Computer Method of
Sequencing Operations for Assembly Lines).They used the
approach to model a U-shaped single-product assembly
system for washing machines andanalyze its behavior
employing the ARENA simulation procedure. Finally,
Eryürük[24] worked with different heuristic methods to
re-balance a clothes production line. Afterwards, she
simulated the systemsusing the ARENA procedure.
The simulation of the assembly line in the types of the
straight layout, the U-shaped layout and the parallel
U-shaped layout using WITNESS procedure is processed,
and the results of simulation are compared and evaluated
together.With the best performance of simulation in the
perspective of decrease of the need for workforce and the
balanced loading of equipment, parallel U-shaped layout is
chosen as the solution for the production line.
3. DESCRIPTION OF THE ASSEMBLY LINE
The possibilities of making use of the Witness
simulationenvironment are herein presented in the form of
simulationstudy that was performed within the framework
ofcooperative ventures between our workplace and
industrialpartner. To be exact, this was the use of the
Witnessenvironment to design and analyze different layouts
of a production line in a machinery company. In our study,
one typical manufacturing part is chosen from the company,
whose process flow is given in Fig.3
[image:3.595.308.547.291.618.2]Top hole drill 24mins melt 24mins Side hole drill 24mins Holder rivet 30mins Bore holel 36mins Tapping 72mins Part rivet 48mins Glue solidify 48mins measurem ent 24mins Clear up 36mins
Fig.3 Process flow chart of the part
The manufacturing part has four major types, amongst of
which, three have 10 operations and the other one has 9
operations. There are two production lines to make the four
types of parts, each of which has 15 machines and is
responsible for making two types of part. To clarify, some
operations in making the part are processed by two or three
machines concurrently in order to balance the average
throughput of the entire production process. The simulation
environment in our study is designed based on the use of the
Witness simulation environment. Witness is the product of
the British Lanner Group company and one of the most
successful world class environments for the simulation of
manufacturing, ancillary service and logistics processes.
To find a layout design solution to decrease the need for
workforce and to eliminate bottlenecks in the system, three
typical layouts, straight layout, U-shaped layout and parallel
U-shaped layout are simulated in the witness environment.
4. CONSTRUCTION OF THE MODEL IN THE WITNESS
ENVIRONMENT Production Plan Routing Process Time Personnel shift Batch quantity change
Parts arrive at random batch Input Simulation environment Straight line U-Shaped line Parallel U-Shaped line Labor number Machine
productivity Block time
Costs
Product quantity Flexibility
Conclusions and Recommendations Evaluation Suitable layout Balanced loading of the equipment
Decrease of labor number Follow-up research direction Flexibility Labor productivity Improvement of productivity
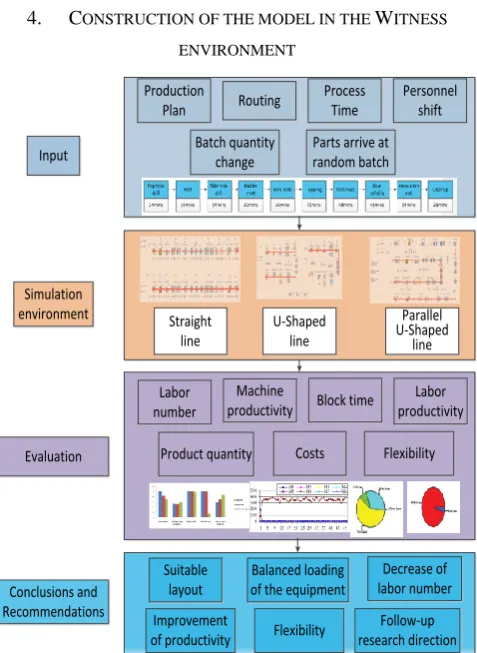
Fig 4 Architectural solution of the simulation
Fig.4 establishes the architectural solution of simulation.
The whole architecture contains four steps: input from the
reality, simulation in three layouts, simulation data analysis
(i.e., evaluation from labor number, productivity, blocks,
costs and so on), and conclusions and recommendations to
get suitable layout and solve the block problem.
In our simulation environment, all of the machines in the
[image:3.595.52.286.579.699.2]operator approaches the machine, positions the incomplete
product in its initial starting position, performs the requisite
essential steps associated with the individual operations, and
instructs the machine to begin operations.
The time measurement unit for the model is in minutes, to
meet the requirements in compliance with the provided
outputs. The simulation period chosen is seven working
days (i.e. two-shift operations). The machine time represents
the actual time that each individual machine needs to
complete its production operation, which is termed as -cycle
time in the simulation model. The operator time is inputted
into the model, modified by a randomizing factor based
upon a Gauss Curve with a 20 % spread factor.
In this paper, what we discuss is the assembly lines, and
the parts putting into the assembly lines are from other
plants. The batch quantity of the parts from other plants
couldn’t keep the plan. The batch quantity is inputted into
the model, changed by a randomizing factor based upon a
Passion with a 30% spread factor.
5. EVALUATION OF SIMULATION EXPERIMENTS AND
RESULTS
The three typical layout patterns identified above, i.e.,
straight, U-shape and Parallel, are simulated individually in
the simulation environment established in our study.
However, due to the page limitation, in this paper, we only
[image:4.595.310.542.78.501.2]present the detailed simulation result of the straight layout in
Table 1. The overall comparison of the simulation results of
the three layouts is shown in Table 2.
The model thus is based upon the all available data from
the company, experiential estimation identified from the
literature.
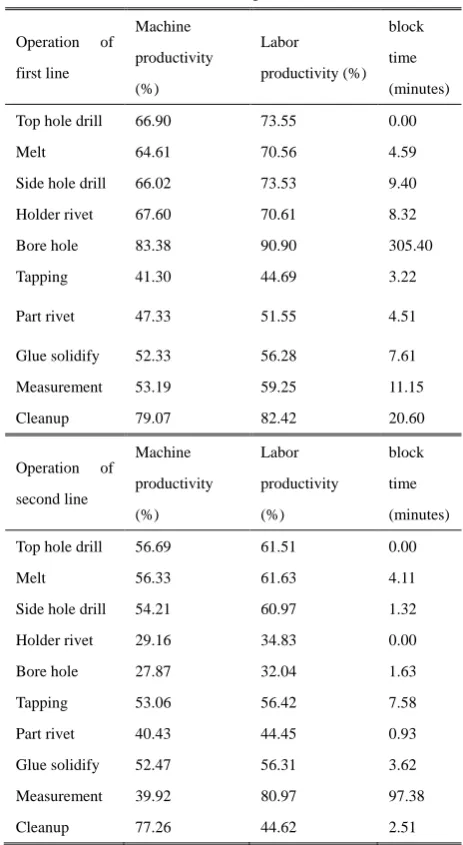
From the results of the simulated design model set out in
Table 1, it is clear that the distribution of operation of the
parts and the machines is not completely well-balanced.
Compared with the operation of bore hole in the second line,
the machine productivity, labor productivity and block time
are much too high in the operation of bore hole in the first
line. This situation causes insufficient supplies of semi
products to the first production line and may thereby lead to
the insufficient work loading of other production line
operators, who are waiting for the delivery of products from
work-stations further back down the line.
Table 1 The results of the simulation of the existing straight assembly line design
Operation of first line
Machine productivity (%)
Labor
productivity (%) block time (minutes) Top hole drill 66.90 73.55 0.00
Melt 64.61 70.56 4.59
Side hole drill 66.02 73.53 9.40 Holder rivet 67.60 70.61 8.32 Bore hole 83.38 90.90 305.40
Tapping 41.30 44.69 3.22
Part rivet 47.33 51.55 4.51
Glue solidify 52.33 56.28 7.61 Measurement 53.19 59.25 11.15
Cleanup 79.07 82.42 20.60
Operation of second line
Machine productivity (%)
Labor productivity (%)
block time (minutes) Top hole drill 56.69 61.51 0.00
Melt 56.33 61.63 4.11
Side hole drill 54.21 60.97 1.32 Holder rivet 29.16 34.83 0.00
Bore hole 27.87 32.04 1.63
Tapping 53.06 56.42 7.58
Part rivet 40.43 44.45 0.93
Glue solidify 52.47 56.31 3.62 Measurement 39.92 80.97 97.38
[image:4.595.318.538.548.692.2]Cleanup 77.26 44.62 2.51
Table 2 The simulation results comparison of three layouts
Straight -lines
U-shaped lines
Parallel U-shaped line Product quality 292 291 290 Machine average
productivity 52.9% 52.35% 58.06%
Labor number 60 50 42
Labor average
Fig.5 The simulation results comparison of three layouts
From Table 2 and Fig. 5, it is shown that the best results
are obtained in Parallel U-shaped line. Compared with the
straight lines and U-shaped lines, in the parallel U-shaped
line, the average machine productivity and labor
productivity are improved and meanwhile, the labor number
and block time are reduced. The experiments are based upon
the fact that centralized management of labor and machine
in the parallel U-shaped line. Also, with the decrease of the
labor number and the centralized labor, the cost of the
parallel U-shaped line is cheaper, the management difficulty
is reduced and setting of the production line is more
flexible.
The simulation experiments indicate that the best solution
is not only related to production line layout, but also the
balanced loading of equipment, decrease of labor number
and appropriate use of management.
6. CONCLUSIONS
This paper presents the optimized layout design of the
assembly line using the Witness simulation environment.
With the same predefined processes input data in
simulation, we compared three typical different layout
simulation experiment results of straight line, U-shaped line
and Parallel U-shaped line. From the analysis of simulation
result data, a conclusion is drawn that parallel U-shaped line
which meets the demand of decreasing the need for
workforce and settling the bottlenecks problem is the best
layout for this assembly line. Using concrete example, it has
been demonstrated that the use of the Witness simulation
environment-not only for suggestions designed to increase
the affectivity of existing production runs, but also in the
initial creation and design of production lines themselves is
valid and effective.
Industrial layout is an important part of the entire
production and processing chain. The transformation of the
industrial layout represents a change in the rules of the game.
Behind the industrial layout, there is a need to make
corresponding changes in production management and
personnel management. Otherwise, changing the soup
without changing the medicine will not achieve the goal of
improving production efficiency and drastically reducing
production personnel.
ACKNOWLEDGEMENT
This work was supported by UK-China Advanced
Aerospace Structure Manufacturing Technology Laboratory.
REFERENCES
[1] D. Mourtzis, M. Doukas, and D. Bernidaki, “Simulation inManufacturing: Review and Challenges,” Procedia CIRP,
vol. 25, pp.213–229, 2014.
[2] N. Shariatzadeh, G. Sivard, and D. Chen, “Software Evaluation Criteriafor Rapid Factory Layout Planning, Design and Simulation,” ProcediaCIRP, vol. 3, pp. 299–304, 2012.
[3] R. J. SUBY, “Facility Layout and Location—An Analytical Approach.By R. L. Francis and J. A. White. (New Jersey : Prentice-Hall Inc., 1974.)[Pp. 468.] Price £8-85.,” Int. J. Prod. Res., vol. 13, no. 2, p. 219, 1975.
[4] A. Negahban and J. S. Smith, “Simulation for manufacturing systemdesign and operation: Literature review and analysis,”
J. Manuf. Syst.,vol. 33, no. 2, pp. 241–261, 2014.
[5] Giulia Pedrielli, Andrea Matta, Arianna Alfieri and Mengyi Zhang, ”Design and control of manufacturing systems: a discrete event optimization methodology,”International Journal of Production Research, Vol. 56, Nos. 1–2, 543–564, 2018
[6] Dario Antonelli, Paweł Litwin and Dorota Stadnicka, “Multiple system dynamics and discrete event simulation for
manufacturing system performance evaluation”, Dario Antonelli et al. / Procedia CIRP 78, 178–183, 2018
[7] Jeff Fields, Dennis Davis, Alfred Taylor,” Simulation of the remote unit assembly and test: a case study”, Proceedings of the 2000 Winter Simulation Conference, J. A. Joines, R. R. Barton, K. Kang, and P. A. Fishwick, eds.
[8] Sriram Velumani, He Tang,” Operations status and bottleneck analysis and improvement of a batch process manufacturing line using discrete event simulation”, Procedia Manufacturing 10,100 – 111, 2017.
optimisation applications using discrete event simulation. International Journal of Computer Integrated Manufacturing. Vol. 30, Nos. 2–3, 215–228
[10]M. Law and M. G. McComas.1999.“Simulation of ManufacturingSystems,” in Proceedings of the 31st
Conference on Winter Simulation:Simulation---a Bridge to the Future - Volume 1, pp. 56–59.
[11]H. Yang, S. T. S. Bukkapatnam, and L. G. Barajas.2013.“Continuous flowmodelling of multistage assembly line system dynamics,” Int. J. Comput.Integr.
Manuf., vol. 26, no. 5, pp. 401–411.
[12]Sharda,B., Akiya, N,”Selecting make-to-stock and postponement policies for different products in a chemical plant: a case study using discrete event simulation”, Int.J.Prod.Econ. ,136(1), 161-171, 2012
[13]Tunali, S., Ozfirat, P.M., Ay, G.,” Setting order promising times in a supply chain network using hybrid simulation-analytical approach: an industrial case study”, Simul. Model. Pract. Theory 19(9), 1967-1982, 2011
[14]Mehrsai, A., H. Karimi, K. Thoben, and B. Scholz-Reiter, “Application of Learning Pallets for Real-Time Scheduling by
the Use of Radial Basis Function Network,”Neurocomputing 101: 82–93, 2013
[15]Wischnewski, R., and E. Freund, “COSIMIR® Transport: Modeling, Simulation and Emulation of Modular Carrier Based Transport Systems,” Proceedings – IEEEInternational Conference on Robotics and Automation2004 (5): 5171–5176, 2004
[16]Alrabghi, A., and A. Tiwari, “State of the Art in Simulation-Based Optimization for Maintenance Systems,”Computers& Industrial Engineering 82: 167–182, 2015.
[17]Miltenburg J, ” Balancing U-lines in a multiple U-line facility”, Eur J Oper Res. 109(1):1-23,1998
[18]IbrahimKucukkoc, DavidZ.Zhang,“Balancing of parallel U-shaped assembly lines”, Computer & Operations Research, 64, 233-244, 2015.
[19]Wang, Q., S. Lassalle, A.R. Mileham, and G.W. Owen, “Analysis of a Linear Walking Worker Line Using a
Combination of Computer Simulation and Mathematical Modeling Approaches”,Journal of Manufacturing Systems 28:64-70,2009
[20]Tiacci, L,“Event and Object Oriented Simulation to Fast Evaluate Operational Objectives of Mixed Model Assembly Lines Problems”,SimulationModeling Practice and Theory
24:35–48,2012
[21]Martinez, F.M. and L.M.A. Bedia, “Modular Simulation Tool
for Modeling JIT Manufacturing”,International Journal of Production Research 40:1529-1547,2002
[22]Baykoç, Ö.F ,“Investigation the Behavior of a Balanced Stochastic U-type Assembly Line Using Simulation”, International Journal of Science & Technology 3:75-84,2008. [23]Arcus, A.L ,“COMSOAL: A Computer Method of
Sequencing Operations for Assembly Lines”,International Journal of Production Research, 4:259–277, 1966.