Supported by the Ministry of Education, Youth and Sports of the Czech Republic (Projects “CENAKVA” No. CZ.1.05/2.1.00/01.0024 and “CENAKVA II” No. LO1205 under the NPU I program, and Project Biodiverzita No. CZ.02.1.01/0.0/0.0/16_025/0007370) and by the Grant Agency of the University of South Bohemia in České Budějovice (Project No. 125/2016/Z).
Estimation of Genetic Parameters of Fatty Acids
Composition in Flesh of Market Size Common Carp
(Cyprinus carpio L.) and Their Relation to Performance
Traits Revealed that Selective Breeding Can Indirectly
Affect Flesh Quality
Martin Prchal
1*, Marc Vandeputte
2,3, David Gela
1, Marek Doležal
4,
Hana Buchtová
5, Marek Rodina
1, Martin Flajšhans
1, Martin Kocour
11South Bohemian Research Center of Aquaculture and Biodiversity of Hydrocenoses,
Faculty of Fisheries and Protection of Waters, University of South Bohemia in České Budějovice, Vodňany, Czech Republic
2GABI, INRA, AgroParisTech, University of Paris-Saclay, Jouy-en-Josas, France 3Ifremer, Palavas-les-Flots, France
4Department of Food Chemistry and Analysis, Institute of Chemical Technology in Prague,
Prague, Czech Republic
5Department of Meat Hygiene and Technology, University of Veterinary and Pharmaceutical
Sciences Brno, Brno, Czech Republic *Corresponding author: [email protected]
ABSTRACT
Prchal M., Vandeputte M., Gela D., DoležalM., BuchtováH., RodinaM., Flajšhans M., KocourM. (2018): Estimation of genetic parameters of fatty acids composition in flesh of market size common carp (Cyprinus carpio L.) and their relation to performance traits revealed that selective breeding can
indirectly affect flesh quality. Czech J. Anim. Sci., 63, 280–291.
Fish are an important source of omega-3 poly-unsaturated fatty acids (n-3 PUFAs, mainly eicosa-pentaenoic acid – EPA and docosahexaenoic acid – DHA) with a favourable ratio of omega-6/omega3 PUFA ratio (n-6/n-3) and thus, they should be an integral part of human diet at least twice a week (Mraz et al. 2012a; Rodriguez et al. 2017). In gen-eral, n-3 PUFAs are higher in marine fish species in comparison to freshwater fish species and phe-notypic variation of fatty acids (FA) composition is considerable among fish species (Fontagne-Dicharry and Medale 2010). Environmental and nutritional factors can significantly impact the FA profile (Mraz and Pickova 2011; Markovic et al. 2016; Trbovic et al. 2017). Besides, genetic background in FA composition also plays a certain role as has re-cently been observed in Nile tilapia (Oreochromis niloticus) (Nguyen et al. 2010), Atlantic salmon (Salmo salar) (Leaver et al. 2011), and rainbow trout (Oncorhynchus mykiss) (Overturf et al. 2013). Common carp is one of the most important fresh-water fish species for world aquaculture and its annual production is continuously increasing (http://www. fao.org/fishery/statistics/software/FishStatJ/en). In the recent past, several studies confirmed the possibility to favourably improve common carp FA composition in the flesh by increasing n-3 PUFAs using special diets (Mraz et al. 2012a, b; Steffens 2016). Likewise, it was observed that the muscle fat content is a highly heritable trait (Kocour et al. 2007). Yet, information about genetic variation of FA composition in common carp is still missing. While recent studies in common carp confirmed potential for genetic improvement of growth (Vandeputte et al. 2004, 2008; Kocour et al. 2007; Prchal et al. 2018) and slaughtering yields (Kocour et al. 2007; Prchal et al. 2018) by systematic selection, nothing is known about how those traits are correlated to flesh FA composition.
The aim of this study was to quantify genetic and phenotypic variation related to FA composition in
flesh and performance traits in 3-year-old common carp. The intent was (i) to estimate genetic variation of the most important FA groups and performance traits, (ii) to assess genetic and phenotypic corre-lations among FA groups and between FA groups and performance traits, (iii) to evaluate prospects for selective breeding programs targeting on flesh quality improvement in common carp.
MATERIAL AND METHODS
Experimental stock.The study was performed on the Hungarian synthetic mirror carp strain (HSM) bred at the University of South Bohemia (USB), Research Institute of Fish Culture and Hydrobiology (RIFCH) in Vodňany, Czech Republic (Vandeputte et al. 2004). In the period 2002–2007, the HSM was an object of studies focused on genetic variation of various performance traits (Vandeputte et al. 2004, 2008; Kocour et al. 2007). The G3 stock used for the present study was established by artificial spawning of 8 G0 females and 96 G2 males with individual collection of gametes applying a full-factorial mating design in May 2005 at the fish hatchery of the USB RIFCH. More details about reproduction and mating design are described by Kocour et al. (2007). Before mating, fin tissue from caudal fin (approximately 1 cm2) was col-lected from each broodstock fish used (n = 104) and stored in 98% ethanol at room temperature until genotyping.
Rearing of experimental stock until market size.During the first growing season and first wintering, the experimental stock was reared un-der common semi-intensive pond conditions in two 0.16 ha nursery earthen ponds (stocking fish density was 125 000 larvae per ha) (Vandeputte et al. 2008). The nutritional requirements were covered by natural food (zooplankton and zoo-benthos) and supplemental feeding using plant-to fillet yield improvement (rg = 0.50–0.62) while having little impact on muscle fat (rg = 0.21). However, lipid quality in flesh would be affected: n-3 PUFA-TF would decrease and the n-6/n-3 PUFA ratio would increase. A likely interpretation is that faster growing genotypes consume more supplemental feed, which was poor in the beneficial FAs. For sustainable selective breeding, supplemental feed composition should be modified, so that faster growing carps would maintain an appropriate flesh quality.
Keywords:genetic correlations; genetic improvement; growth; heritability; slaughtering traits, supplemental
based pellets (ZZN Strakonice, Czech Republic); feed was distributed 3 times a week from eight weeks of age until the end of September in doses of 5–10% of the fish stock biomass per feeding day adjusted according to the abundance of zooplank-ton, oxygen level, and water temperature. In the second spring (April 2006) 750 randomly selected fish from each pond were PIT-tagged, fin-clipped for future genotyping and parentage assignment. Subsequently, all fish were communally reared in one pond throughout the second growing season, the second wintering, and the third growing season when fish reached the market size (Vandeputte et al. 2008). Details on stocking densities and other fish handling are described by Kocour et al. (2007). During the second and the third growing season carp were fed with natural food (zooplankton, zoobenthos) developing in ponds and plant-based pellets altered later with wheat grain without any treatment. The supplemental feed was served three times a week in doses of 1.5–3% of the fish stock biomass per feeding day adjusted according to the abundance of zooplankton, level of dissolved oxygen, water temperature, and required harvest weight. The natural food and the additional feed contribute approximately 1 : 1 to the weight gain of fish (Horvath et al. 1992). The natural food is an important source of proteins, fat, and other bioactive compounds (nutritional profile in % of dry matter: crude protein (CP) 54.8–69.8%, carbo-hydrates (CH) 3.0–4.8%, total fat (TF) 5.7–13.2%, FA composition in % of total fat: saturated FAs (SFAs) 22.6–28.4%, monounsaturated FAs (MU-FAs) 18.2–25.8%, omega-3 polyunsaturated FAs (n-3 PUFAs) 33–59.2%, omega-6 polyunsaturated FAs (n-6 PUFAs) 6.95–13.6%; dry matter (DM) 10–20%) (Mraz and Pickova 2009). The addi-tional food serves mostly as a source of energy in carbohydrates that are well utilized by common carp (nutritional profile of plant-based pellets: DM 88.8%, CP 17.9%, CH 58.9%, TF 3.7%, FA composition in % of total fat: SFAs 13.6–16.5%, MUFAs 17.5–37.9%, n-3 PUFAs 4.5–5.6%, n-6 PUFAs 42.9–61.0%; nutritional profile of wheat grain: DM 88.3%, CP 10.4%, CH 72%, TF 2.4%, FA composition in % of total fat: SFAs 18.3%, MUFAs 16.3%, n-3 PUFAs 4.2%, n-6 PUFAs 61.3%) (Mraz et al. 2012b). Unutilized carbohydrates are stored as glycogen or they are changed to FAs (mostly MUFAs) and stored in muscle and hepatopancreas (Mraz et al. 2012b). After pond harvest at the end
of the third growing season, all survivors (n = 336) were kept in a storage pond for three weeks to empty the intestines and to refresh the odour and taste of flesh, a practice commonly known as purging (Zajic et al. 2013).
Phenotypic recordings and parental allocation. Final recordings were performed at the facility of the USB RIFCH in Vodňany, Czech Republic in October 2007. The fish were killed by a blow to the head, then bled by cutting the gills according to local rules. Immediately after bleeding, standard length (SL in mm) and body weight (BW in g) were recorded. Subsequently, the fish were gut-ted, fillegut-ted, sexed by visual inspection of gonads (females, males), and each part of the processed body (head, fillets, viscera, gonads, skin, skeleton with remnants, fins, scales) was weighed to the nearest 0.5 g. Each fillet without skin was labelled, packed in aluminum foil, kept on ice until the end of the day when deeply frozen and stored at –80°C until fat and fatty acids analysis. Percent-age of processed body (Kocour et al. 2007) or so-called headless carcass yield (% hl-Carss) and fillet yield with skin (% Fill) and without skin (% Fill DS) were calculated as the most important slaughtering traits:
% hl-Carss = (fillet weight + skin weight + weight of skel-eton with remnants)/body weight × 100
% Fill = (fillet weight + skin weight)/body weight × 100
% Fill DS = (fillet weight/body weight) × 100.
In addition, we calculated Fulton’s condition factor (FC) and gonadosomatic index (GSI):
FC = 105 × body weight/standard length3
GSI = gonadal weight/body weight × 100
The parentage assignment was based on the analysis of 11 microsatellite loci: MFW7, MFW9, MFW11, MFW16, MFW18, and MFW26 for all fish, MFW3, MFW12, MFW20, MFW29, and MFW40 for some fish only. The parental allocation was performed by exclusion with one or two mis-matches tolerated, using the VITASSIGN software (Vandeputte et al. 2006).
7 females and 36 males, belonging to 115 full-sibs families, were selected for the FA composition analysis. The reduction of samples for the FA analysis was done due to the costs of analysis. For a given sample size in such a factorial design, the precision of heritability estimates mostly de-pends on a combination of a minimum number of sires and a minimum number of offspring per sire (Dupont-Nivet et al. 2002). Thus, the progeny of all sires that were represented in the whole set of 336 slaughtered fish with less than 3 progeny were not considered as suitable for this study. Fillets of selected fish were homogenized using a flesh-suitable mixer and for fat and FA analysis an appropriate aliquot was taken.
The total fat content in wet muscle tissue was determined gravimetrically by the Soxhlet meth-od according to Application note 390/revision 2.8/2007 (FOSS Analytical AB 2003) by extraction in solvent petroleum ether using Soxtec 2055 (FOSS Tecator AB, Sweden) after the acid hydrolysis of samples using SoxCap 2047 (FOSS Tecator AB).
The composition of fatty acids was determined from total lipids in wet muscle tissue which were extracted with chloroform-methanol (2 : 1 v/v) according to the method of Folch et al. (1957). Derivatization of fatty acids was based on the base-catalysed reaction using NaOH-methanol as reagent. Fatty acid methyl esters (FAMEs) were then extracted to hexane. FAMEs were analysed by gas-liquid chromatography using a SP-2560 fused silica capillary column (100 m × 0.25 mm i.d., 20 μm film thickness) (Supelco, USA) in an Agilent 6890 gas chromatograph (Agilent Technologies, USA) equipped with flame ionization detector (FID). The oven temperature was 175°C for 30 min, then it was increased by 1°C/min to 210°C where it was maintained for 40 min. Detector and injection port temperatures were 220°C and the nitrogen carrier gas flow was 1 ml/min. For the identification of FAME, standard FAME mixtures were analysed. To confirm the identification of some FAMEs, the gas chromatography–mass spectrometry (GC/MS) analysis was carried out in the GC/MSD system Agilent 5975 (Agilent Technologies) with the same column and temperature conditions as above, except for the helium flow, which was 0.6 ml/min and the detector temperature was 250°C.
Quantitative genetic analysis.The final da-taset comprised percentage of total muscle fat in wet muscle tissue (Fat-M), relative values of FAs
presented as % of total fat (SFA-TF, MUFA-TF, PUFA-TF, n-6 PUFA-TF, n-3 PUFA-TF, EPA-TF, DHA-TF), absolute values of FA in % of wet muscle tissue (SFA-M, MUFA-M, PUFA-M, n-6 PUFA-M, n-3 PUFA-M, EPA-M, DHA-M), ratio of n-6/n-3 PUFAs and performance traits (BW, FC, GSI, % hl-Carss, % Fill DS, % Fill) (for trait abbreviations see Table 1). Variance (phenotypic: VP, genetic: VA) and covariance (phenotypic: rp, genetic: rg) components were estimated in multivariate mixed models us-ing the restricted maximum likelihood method in VCE (Groeneveld et al. 2008) and DMU softwares (Madsen and Jensen 2013). The statistical model to estimate (co)variance components for the traits recorded was:
Yijk = μi+ sexij + (βi × body weightk) + animik + eijk
where:
Yijk = vector of observations (for all analysed traits) μi = overall mean for a trait i
sexij = fixed effect of sex (j = female, male, unidenti-fied) for trait i
βi = regression coefficient between the weight of body part i and the covariate body weight, so that the genetic parameters estimated were those of the residual of the regression of the weight of a given body part on body weight, which was used as a surrogate for the yield of this body part, as proposed by Vandeputte et al. (2014); this regression on body weight was used only for weight of body parts (yield traits) animik = random genetic effect of an animal k (k = 1, 2,
etc. – no. of individual) for a trait i
eijk = random residual.
Likewise, a random maternal effect was calcu-lated. However, this effect was negligible for all traits, and thus it was not included in the final model. Moreover, no other significant covari-ates (including body weight in relation to FAs) or fixed effects (including pond effect during the first growing season) associated to analyzed traits were found. Heritability estimates were calculated as the ratio of genetic variance (VA) divided by the total phenotypic variance (VP), where VP is the sum of genetic (VA) and residual variance (VR), h2 = V
was considered significant when the difference in –2Log-likelihood was higher than the thresh-old value for P < 0.05 of a χ2 distribution with 1 degree of freedom (Pinheiro and Bates 2000). Genetic correlation was considered significant if |rg| – |1.96 × standard error (SE)| was higher than zero (two-tailed hypothesis) (Kause et al. 2016).
RESULTS
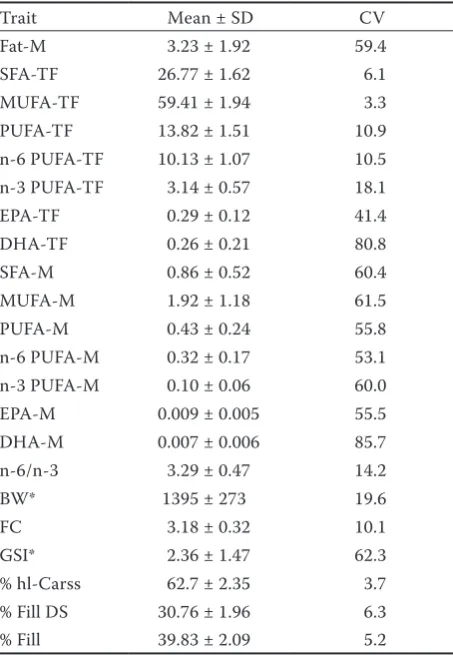
Fatty acids composition. The basic statistics of FA composition in 3-year-old common carp flesh are listed in Table 1. The mean fat content presented as % in wet muscle tissue was 3.23%. Among the main FA groups, MUFA-TF (59.41%) and MUFA-M (1.92%) represented the largest fraction, followed by SFA-TF (26.77%) and SFA-M (0.86%) and PUFAs (PUFA-TF 13.82%, PUFA-M 0.43%). The amount of omega-6 FAs (n-6) was 10.13% for n-6 PUFA-TF and 0.32% for n-6 PUFA-M. Omega-3 FAs (n-3) were 3.14% for n-3 PUFA-TF and 0.10% for n-3 PUFA-M. The ratio of n-6/n-3 was 3.29. The most beneficial groups of n-3 PUFAs, EPA and DHA, achieved in relative values: EPA-TF 0.29%, DHA-TF 0.26%, and in absolute values: EPA-M 0.009%, DHA-M 0.007%.
Performance traits. The phenotypic values of performance traits are presented within Table 1. The mean body weight of carps used for this study was 1395 g with condition factor of 3.18 and GSI of 2.36. The mean yields of headless carcass (63%), fillets with skin (40%) and without skin (31%) were similar to values observed in other studies done on the same breed and conditions (Kocour et al. 2007). Sex had a significant effect on BW and GSI only.
Parentage assignment. The parental allocation followed by sample reduction (see Material and Methods) resulted in 158 pedigreed animals with fatty acids phenotype, from 115 full-sibs families produced from 7 dams and 36 sires, with an average full-sibs family size of 1.37 (range 1–4), an average paternal half-sibs family size of 4.39 (range 3–8), and an average maternal half-sibs family size of 26.17 (range 17–42).
Heritability estimates. The heritability esti-mates are reported as values ± standard errors (SE) in diagonal (bold) within Table 2 (FA com-position) and Table 5 (performance traits). Only five heritability estimates out of 16 analyzed FA
traits were significantly different from zero (Fat-M, PUFA-TF, n-3 PUFA-TF, EPA-TF, n-6/n-3). The heritability of total fat and FA composition was moderate (0.24–0.37). Performance traits also had moderate heritability, (only GSI was not signifi-cant) except body weight (BW) which was highly heritable (h2 = 0.62 ± 0.20).
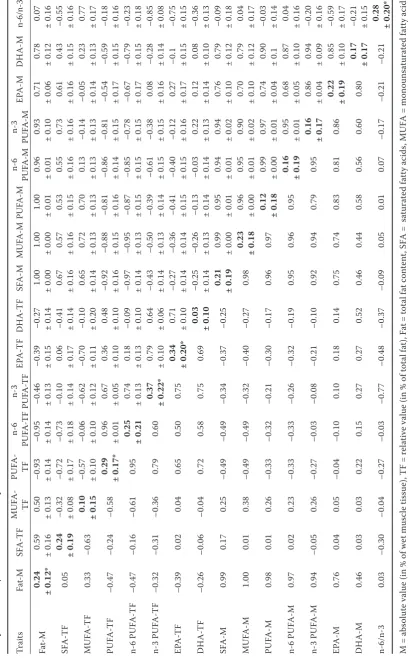
[image:5.595.305.532.270.598.2]Correlations among fat and fatty acids. Genetic and phenotypic correlations among total fat and
Table 1. Mean ± standard deviation (SD) and coefficient of variation (CV) of fatty acid composition and performance traits in 3-year-old common carp (n = 158)
Trait Mean ± SD CV
Fat-M 3.23 ± 1.92 59.4
SFA-TF 26.77 ± 1.62 6.1
MUFA-TF 59.41 ± 1.94 3.3
PUFA-TF 13.82 ± 1.51 10.9
n-6 PUFA-TF 10.13 ± 1.07 10.5
n-3 PUFA-TF 3.14 ± 0.57 18.1
EPA-TF 0.29 ± 0.12 41.4
DHA-TF 0.26 ± 0.21 80.8
SFA-M 0.86 ± 0.52 60.4
MUFA-M 1.92 ± 1.18 61.5
PUFA-M 0.43 ± 0.24 55.8
n-6 PUFA-M 0.32 ± 0.17 53.1
n-3 PUFA-M 0.10 ± 0.06 60.0
EPA-M 0.009 ± 0.005 55.5
DHA-M 0.007 ± 0.006 85.7
n-6/n-3 3.29 ± 0.47 14.2
BW* 1395 ± 273 19.6
FC 3.18 ± 0.32 10.1
GSI* 2.36 ± 1.47 62.3
% hl-Carss 62.7 ± 2.35 3.7
% Fill DS 30.76 ± 1.96 6.3
% Fill 39.83 ± 2.09 5.2
M = absolute value (in % of wet muscle tissue), TF = rela-tive value (in % of total fat), Fat= total fat content, SFA = saturated fatty acids, MUFA = monounsaturated fatty acids, PUFA = polyunsaturated fatty acids, n-6 PUFA = omega-6 polyunsaturated fatty acids, n-3 PUFA = omega-3 polyun-saturated fatty acids, EPA = eicosapentaenoic acid, DHA = docosahexaenoic acid, n-6/n-3 = ratio between omega-6 and omega-3 polyunsaturated fatty acids, BW = body weight, FC = Fulton’s condition factor, GSI = gonadosomatic index, % hl-Carss = headless carcass yield, % Fill DS = deskinned fillet yield, % Fill = fillet yield
Ta
ble 2. H
er ita bility e stima te s ( bold, di agonal, ± standard er ror (S E)) , gene tic (a bove di agonal, ± SE) and phenoty pic ( be low di agonal) c or re la
tions in f
at ty ac id s com po
sition of
3-ye ar -old c ommon c ar p Trait s Fa t-M SFA -T F M U FA -TF PU FA - TF n-6 PU FA -T F n-3 PU FA -T F EPA -T F DH A -TF SFA -M MU FA -M PU FA -M n-6 PU FA -M n-3 PU FA -M EPA -M DH A -M n-6/n-3 Fa t-M 0.24 ± 0.12* 0.59 ± 0.16 0.50 ± 0.13
–0.93 ± 0.14 –0.95 ± 0.14 –0.46 ± 0.13 –0.39 ± 0.15 –0.27 ± 0.14
1.00 ± 0.00 1.00 ± 0.00 1.00 ± 0.01 0.96 ± 0.01 0.93 ± 0.10 0.71 ± 0.06 0.78 ± 0.12 0.07 ± 0.16 SFA -T F 0.05 0.24 ± 0.19
–0.32 ± 0.08 –0.72 ± 0.17 –0.73 ± 0.18 –0.10 ± 0.14
0.06
± 0.17
–0.41 ± 0.14
0.67 ± 0.16 0.57 ± 0.16 0.53 ± 0.15 0.55 ± 0.16 0.73 ± 0.16 0.61 ± 0.16 0.43 ± 0.15
–0.55 ± 0.16
MU FA -TF 0.33 –0.63 0.10 ± 0.15
–0.57 ± 0.10 –0.06 ± 0.10 –0.62 ± 0.12 –0.70 ± 0.11 –0.10 ± 0.20
0.65 ± 0.14 0.72 ± 0.13 0.70 ± 0.13 0.13 ± 0.13
–0.14 ± 0.13 –0.05 ± 0.14
0.23 ± 0.13 0.77 ± 0.17 PU FA -T F –0.47 –0.24 –0.58 0.29 ± 0.17* 0.96 ± 0.01 0.67 ± 0.05 0.36 ± 0.10 0.48 ± 0.10
–0.92 ± 0.16 –0.88 ± 0.15 –0.81 ± 0.16 –0.86 ± 0.14 –0.81 ± 0.15 –0.54 ± 0.17 –0.59 ± 0.15 –0.18 ± 0.16
n-6 P U FA -TF –0.47 –0.16 –0.61 0.95 0.25 ± 0.21 0.74 ± 0.13 0.18 ± 0.13
–0.09 ± 0.10 –0.97 ± 0.14 –0.95 ± 0.13 –0.87 ± 0.15 –0.85 ± 0.15 –0.78 ± 0.15 –0.67 ± 0.17 –0.79 ± 0.15 –0.23 ± 0.18
n-3 P U FA -TF –0.32 –0.31 –0.36 0.79 0.60 0.37 ± 0.22* 0.79 ± 0.10 0.64 ± 0.06
–0.43 ± 0.14 –0.50 ± 0.13 –0.39 ± 0.14 –0.61 ± 0.15 –0.38 ± 0.15
0.08
± 0.16
–0.28 ± 0.14 –0.85 ± 0.08
EPA -T F –0.39 0.02 0.04 0.65 0.50 0.75 0.34 ± 0.20* 0.71 ± 0.10
–0.27 ± 0.14 –0.36 ± 0.14 –0.41 ± 0.15 –0.40 ± 0.15 –0.12 ± 0.16
0.27
± 0.17
–0.1 ± 0.15 –0.75 ± 0.15
DH A -TF –0.26 –0.06 –0.04 0.72 0.58 0.75 0.69 0.03 ± 0.10
–0.25 ± 0.14 –0.26 ± 0.13 –0.13 ± 0.14 –0.03 ± 0.14
0.22 ± 0.13 0.12 ± 0.14 0.08 ± 0.10
–0.36 ± 0.13
SFA -M 0.99 0.17 0.25 –0.49 –0.49 –0.34 –0.37 –0.25 0.21 ± 0.19 0.99 ± 0.00 0.95 ± 0.01 0.94 ± 0.01 0.94 ± 0.02 0.76 ± 0.10 0.79 ± 0.12
–0.09 ± 0.18
MU FA -M 1.00 0.01 0.38 –0.49 –0.49 –0.32 –0.40 –0.27 0.98 0.23 ± 0.18 0.96 ± 0.00 0.95 ± 0.01 0.90 ± 0.02 0.70 ± 0.10 0.79 ± 0.12 0.04 ± 0.17 PU FA -M 0.98 0.01 0.26 –0.33 –0.32 –0.21 –0.30 –0.17 0.96 0.97 0.12 ± 0.18 0.99 ± 0.00 0.97 ± 0.01 0.74 ± 0.04 0.90 ± 0.1
–0.03 ± 0.14
n-6 P U FA -M 0.97 0.02 0.23 –0.33 –0.33 –0.26 –0.32 –0.19 0.95 0.96 0.95 0.16 ± 0.19 0.95 ± 0.01 0.68 ± 0.05 0.87 ± 0.10 0.04 ± 0.16 n-3 P U FA -M 0.94 –0.05 0.26 –0.27 –0.03 –0.08 –0.21 –0.10 0.92 0.94 0.79 0.95 0.16 ± 0.17 0.86 ± 0.04 0.94 ± 0.09
–0.20 ± 0.16
EPA -M 0.76 0.04 0.05 –0.04 –0.10 0.10 0.18 0.14 0.75 0.74 0.83 0.81 0.86 0.22 ± 0.19 0.85 ± 0.10
–0.59 ± 0.17
DH A -M 0.46 0.03 0.03 0.22 0.15 0.27 0.27 0.52 0.46 0.44 0.58 0.56 0.60 0.80 0.17 ± 0.17
–0.21 ± 0.15
n-6/n-3 0.03 –0.30 –0.04 –0.27 –0.03 –0.77 –0.48 –0.37 –0.09 0.05 0.01 0.07 –0.17 –0.21 –0.21 0.28 ± 0.20*
M = a
bs
olut
e v
alue (in % of we
t m
us
cle ti
ssue), TF = r
el
ative v
alue (in % of t
ot al f at), F at = t ot al f at c on ten t, S
FA = sa
tura te d f at ty ac id s, MU
FA = monounsa
tura te d f at ty ac id s, PU
FA = p
oly unsa tura te d f at ty ac id
s, n-6 P
U
FA = ome
ga-6 p oly unsa tura te d f at ty ac id
s, n-3 P
U
FA = ome
ga-3 p oly unsa tura te d f at ty ac id s, E
PA = eic
osa pen taenoic ac id, DH A = do co sahe xaenoic ac
id, n-6/n-3 = ra
tio b
etwe
en ome
ga-6 and ome
FAs are presented in Table 2. Medium negative phenotypic correlations were observed between Fat-M and all beneficial FA groups in relative values (PUFA-TF, n-6 PUFA-TF, n-3 PUFA-TF, EPA-TF, DHA-TF; rp = –0.26 to –0.47). Similarly, absolute values of SFA-M, MUFA-M, and PUFA-M were negatively correlated to relative values of beneficial FA groups as described before (rp = –0.17 to –0.49). Conversely, medium to close to one positive cor-relations were found between Fat-M and absolute values of FA groups (rp = 0.46–1.00). Likewise, among other absolute values of FA groups a gen-eral positive trend of phenotypic correlations was observed (0.44–0.98). Moreover, relative values of SFA-TF and MUFA-TF were negatively related to each other and to relative values of PUFA-TF, n-6 PUFA-TF, and n-3 PUFA-TF (rp = –0.16 to –0.63). The ratio of n-6/n-3 exhibited negative phenotypic associations with beneficial FA groups in relative values: PUFA-TF, n-3 PUFA-TF, EPA-TF, DHA-TF. In most cases, genetic correlations had a pat-tern similar to phenotypic correlations. Fat-M was negatively genetically related to beneficial FA groups (–0.27 to –0.93). Oppositely, positive
genetic correlations were observed between Fat-M and SFA-TF (0.59) and MUFA-TF (0.50). The ab-solute values of SFA-M, MUFA-M, and PUFA-M were negatively correlated to several favourable FA groups in relative values (PUFA-TF, n-6-TF, n-3 PUFA-TF, EPA-TF; rg = –0.27 to –0.97). Strong positive genetic correlations were observed be-tween Fat-M and other absolute values of FAs and among all FA groups in absolute values. The relative values of SFA-TF and MUFA-TF were negatively genetically correlated to each other and to relative values of PUFA-TF, n-6 PUFA-TF, and n-3 PUFA-TF. However, not all estimates were significantly different from zero. Regard-ing the n-6/n-3 ratio, medium to high negative genetic correlations were observed with SFA-TF, n-3 PUFA-TF, EPA-TF, DHA-TF, and EPA-M (rg = –0.36 to –0.85. Oppositely, MUFA-TF was posi-tively correlated to n-6/n-3.
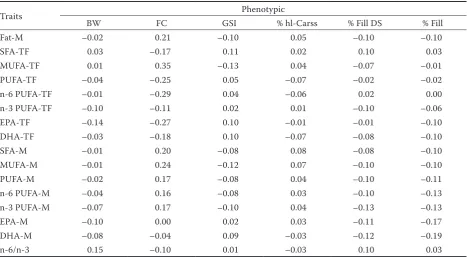
[image:7.595.64.533.434.691.2]Correlations between fatty acids and perfor-mance traits. Table 3 presents phenotypic correla-tions between FA groups and performance traits. Generally, phenotypic correlations were in most cases low or negligible. The highest negative and
Table 3. Phenotypic correlations between fatty acid composition and performance traits
Traits Phenotypic
BW FC GSI % hl-Carss % Fill DS % Fill
Fat-M –0.02 0.21 –0.10 0.05 –0.10 –0.10
SFA-TF 0.03 –0.17 0.11 0.02 0.10 0.03
MUFA-TF 0.01 0.35 –0.13 0.04 –0.07 –0.01
PUFA-TF –0.04 –0.25 0.05 –0.07 –0.02 –0.02
n-6 PUFA-TF –0.01 –0.29 0.04 –0.06 0.02 0.00
n-3 PUFA-TF –0.10 –0.11 0.02 0.01 –0.10 –0.06
EPA-TF –0.14 –0.27 0.10 –0.01 –0.01 –0.10
DHA-TF –0.03 –0.18 0.10 –0.07 –0.08 –0.10
SFA-M –0.01 0.20 –0.08 0.08 –0.08 –0.10
MUFA-M –0.01 0.24 –0.12 0.07 –0.10 –0.10
PUFA-M –0.02 0.17 –0.08 0.04 –0.10 –0.11
n-6 PUFA-M –0.04 0.16 –0.08 0.03 –0.10 –0.13
n-3 PUFA-M –0.07 0.17 –0.10 0.04 –0.13 –0.13
EPA-M –0.10 0.00 0.02 0.03 –0.11 –0.17
DHA-M –0.08 –0.04 0.09 –0.03 –0.12 –0.19
n-6/n-3 0.15 –0.10 0.01 –0.03 0.10 0.03
positive phenotypic correlations were observed especially between FC and most FA groups.
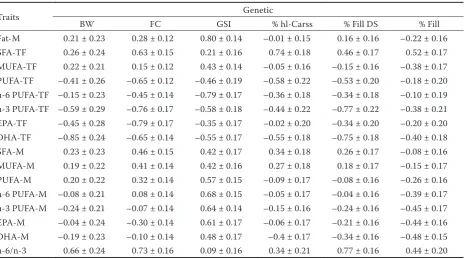
Genetic correlations between FA groups and performance traits are reported in Table 4. In contrast to phenotypic correlations, the effect of genetic correlations was more visible. Negative correlations were observed between BW and n-3 PUFA-TF and BW and DHA-TF (rg = −0.59; −0.85, respectively). Furthermore, BW was positively
[image:8.595.67.533.110.369.2]cor-related to n-6/n-3 ratio (0.66). An intermediately high positive genetic correlation was observed between FC and SFA-TF (rg = 0.63 ± 0.15) and between FC and absolute values of main FA groups (SFA, MUFA, PUFA) including the n-6/n-3 ratio (rg = 0.32–0.73). FC also exhibited medium to high negative genetic correlations to all beneficial FA groups in relative values (rg = –0.45 to –0.79). Similarly, GSI was negatively associated with the Table 4. Genetic correlations (± standard error) between fatty acid composition and performance traits
Traits Genetic
BW FC GSI % hl-Carss % Fill DS % Fill
Fat-M 0.21 ± 0.23 0.28 ± 0.12 0.80 ± 0.14 –0.01 ± 0.15 0.16 ± 0.16 –0.22 ± 0.16 SFA-TF 0.26 ± 0.24 0.63 ± 0.15 0.21 ± 0.16 0.74 ± 0.18 0.46 ± 0.17 0.52 ± 0.17 MUFA-TF 0.22 ± 0.21 0.15 ± 0.12 0.43 ± 0.14 –0.05 ± 0.16 –0.15 ± 0.16 –0.38 ± 0.17 PUFA-TF –0.41 ± 0.26 –0.65 ± 0.12 –0.46 ± 0.19 –0.58 ± 0.22 –0.53 ± 0.20 –0.18 ± 0.20 n-6 PUFA-TF –0.15 ± 0.23 –0.45 ± 0.14 –0.79 ± 0.17 –0.36 ± 0.18 –0.34 ± 0.18 –0.10 ± 0.19 n-3 PUFA-TF –0.59 ± 0.29 –0.76 ± 0.17 –0.58 ± 0.18 –0.44 ± 0.22 –0.77 ± 0.22 –0.38 ± 0.21 EPA-TF –0.45 ± 0.28 –0.79 ± 0.17 –0.35 ± 0.17 –0.02 ± 0.20 –0.34 ± 0.20 –0.20 ± 0.20 DHA-TF –0.85 ± 0.24 –0.65 ± 0.14 –0.55 ± 0.17 –0.55 ± 0.18 –0.75 ± 0.18 –0.40 ± 0.18 SFA-M 0.23 ± 0.23 0.46 ± 0.15 0.42 ± 0.17 0.34 ± 0.18 0.26 ± 0.17 –0.08 ± 0.16 MUFA-M 0.19 ± 0.22 0.41 ± 0.14 0.42 ± 0.16 0.27 ± 0.18 0.18 ± 0.17 –0.15 ± 0.17 PUFA-M 0.20 ± 0.22 0.32 ± 0.14 0.57 ± 0.15 –0.09 ± 0.17 –0.08 ± 0.16 –0.26 ± 0.16 n-6 PUFA-M –0.08 ± 0.21 0.08 ± 0.14 0.68 ± 0.15 –0.05 ± 0.17 –0.04 ± 0.16 –0.39 ± 0.17 n-3 PUFA-M –0.24 ± 0.21 –0.07 ± 0.14 0.64 ± 0.14 –0.15 ± 0.16 –0.24 ± 0.16 –0.45 ± 0.17 EPA-M –0.04 ± 0.24 –0.30 ± 0.14 0.61 ± 0.17 –0.06 ± 0.17 –0.21 ± 0.16 –0.44 ± 0.16 DHA-M –0.19 ± 0.23 –0.10 ± 0.14 0.48 ± 0.17 –0.4 ± 0.17 –0.34 ± 0.16 –0.48 ± 0.15 n-6/n-3 0.66 ± 0.24 0.73 ± 0.16 0.09 ± 0.16 0.34 ± 0.21 0.77 ± 0.16 0.44 ± 0.20 M = absolute value (in % of wet muscle tissue), TF = relative value (in % of total fat), Fat= total fat content, SFA = saturated fatty acids, MUFA = monounsaturated fatty acids, PUFA = polyunsaturated fatty acids, n-6 PUFA = omega-6 polyunsaturated fatty acids, n-3 PUFA = omega-3 polyunsaturated fatty acids, EPA = eicosapentaenoic acid, DHA = docosahexaenoic acid, n-6/n-3 = ratio between omega-6 and omega-3 polyunsaturated fatty acids, BW = body weight, FC = Fulton’s condition factor, GSI = gonadosomatic index, % hl-Carss = headless carcass yield, % Fill DS = deskinned fillet yield, % Fill = fillet yield
Table 5. Heritability estimates (bold, diagonal, ± standard error (SE)), genetic (above diagonal, ± SE) and phenotypic (below diagonal) correlations among performance traits of 3-year-old common carp
BW FC GSI % hl-Carss % Fill DS % Fill
BW 0.62 ± 0.20* 0.50 ± 0.23 0.22 ± 0.22 0.13 ± 0.23 0.62 ± 0.22 0.50 ± 0.22 FC 0.04 0.23 ± 0.15* 0.21 ± 0.15 0.68 ± 0.17 0.91 ± 0.17 0.82 ± 0.18
GSI –0.02 –0.10 0.27 ± 0.17 0.003 ± 0.17 0.07 ± 0.17 –0.05 ± 0.17
% hl-Carss 0.26 0.09 –0.18 0.41 ± 0.19* 0.78 ± 0.17 0.77 ± 0.16
% Fill DS 0.39 –0.09 –0.01 0.45 0.33 ± 0.19* 0.79 ± 0.15
% Fill 0.31 –0.02 –0.11 0.50 0.84 0.36 ± 0.20*
BW = body weight, FC = Fulton’s condition factor, GSI = gonadosomatic index, % hl-Carss = headless carcass yield, % Fill DS = deskinned fillet yield, % Fill = fillet yield
[image:8.595.64.531.616.718.2]same desirable FA groups as BW and FC (rg = –0.35 to –0.79). Furthermore, GSI was positively correlated with all FAs in absolute values (rg = 0.42–0.68) and as the only trait also with Fat-M (0.80). When looking at genetic correlations be-tween FA groups and slaughtering yields, positive correlations with SFA-TF as well as the n-6/n-3 ratio (rg = 0.34–0.77) were observed. Importantly, negative genetic associations were estimated with some beneficial FA groups in relative values. Op-positely, significant association with Fat-M was not observed.
Correlations among performance traits. Ge-netic and phenotypic correlations among perfor-mance traits are listed in Table 5. Low positive phenotypic correlations were observed between BW and slaughtering yields (0.26–0.39), while they were medium to high among slaughtering yields. A medium positive genetic correlation was ob-served between BW and FC (0.50 ± 0.23), and FC had strongly positive genetic correlations with all slaughtering yields (0.68–0.91). Oppositely, BW was only related to fillet yields traits (0.50–0.62). Besides, the expected positive genetic correlations were found out among slaughtering yields (rg = 0.45–0.84).
DISCUSSION
The present study is a first insight into the genetic variation of FA composition in flesh of market-size common carp. Furthermore, genetic and pheno-typic correlations among the main FA groups and relationships between FA groups and performance traits were studied. It should be stressed that the present results were obtained on a relatively small sample size (158 offspring from 36 sire half-sib families), and thus they should be considered with caution. However, existing data on genetic variability of FA composition in fish generally rely on relatively small datasets, due to the high cost of FA analyses (220 fish from 44 families in Overturf et al. 2013, 514 fish from 154 families in Nguyen et al. 2010, and 416 fish from 48 families in Leaver et al. 2011). Still, we can observe that (1) several heritability estimates of FA composition significantly differ from zero (P < 0.05) and (2) our estimates of heritability for production traits are in the same range as previous results obtained on larger datasets of common carp (Vandeputte
et al. 2004, 2008; Kocour et al. 2007; Prchal et al. 2018). Taking this into account, we may assume that our heritability estimates for some FA profile traits, even if done on a small sample size, are meaningful enough, especially when heritability and genetic correlations estimates are significantly different from zero.
Heritability of traits.In this study, we found significant genetic variation of several FA groups in common carp flesh. Studies on genetic variation of FA profile in fish are scarce, and so far limited to Nile tilapia (Nguyen et al. 2010), Atlantic salmon (Leaver et al. 2011), and rainbow trout (Overturf et al. 2013). Nguyen et al. (2010) did not observe any significant heritability in the main FA groups (SFA, MUFA, PUFA) presented as relative values. Significant heritabilities were observed only for 7 (out of 22) individual fatty acids (e.g. behenic acid: h2 = 0.39, eicosenic acid: h2 = 0.48). Conversely, in Atlantic salmon, Leaver et al. (2011) observed muscle n-3 PUFA (in percentage of total FAs) as a highly heritable trait (h2 = 0.77). Likewise, heritability of total muscle fat was high (0.69). Similarly, Overturf et al. (2013) observed high heritability estimates of EPA and DHA in rainbow trout flesh. We observed significant heritability for n-3 PUFA-TF, EPA-TF, and Fat-M, but lower than those reported above in salmonids. Concerning heritability estimates of total muscle fat content, our observation was in accordance with results by Saillant et al. (2009), Garcia-Celdran et al. (2015), Kause et al. (2016) in other fish species, but lower compared to results by Kocour et al. (2007) and Prchal et al. (2018) in common carp.
would be even more evident. Similar unfavourable genetic correlations of performance traits (growth traits, fillet weight and yield) with EPA and n-3/n-6 ratio were observed in Nile tilapia (Nguyen et al. 2010). Likewise, Leaver et al. (2011) found a nega-tive phenotypic correlation between relanega-tive n-3 PUFAs and final mass in 48 families of Atlantic salmon. Besides, we could also expect a decrease of PUFAs-TF. The quality of flesh regarding lipids would also worsen when selecting for increased muscle fat content or for higher FC. FC seems to be a simple and suitable selection criterion for increased BW as well as edible parts yields, de-spite the expected side effect of slightly increased muscle fat. Similarly, Saillant et al. (2009) observed in European seabass (Dicentrarchus labrax) strong positive genetic correlations of FC with BW and fillet yields. However, in this latter species, FC was only slightly heritable.
An important question is why selection for faster growth, higher edible parts yield or better condition (expressed as FC) may lead to worse flesh quality. There might be one logical explanation – fish with better performance tend to feed more on supple-mental feed, probably due to higher appetite. As the supplemental feed in pond culture is based mainly on grain (wheat, barley, triticale) rich in carbohydrates, the unutilized energy is stored in fish in the form of MUFAs and this makes the FA profile in carp flesh less favourable (Mraz et al. 2012b). Also PUFA n-6/n-3 ratio would get higher than required due to FA composition of the grain (Mraz and Pickova 2011; Markovic et al. 2016). It is well known that the fatty acids profile in the feed significantly affects the composition of fish flesh lipids (Mraz and Pickova 2011; Markovic et al. 2016; Trbovic et al. 2017). Thus, the n-6/n-3 PUFA ratio in flesh being good in this study for human health as lower than 4 (3.29) (Rodriguez et al. 2017) could increase over 4 and this would make the carp flesh of lower quality.
In the traditional rearing conditions of Central Europe, the grain contributes about 50% to the total weight gain of common carp (Horvath et al. 1992; Kocour et al. 2007). The second half of the weight gain comes from natural food (zooplankton and zoobenthos) (Horvath et al. 1992). Ponds under typical Central European management must be looked at as complex ecosystem units in which produced carps compete among each other and with the other animals about the natural food
(Anton-Pardo and Adamek 2015). The question is whether the carp stocks improved by selec-tive breeding would utilize the natural food more effectively than the common stocks in order to keep the components contributing to their weight gain in the ratio 1 : 1 (natural food : supplemental food). Otherwise the fish would require more supplemental feeding and that would lead to above described effects. In the case that the consumers have required the same flesh quality, the present pond management would have had to be modified.
Possible effect of selective breeding on flesh FA profile under modified rearing conditions. Natural food developing in ponds has a better (more n-3 PUFAs) FA profile compared to grain (Markovic et al. 2016; Trbovic et al. 2017). The problem is that the ponds have limited natural food production capacity for stocking densities that are used in common carp pond management, even after fertilizing the ponds with organic material. More intensive fertilization is not practically feasible due to regulations on surface water quality and its protection (Hlavac et al. 2014). So, if we want to keep at least the present flesh meat quality of common carp selected for faster growth and higher fillet yield, produced under semi-intensive pond management conditions, we would have to either decrease the stocking densities (Anton-Pardo and Adamek 2015) or change the strategy of supple-mental feeding (Mraz et al. 2012a, b; Markovic et al. 2016; Trbovic et al. 2017). Decreasing the stocking densities, however, would not bring the producers the expected economic benefit from selective breeding. Thus, the only way is to alter the technology of supplemental feeding and to look for alternative plant components with bet-ter FA profiles that would keep the flesh quality without significant increasing production costs.
± 0.22). However, no significant genetic associa-tions were found (in the relative values) between ALA and EPA (rg = 0.36 ± 0.21) or ALA and DHA (rg = 0.13 ± 0.18). Still, supplemental feeding rich in ALA, e.g. rapeseed, linseed or hempseed, leads to an improved FA profile in carp flesh (Mraz et al. 2012a, b). Such modified diet (or so called finishing feeding) can be used just during the last (or only part of the last) growing season before reaching the market size to keep the FA profile in a favourable range (Mraz et al. 2012a, b). Thus, the above mentioned feeding strategy should not dramatically change the FA profile in the flesh of common carp even when the contribution of supplemental food on weight gain goes beyond 50%. Still, as the contribution of supplemental food will increase and the supplemental food does not contain all required nutrients, it seems that for sustainable selective breeding program the feeding strategy in pond culture may have to change from supplemental food to a complete compound food (Markovic et al. 2016). Then, the carp stocks could positively respond to selection for faster growth while maintaining an appropri-ate flesh quality.
CONCLUSION
Results in this study point to the fact that se-lective breeding for faster growth and/or higher edible part yields under the current Central Eu-ropean carp pond management would very likely negatively affect carp flesh quality with respect to FA composition. Therefore, together with the selective breeding programme, the feeding strategy should be modified in order to enable a positive response to selection while keeping the carp meat as a valuable healthy diet for humans.
REFERENCES
Anton-Pardo M., Adamek Z. (2015): The role of zooplank-ton as food in carp pond farming: a review. Journal of Applied Ichthyology, 31, 7–14.
Chavanne H., Janssen K., Hofherr J., Contini F., Haffray P., Komen H., Nielsen E.E., Bargelloni L. (2016): A com-prehensive survey on selective breeding programs and seed market in the European aquaculture fish industry. Aquaculture International, 24, 1287–1307.
Dupont-Nivet M., Vandeputte M., Chevassus B. (2002): Optimization of factorial mating designs for inference on heritability in fish species. Aquaculture, 204, 361–370. Folch J., Lees M., Stanley G.H.S. (1957): A simple method for the isolation and purification of total lipids from animal tissues. Journal of Biological Chemistry, 226, 497–509.
Fontagne-Dicharry S., Medale F. (2010): Lipids of aquacul-ture fish species and their variation factors. OCL – Oil-seeds and fats, Crops and Lipids, 17, 209–213. (in French) FOSS Analytical AB (2003): Application note 390/revision
2.8/2007: Total Fat Determination Using SoxCap™ 2047 in Combination with Soxtec Extraction Systems. FOSS Analytical AB, Höganäs, Sweden.
Garcia-Celdran M., Ramis G., Manchado M., Estevez A., Afonso J.M., Armero E. (2015): Estimates of heritabili-ties and genetic correlations of carcass quality traits in a reared gilthead sea bream (Sparus aurata L.) population sourced from three broodstocks along the Spanish coasts. Aquaculture, 446, 175–180.
Groeneveld E., Kovac M., Mielenz N. (2008): VCE – User’s Guide and Reference Manual – Version 6.0. Institute of Farm Animal Genetics, Neustadt, Germany. Available at ftp://ftp.tzv.fal.de/pub/vce6/doc/vce6-manual-3.1-A4.pdf (accessed Aug 1, 2010).
Hlavac D., Adamek Z., Hartman P., Masilko J. (2014): Effects of supplementary feeding in carp ponds on discharge water quality: a review. Aquaculture International, 22, 299–320.
Horvath L., Tamas G., Seagrave C. (1992): Carp and Pond Fish Culture including Chinese Herbivorous Species, Pike, Tench, Zander, Wels Catfish and Goldfish. Fishing News Books Ltd., Oxford, UK.
Janssen K., Chavanne H., Berentsen P., Komen H. (2017): Impact of selective breeding on European aquaculture. Aquaculture, 472, 8–16.
Kause A., Kiessling A., Martin S.A.M., Houlihan D., Ruo-honen K. (2016): Genetic improvement of feed conversion ratio via indirect selection against lipid deposition in farmed rainbow trout (Oncorhynchus mykiss Walbaum). British Journal of Nutrition, 116, 1656–1665.
Kocour M., Mauger S., Rodina M., Gela D., Linhart O., Van-deputte M. (2007): Heritability estimates for processing and quality traits in common carp (Cyprinus carpio L.) using a molecular pedigree. Aquaculture, 270, 43–50. Leaver M.J., Taggart J.B., Villeneuve L., Bron J.E., Guy
Madsen P., Jensen J. (2013): DMU Version 6. Available at http:// dmu.agrsci.dk/DMU/Doc/Current/dmuv6_guide.5.2.pdf (accessed Dec 1, 2013).
Markovic Z., Stankovic M., Raskovic B., Dulic Z., Zivic I., Poleksic V. (2016): Comparative analysis of using cereal grains and compound feed in semi-intensive common carp pond production. Aquaculture International, 24, 1699–1723. Mraz J., Pickova J. (2009): Differences between lipid content and composition of different parts of fillets from cross-bred farmed carp (Cyprinus carpio). Fish Physiology and Biochemistry, 35, 615–623.
Mraz J., Pickova J. (2011): Factors influencing fatty acid composition of common carp (Cyprinus carpio) muscle. Neuroendocrinology Letters, 32, 3–8.
Mraz J., Zajic T., Pickova J. (2012a): Culture of common carp (Cyprinus carpio) with defined flesh quality for prevention of cardiovascular diseases using finishing feeding strategy. Neuroendocrinology Letters, 33, 60–67. Mraz J., Machova J., Kozak P., Pickova J. (2012b): Lipid
content and composition in common carp – optimization of n-3 fatty acids in different pond production systems. Journal of Applied Ichthyology, 28, 238–244.
Nguyen N.H., Ponzoni R.W., Yee H.Y., Abu-Bakar K.R., Hamzah A., Khaw H.L. (2010): Quantitative genetic ba-sis of fatty acid composition in the GIFT strain of Nile tilapia (Oreochromis niloticus) selected for high growth. Aquaculture, 309, 66–74.
Overturf K., Welker T., Barrows F., Towner R., Schneider R., LaPatra S. (2013): Variation in rainbow trout, Oncorhyn-chus mykiss, to biosynthesize eicosapentaenoic acid and docosahexaenoic acid when reared on plant oil replace-ment feeds. Journal of the World Aquaculture Society, 44, 326–337.
Pinheiro J.C., Bates D.M. (2000): Mixed-Effects Models in S and S-PLUS. Springer-Verlag, New York, USA. Prchal M., Kause A., Vandeputte M., Gela D., Allamelou
J.M., Girish K., Bestin A., Bugeon J., Zhao J., Kocour M. (2018): The genetics of overwintering performance in two-year old common carp and its relation to perfor-mance until market size. PLoS ONE, 13, e0191624. Rodrigues B.L., da Cruz Silva A.C.V., da Costa M.P., da Silva
F.A., Marsico E.T., Conte-Junior C.A. (2017): Fatty acid profiles of five farmed Brazilian freshwater fish species from different families. PLoS ONE, 12, e0178898. Saillant E., Dupont-Nivet M., Sabourault M., Ha P.,
Lau-reau S., Vidal M.-O., Chatain B. (2009): Genetic variation for carcass quality traits in cultured sea bass (Dicentrar-chus labrax). Aquatic Living Resources, 22, 105–112.
Steffens W. (2016): Aquaculture produces wholesome food: cultured fish as a valuable source of n-3 fatty acids. Aqua-culture International, 24, 787–802.
Tocher D.R. (2010): Fatty acid requirements in ontogeny of marine and freshwater fish. Aquaculture Research, 41, 717–732.
Trbovic D., Zivic I., Stankovic M., Zivic M., Dulic Z., Petronijevic R., Markovic Z. (2017): Dependence of the common carp (Cyprinus carpio L.) fatty acid profile on diet composition in a semi-intensive farming system: tissue and time variability. Aquaculture Research, 48, 3121–3133.
Vandeputte M., Kocour M., Mauger S., Dupont-Nivet M., De Guerry D., Rodina M., Gela D., Vallod D., Chevassus B., Linhart O. (2004): Heritability estimates for growth-related traits using microsatellite parentage assignment in juvenile common carp (Cyprinus carpio L.). Aquaculture, 235, 223–236.
Vandeputte M., Mauger S., Dupont-Nivet M. (2006): An evaluation of allowing for mismatches as a way to manage genotyping errors in parentage assignment by exclusion. Molecular Ecology Resources, 6, 265–267.
Vandeputte M., Kocour M., Mauger S., Rodina M., Lau-nay A., Gela D., Dupont-Nivet M., Hulak M., Linhart O. (2008): Genetic variation for growth at one and two sum-mers of age in the common carp (Cyprinus carpio L.): heritability estimates and response to selection. Aqua-culture, 277, 7–13.
Vandeputte M., Garouste R., Dupont-Nivet M., Haffray P., Vergnet A., Chavanne H., Laureau S., Ron T.B., Pagel-son G., Mazorra C. (2014): Multi-site evaluation of the rearing performances of 5 wild populations of European sea bass (Dicentrarchus labrax). Aquaculture, 424–425, 239–248.
Zajic T., Mraz J., Sampels S., Pickova J. (2013): Fillet quality changes as a result of purging of common carp (Cyprinus carpio L.) with special regard to weight loss and lipid profile. Aquaculture, 400–401, 111–119.
Zheng X., Seiliez I., Hastings N., Tocher D.R., Panserat S., Dickson C., Bergot P., Teale A. (2004): Characterization and comparison of fatty acyl Δ6 desaturase cDNAs from freshwater and marine teleost fish species. Comparative Biochemistry and Physiology Part B: Biochemistry and Molecular Biology, 139, 269–279.