Addressing Useless Test Data in Core-Based System-on-a-Chip Test
Paul. T. Gonciari, Bashir M. Al-Hashimi, and Nicola Nicolici
Paper no. 782
Accepted for publication as a Transaction Brief Paper (TCAD)
Submitted: November 2002, Revised: February 2003, Final manuscript: May 2003Paul T. Gonciari and Bashir M. Al-Hashimi
Electronic Systems Design Group
Department of Electronics and Computer Science
University of Southampton
Southampton SO17 1BJ, U.K.
Tel: +44-23-8059-3119 / +44-23-8059-3249 Fax: +44-23-8059-2901
Email: [email protected], [email protected]
Nicola Nicolici
Computer-Aided Design and Test Research Group
Department of Electrical and Computer Engineering
McMaster University
1280 Main St. W., Hamilton, ON L8S 4K1, Canada
Tel: +1-905-525-9140 ext. 27598 Fax: +1-905-521-2922
Email: [email protected]
Addressing Useless Test Data in Core-Based
System-on-a-Chip Test
Abstract
This paper analyzes the test memory requirements for core-based systems-on-a-chips and identifies
useless test data as one of the contributors to the total amount of test data. The useless test data
com-prises the padding bits necessary to compensate for the difference between the lengths of different chains
in multiple scan chains designs. Although useless test data does not represent any relevant test
informa-tion, it is often unavoidable, and it leads to the trade-off between the test bus width and the volume of test
data in multiple scan chains-based cores. Ultimately this trade-off influences the test access mechanism
design algorithms leading to solutions that have either short test time or low volume of test data.
There-fore, in this paper, a novel test methodology is proposed, which by dividing the wrapper scan chains into
two or more partitions, and by exploiting automated test equipment memory management features
re-duces the useless memory. Extensive experimental results using ISCAS89 and ITC02 benchmark circuits
are provided to analyze the implications of the number of wrapper scan chains in the partition, and the
S2 S1
S3
0 1 0
x x x
1 0 1 0 0 0
x x 1 0 1 0
bit 0 bit 6
Figure 1. Useless test data
1
Introduction
Advances in semiconductor manufacturing technology are triggering new design and test
methodolo-gies which are necessary to cope with the increased chip complexity [1]. For example,
system-on-a-chip (SOC) design using reusable intellectual property (IP) cores is emerging as a new implementation
paradigm. IP cores are pre-designed and pre-verified by core providers, however SOC composition,
design verification and manufacturing test fall into the duties of the system integrator [2]. The latter,
including the test of the cores and of the entire SOC, requires special test access mechanisms (TAMs).
To enable both core reuse and easy test access, the embedded cores are connected to TAMs using
spe-cial interfaces called core wrappers [3]. While the use of core wrappers guarantees high test quality
by facilitating the test of individual cores, it also influences the cost of test. This is because the core
wrapper design influences both the test time and the volume of test data, which are two essential factors
that determine the cost of SOC test.
A common solution to reduce the test time in core-based systems is to use multiple scan chains. Due
to various design constraints (e.g., routing overhead, scan path length) the multiple scan chains are not
always balanced (i.e., not all the scan chains have equal length). In order to reduce on-chip control
when feeding multiple scan chains, the test vectors are augmented with “don’t care” bits to account for
the differences between the scan chains’ lengths. This is exemplified in Figure 1, where for three scan
chains of lengths 3, 6 and 4 the test tools “pad” the scan patterns, with “don’t cares”, to make them of
equal length1. These “don’t cares” are shown as Xs in the figure. Therefore, due to unbalanced scan
chains, the test data comprises useful test data (the scan chain data) and useless test data (the padded
data). For example, based on experimental data, when minimum test time is attained for core Module6
of system p93971, from the ITC02 benchmarks [4], the amount of test data is 9154 2k, of which useful
test data is 5170 6k while useless test data is 3983 6k. Hence, the useless test data represents 44% of
the total amount of test data. Since this useless test data is explicitly allocated within the automatic test
1It should be noted that, unless stated differently, the term scan chain refers to fixed-length scan chain, i.e., the size of the
equipment (ATE) memory, it affects the ATE memory requirements, and it is therefore referred to as
useless memory allocation (UMA). The UMA for one test vector represents the number of bits required
to make the scan chains of equal length.
The volume of test data (VTD) is an emerging concern for testing complex SOCs [2, 5] since it
influ-ences directly the ATE memory requirements, and hence, the cost. A recently advocated solution to the
VTD problem is test data compression. However, the approaches which compress the VTD (e.g., [6–
10]) will inherently compress the useless test data as well. This may adversely influence the compression
ratio obtained by these approaches.
The objective of this paper is to reduce the UMA by exploiting the memory management support of
the new generation ATEs. Memory management support comes with ATEs that implement
“sequencing-per-pin” [11], i.e., the capability of controlling a pin, or a group of pins, individually. The relevant
sequencing-per-pin tester’s feature is the ability to make a larger number of transfers on a group of pins
while others remain unchanged. The minimum number of pins in a group is referred to as pin-group
granularity. For example, if a sequencing-per-pin ATE has 64 pins and the pin-group granularity is 32,
then it can control separately the number of transfers on two groups of 32 pins.
While sequencing-per-pin is an expensive extension for functional testers, the recently advocated
design-for-test (DFT) testers present the same feature, however, with the advantage of reduced cost [12].
This is because, DFT testers do not need all the functional sequencing-per-pin tester’s features “behind”
each pin. In this paper, this ATE feature is referred to as reconfigurable memory pool (RMP) [12]. Note
that this is contrary to conventional ATEs which are capable of performing only sequencing-per-vector –
all the ATE channels transfer data at the same rate. With reference to the previous example, a
sequencing-per-vector ATE will transfer data on all the 64 pins. Throughout the paper “control overhead” will be
used with reference to an ATE with sequencing per vector (i.e., how many groups have to be controlled).
Hence, the greater the number of groups, the greater would be the control overhead on the ATE.
It will be shown in this paper how the UMA problem scales from multiple scan chain designs to core
wrapper designs, and how the UMA can be reduced in core-based SOCs by efficiently exploiting the
memory management capabilities of the new generation ATEs. In the following section the relevant
previous approaches to TAM and core wrapper design, which influence the memory requirements, are
1.1 Previous work
Recently a number of approaches have addressed the core wrapper design [3, 13–15] and the TAM
design [13–21] issues. With respect to core wrapper design, the work in [13] proposes a “test collar”
as a core wrapper for SOC test. While, the method uses variable-width buses for test data and control,
widening these busses may have an negative impact on the routability of the design [13]. Marinissen
et al. [14], proposed a “TestShell” wrapper which is the basis for the IEEE P1500 [22] core wrapper.
The TestShell is scalable and supports the operating modes required by IEEE P1500. Since the initial
approach [14] presents the disadvantage of unbalanced wrapper scan chains (i.e., the scan chains formed
by the internal scan chains and the core’s inputs/ outputs tend to have unequal lengths), heuristics have
been proposed, in [3] and [15], to balance the wrapper scan chains with focus on test time, however,
the VTD has not been addressed. Recently, in [23] reconfigurable core wrapper design, where the core
wrapper can dynamically change between different configuration, has been proposed.
With respect to TAM design, the work in [19] has addressed the TAM design problem for minimizing
test time by considering problem formulations ranging from fixed width test buses to the design of the
entire TAM under given maximum test bus width constraint, using the core wrapper design from [14].
In [20], place and route and the power dissipation constraints were also considered in the TAM design
problem with primary focus on test time minimization. In [15], the approach from [3] was generalized
such that the wrapper design, TAM and test time minimization were combined into a unified problem
formulation. In [21], by managing the number of bridges (e.g., multiplexers, controllable buffers and
bypass routes) between the cores, the TAM was designed for minimum test time and bridge area
over-head. In the context of reconfigurable core wrappers, in [23] the associated TAM algorithms have been
introduced. Based on “TestRail” [14], a flexible test data mechanism, in [24], the TR-ARCHITECT algorithm has been proposed.
Recently, the problem of VTD reduction and TAM design for complex SOCs has been addressed
[25, 26]. In these approaches, the VTD was taken into account in the cost function which drives the
TAM design heuristic. However, as illustrated in [26], targeting test time and VTD minimization will
produce a TAM design which provides a trade-off between the two. This, as will be shown in this paper,
can be also attributed to the inherent trade-off between VTD and TAM width in core wrapper design
1.2 Motivation and contributions
As illustrated in Figure 1, the UMA is a result of the unequal length of the scan chains. While
attempts have been made to equal the scan chains’ lengths [27, 28], these require information about the
core’s internal structure, and they do not take into account the inputs and the outputs of the core. As the
IEEE P1500 standard requires that each core has a wrapper, and, since depending on the business model
the system integrator is often restrained from modifying the core’s internal structure [2], the approaches
[27, 28] may not always be applicable in core-based SOC test. This limitation can be overcome if
reducing UMA is viewed as a byproduct of core wrapper design. While previous core wrapper design
algorithms aimed at minimizing the test time [3], or minimizing the test bus width and the test time [15],
in this paper, core wrapper design is exploited to reduce the UMA. For this purpose a test methodology
is proposed, which based on grouping wrapper scan chains (WSCs) into partitions during core wrapper
design and exploiting ATE memory management features leads to UMA reduction without any on-chip
control overhead. The main contributions of this paper are:
The problem of UMA is introduced in conjunction with core wrapper design and the characteristics
of this new problem are outlined. It is shown that, considering WSC partitioning in the core
wrapper design process can reduce, and even eliminate, the inherent trade-off between test bus
width and VTD, and ultimately between VTD and test time;
A novel test methodology comprising a new core wrapper design algorithm and a new ATE
de-ployment procedure is proposed. The core wrapper design algorithm is capable of finding the
minimum number of WSC partitions such that for each partition the UMA is minimized. The
novel ATE deployment procedure exploits the particularities of the proposed core wrapper design
and deploys test data on each WSC partition as specified by the WSC length;
Extensive experimental results, using ISACS89 [29] and ITC02 [4] benchmark circuits, are
pro-vided to analyze the implications of ATE pin-group granularity and the number of partition on
the proposed methodology. In addition, in order to illustrate the importance of considering WSC
partitioning as part of the core wrapper design process when minimum UMA is targeted, two core
wrapper design algorithms ([3] and [15]) are extended with a post processing WSC partitioning
The remainder of this paper is organized as follows. Section 2, gives background information and
illustrates the problem of UMA in relation with core wrapper design. Section 3 describes the new test
methodology for UMA reduction. Section 4 provides an analysis of the effects of WSC partitioning on
VTD and test time. Sections 5 and 6 provide experimental results and conclusion respectively.
2
Core wrapper design, UMA and the ATE
This section provides a brief overview of core wrapper design, and illustrates the relationship between
WSC partitioning, UMA and the ATE.
Core wrapper design, which is equivalent to constructing WSCs, was shown to be an NP hard
problem [3]. Given a core, the WSCs are composed from the inputs, the outputs and the internal scan
chains. An input/output WSC (W SCi
W SCo) refers to the part of the WSC, which comprises the core’s
inputs/outputs and the internal scan chains. Since there exists a one-to-one association between the
test bus lines and the WSCs, the test time of the core will be a function of the WSC’s length: τ c 1 max wsc
i
wsco nv min wsc
i
wsco [3], where wsci/wscoare the length of the maximum input/
output WSC respectively, and nv is the number of test vectors in the test set for core c. Since the last
member of the above formula has a small influence on the overall test time, for the remainder of this
paper is considered that the test time is a function of only the max wsc
i
wsco .
Exploiting the reconfigurable memory pool (RMP) ATE feature implies dividing the WSCs into
dis-joint partitions such that the ATE can control the number of transfers on each partition. The number of
WSCs in a partition (or the partition’s cardinality), is a multiple of the pin-group granularity. Due to
the one-to-one association between the WSCs and the ATE channels, the number of transfers on each
partition (the depth of the corresponding ATE channels) is given by the length of the maximum WSC
in the partition, also referred throughout the paper as the partition’s length. In addition, while the RMP
feature allows different number of transfers on each partition, the greater the number of partitions, the
more complex is the control on the ATE. Hence, to efficiently exploit the RMP ATE feature, the depth
of the ATE channel, the number of partitions and the pin-group granularity have to be considered.
Having illustrated the link between WSC partitioning and the RMP ATE feature, the following section
exemplifies the relationship between UMA and core wrapper design. Section 2.2 illustrates the control
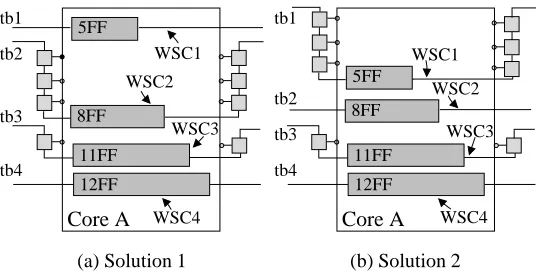
Core A tb2 tb3 tb4 tb1 WSC1 WSC2 WSC3 WSC4 8FF 12FF 11FF 5FF
(a) Solution 1
Core A 5FF 8FF tb1 tb2 tb3 tb4 WSC1 WSC2 WSC3 WSC4 12FF 11FF
[image:8.598.164.432.73.210.2](b) Solution 2
Figure 2. Alternative core wrapper design solutions with equal test time
2.1 UMA and core wrapper design relationship
As noted previously, in order to efficiently exploit the ATE RMP features, the number of partitions
and the pin-group granularity have to be considered. These two are illustrated using Example 1. In
addition, as it will be illustrated in Example 2, the case when the number of outputs are greater than the
number of inputs will also influence the UMA.
Example 1 For a core with 4 inputs, 4 outputs, and 4 internal scan chains of length 5, 8, 11 and 12
respectively, Figure 2 shows two possible core wrappers for a test bus width of 4. Since max wsci wsco
,
for the two core wrapper designs, are equal the two solutions are equivalent with respect to test time.
The four WSCs (W SC1
W SC2, W SC3and W SC4) are marked in Figures 2(a) and 2(b) respectively. The
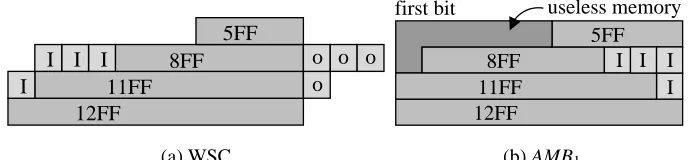
WSCs representation for Figure 2(a) is given in Figure 3(a), and the corresponding ATE memory bitmap
(AMB) is shown in Figure 3(b) – AMB1. The “I”s and “O”s in the WSC representation and AMB, denote
the inputs, respectively the outputs of the core. Because the inputs are loaded last, they are shown at the
end of the memory bitmap. For the second wrapper design, (see Figure 2(b) and its WSC representation
in Figure 4(a)) the AMB is illustrated in Figure 4(b) – AMB2. The main difference between AMB1 and
AMB2 is that the latter could be split into a smaller number of partitions with WSCs of equal length
(i.e., AMB1, has 3 partitions: p1 W SC1
, p2 W SC2
and p3 W SC3
W SC4
, while AMB2 has
2 partitions: p1 W SC1
W SC2
and p2 W SC3
W SC4
). Since conventional ATEs cannot benefit
from WSC partitioning, both core wrappers will have the same memory requirements. For a DFT tester
with RMP, assuming a per-pin granularity (i.e., the group of pins has the cardinality of 1), the UMA
can be eliminated in both cases. However, the control overhead should not be neglected. Analyzing
I I I I 12FF 11FF 8FF 5FF o o o o
(a) WSC 5FF 8FF 11FF 12FF I I I I useless memory first bit
[image:9.598.124.468.77.157.2](b) AMB1
Figure 3. WSC and ATE memory bitmap for Solution 1
12FF 11FF
8FF
o o o o I I I I 5FF (a) WSC I I I I p1 TS 1
TS 2 p2
first bit last bit
12FF 11FF
8FF 5FF
(b) AMB2
Figure 4. WSC and ATE memory bitmap for Solution 2
number of partitions which have to be controlled. In addition, since the number of WSCs differ from
one core to another, the number of obtained partitions varies as well, and thus, the number of parameters
required to characterize the AMB shape are core dependent. In contrast, since AMB2is shaped such that
it can be easily split into two partitions (p1 W SC1
W SC2 and p2 W SC3
W SC4 ) it reduces the
number of parameters required to characterize its shape to 3 (i.e., the length of the longest partition, the
difference between the length of the two partitions and the cardinality of partition p1). Furthermore, if
the test set is divided into two test sets (T S1and T S2, see Figure 4(b)), one for each partition, then the
memory management is very simple and equally applicable to any AMB which has the shape illustrated
in Figure 4(b) (see Section 2.2). Thus, the sought core wrapper design solution is one which reduces the
UMA using a minimum number of partitions. Therefore, it is considered that the first case introduces
the useless memory as illustrated in the figure.
An additional important point is the fact that the partitions are formed from consecutive WSCs. As
illustrated in the above example, p1 W SC1
W SC2 and p2 W SC3
W SC4 . This is justified as
follows. Since the WSCs are connected to the ATE channels, when the partitions are not composed out
of consecutive WSCs the ATE will have to provide an interface, which maps the test data stored in the
ATE memory to the ATE channels corresponding to the correct WSCs. This, will then lead to a core
dependent solution and will require additional ATE control. Therefore, only partitions composed out of
consecutive WSCs are considered.
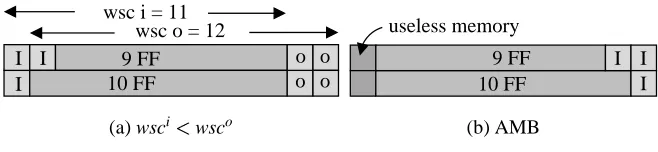
wsc i = 11 wsc o = 12 I
I
I o o
o o 10 FF
9 FF
(a) wsci wsco
I I I useless memory
10 FF 9 FF
[image:10.598.133.462.75.151.2](b) AMB
Figure 5. WSC and memory bitmap whenwsci wsco
4, 8, 16. In the best case scenario per-pin granularity is available, however, if this is not the case, the
pin-group granularity (g) can also affect the UMA. To illustrate this, consider Figure 4(b) where in order
to reduce the UMA, two partitions of size 2 were created. Hence, a tester pin-group granularity smaller
than, or equal to, 2 is required. If the tester pin-group granularity is greater (e.g., 4), then no partitioning
is possible, hence the memory requirements cannot be reduced. Therefore, with the increase in ATE
pin-group granularity, the UMA tends to increase.
It should be noted that for the wrapper designs discussed in this paper, all the partitions are loaded in
parallel using the same clock and the ATE deploys data on the partitions at different moments. This will
be further detailed latter on in this section. Hence, if the number of inputs is greater than, or equal to, the
number of outputs, then the ATE memory will have to account only for the UMA caused by the input
scan chains as explained in Example 1 and Figure 3. However, if the number of inputs is smaller than
the number of outputs, then the wscican be smaller than wscoand, in order to ensure that all the data has
been shifted out from the output WSCs, the ATE memory has to account for the difference between the
wsciand wsco. This is another source of UMA, as explained in the following example.
Example 2 The second source of UMA, caused by the difference in WSC size when wsci
wsco, is
illustrated in Figure 5. Figure 5(a) gives the WSC representation of a core with 3 inputs, 4 outputs
and 2 internal scan chains of length 9 and 10 respectively. An optimum WSC design with respect to
test time, leads to wsci 11 and wsc
o
12. Since the responses have to be unloaded from the output
WSC onto the test bus, the ATE memory has to account for the difference wsco wsci(see Figure 5(b)).
This problem could be easily solved by using the repeat fill feature of some ATEs and adding special
“scan op-codes” to account for the repeat [30]. However, if the number of repeats is not considerable,
then adding the extra scan op-codes does not provide a viable solution [30], as it increases the memory
requirements instead of reducing them. Furthermore, in order to provide a uniform solution for both
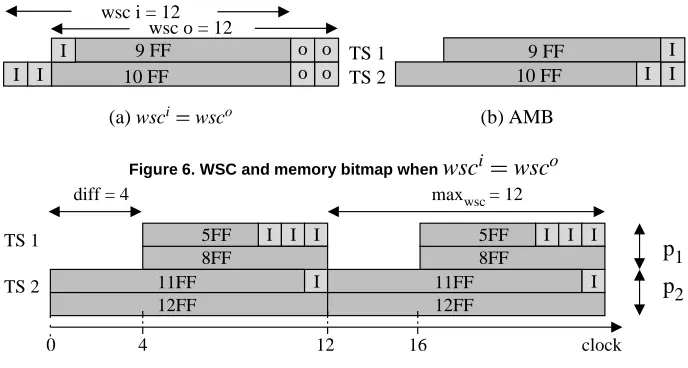
cases, when wsci
wsco and wsci
o o o o I I
I
wsc i = 12 wsc o = 12 9 FF 10 FF
(a) wsci wsco
[image:11.598.126.470.74.258.2]TS 1 TS 2 I I I 9 FF 10 FF (b) AMB
Figure 6. WSC and memory bitmap whenwsci wsc
o I I I I I I I I p1 p2 maxwsc TS 1 TS 2
12 16 clock
4 0
= 12 diff = 4
12FF 11FF 8FF 5FF 12FF 11FF 8FF 5FF
Figure 7. ATE test vector deployment information
the Figure 4(b) is obtained. This can be achieved if the inputs are rearranged such that the length of
the wsciis equal to wsco (see Figure 6(a) and its WSC configuration in Figure 6(b)). In this case, since
there is only one test bus that connects the core under test to the TAM and only one clock is used to
drive all the WSCs, storing the test data for the longest WSC in the ATE memory will be satisfactory
to load/unload the data from all the WSCs in the core under test. Therefore, reducing UMA when the
number of core’s outputs is greater than the number of core’s inputs, requires that the number of outputs
are considered explicitly in the design of the input as well as the output WSCs. It should be noted that
previous core wrapper design algorithms [3, 15] make a clear distinction between the input and output
WSCs design phases. Note that, since the test time is a function of max wsc
i
wsco , considering the
number of outputs to drive the input WSCs construction will not affect the test time.
2.2 UMA and ATE test vector deployment
The UMA reduction, illustrated with Examples 1 and 2, is due to partitioning of the WSCs and
division of the test set according to the WSC partitions. As the length of the two partitions differ, the
ATE will have to account for this difference when deploying the two test sets. This is illustrated next,
for the test sets shown in Figure 4(b). Based on the partitions’ length, the intervals at which the ATE
deploys the test vectors are shown in Figure 7 (di f f 4 is the difference between the length of the
two partitions and maxwsc 12 is the length of the longest partition). For the first 4 clock cycles, the
data is read from test set T S2 and deployed on partition p2. For the remaining maxwsc di f f 8 clock
that having only one clock driving all the WSCs for the first 4 clock cycles the data loaded on the test
bus lines corresponding to partition p1 represents “don’t cares”. This is allowed since valid test data is
required at the input WSCs of p1only after the 4th clock cycle.
Since the core wrapper design is an intermediate step in SOC test, the proposed approach does not
incur any extra overhead. Hence, the modifications on the ATE are the only changes implied by the
proposed approach. This can be achieved at the expense of an external ATE module [31] to support
custom ATE behavior employed when IEEE P1500 compliant SOCs are tested.
3
Novel test methodology for UMA reduction
It was illustrated in the previous section that WSC partitioning in conjunction with the ATE
deploy-ment procedure lead to UMA reduction. In this section a new test methodology is given which comprises
two components: i a core wrapper design which accounts for WSC partitioning and considers the
number of outputs to drive the WSC’s construction; and ii a generic ATE deployment procedure which
exploits the features of the core wrapper design ensuring correct test set deployment. The core wrapper
design is illustrated in Section 3.1 and the ATE deployment procedure is introduced in Section 3.2.
It should be noted that throughout the paper it is assumed that the core test language (CTL) [32],
describing the core test information, contains the scan chains lengths2. In addition, in order to provide
a generic solution to the UMA problem, no specific test pattern information (i.e., the content of the test
patterns) has been considered. When test pattern information is available, the proposed methodology
can be used in conjunction with other solutions to reduce the vector memory, such as ATE repeat fill
[30].
3.1 Wrapper design algorithm for reducing UMA
Prior to providing the new core wrapper design problem, which accounts for UMA, two recently
proposed approaches [3, 15] are analyzed. Since the core wrapper design problem was shown to be
NP hard, several heuristics have been proposed such as: Largest Processing Time (LPT), MultiFit
and Combine in [3], and Best Fit Decreasing (BFD) [15]. Both, the Combine and MultiFit heuristics
2It should be noted that when the scan chains are padded due to reasons other than unequal length scan chains, for
[3] employ the First Fit Decreasing (FFD) heuristic [3] to assign scan chains to WSCs. The FFD [3]
assigns a scan chain to the first WSC which will not lead to an overflow on the maximum WSC capacity.
Hence, it tends to unequally distribute the WSCs lengths, thus leading to UMA. The BFD heuristic
[15] aims to equal all the WSC lengths such that the minimum number of WSCs are used, however,
since test time minimization is the primary design objective, it does not explicitly target the reduction
of UMA. For example, when applied to the core considered in Example 1, both algorithms lead to the
core wrapper design shown in Figure 2(a). Thus, since these heuristics do not target minimum number
of WSC partitions and minimum UMA, they lead to the UMA marked in Figure 3(b). There are two
interesting conclusions described in [3] and [15]: the minimum test time for a core is lower bounded by
the length of the longest WSC, and there exists a range of test bus widths for which the test time does not
change. In addition, as shown in the previous section, there are alternative core wrapper design solutions
which do not incur any penalties in test time but which can be exploited to reduce UMA. The new core
wrapper design problem, when minimum number of partitions, UMA and test time are considered, can
be formulated as follows:
mUMA: Given a core with n inputs, m outputs, s scan chains S1
S2
Ss , and a test bus width
of w, find the minimum number of partitions (np) and a wrapper design for the core such that both test
time and UMA are minimized.
It should be noted that the mUMA problem is NP hard. This can be easily shown by assuming
that the number of partitions equals the test bus width. In this particular case, there is no UMA and
the problem reduces to the core wrapper design problem as presented in [3] and [15], which was shown
to be NP hard. However, as illustrated in Example 1 and as shown later in Section 3.2, the number
of partitions influences the complexity of the ATE program. Hence, finding the minimum number of
partitions is important. Therefore, in the following, a new core wrapper design algorithm is proposed
which accounts for minimum number of WSC partitions, minimum test time and minimum UMA. In
contrast to previous heuristics [3, 15], which always aim at minimizing the test time taking into account
only the number of inputs or only the number outputs for WSC construction, in order to reduce the
UMA, the proposed algorithm uses the number of outputs to drive the design of both the input and the
output WSCs (see Example 2 in Section 2). The proposed heuristic can be divided into two parts, an
Algorithm 1 - mUMA
INPUT: C,w
OUTPUT : W SCi, W SCo
1. for np = 1 to w do 2. set W SCinit
3. while exists partitions P pk do 4. W SC mA(S,P,W SCinit,0)
5. W SCo mA(m,P,WSC,0)
6. if m n then set cap max
W SCo
7. else set cap 0
8. W SCi mA(n,P,WSC,cap)
9. uma = compute_uma(w,W SCi,np)
10. if uma 0 then break
11. else record uma
12. done
13.done
partition such that UMA is minimized. As also justified in the previous section (see Example 1), only
partitions composed from consecutive WSCs are considered.
mUMA heuristic The heuristic illustrated in Algorithm 1 gives an iterative solution to the mUMA problem. The algorithm firstly generates the WSC partitions and secondly it constructs the core wrapper
for the obtained partitions. The algorithm takes as input the core and the test bus width. The partitions
P are generated such that∑npk 1
pk
w where pk P . For example when w 4, the set of iterated
par-titions is P 4
1 3 2 2 3 1 1 1 2 1 2 1 2 1 1 1 1 1
1 . Where the numbers
represent the length of the partition. For example, for np 3 and P 1
1
2 there are three partitions
of length p1 1, p2 1 and p3
2. As also justified in the previous section (see Example 1), for
each P, only the case when the partitions are composed out of consecutive WSCs is considered (e.g.,
p1 1
2 is a valid partition, while p2 1
3 is an invalid partition). This will reduce the search
space and will simplify the ATE test vector deployment procedure, as described in Section 3.2. In
gen-eral for a test bus of w, there are 2w 1
distinct partitions [34]. For each P, an algorithm to generate
the WSCs, called mA (Algorithm 2), is applied to the internal scan chains (step 4), the outputs (step
5) and the inputs (step 8) of core C. If the number of outputs is greater than the number of inputs, the
maximum capacity cap is computed (step 6). This will be used to drive the construction of the input
WSCs, hence contributing to UMA reduction as shown in Example 2 (see Section 2). The U MA for the
newly design wrapper is computed using equation (3). If the UMA is 0 (step 10), the algorithm is halted,
otherwise, the UMA is recorded. When all partitions from set P for a given np have been processed and
no solution with U MA 0 was found, then the number of partitions is increased. The algorithm finishes
Algorithm 2 - mA
INPUT: S, P, W SCinit, cap OUTPUT : WSC
1. sort S descending 2. set W SC W SCinit
3. for all Si
S do 4. set W SCmin min
W SCj 5. set W SCmax max
W SCj 6. for all pk
P do
7. assign Sito first W SCjsuch that umapk
is minimized 8. if Siassigned then break
9. if W SCmax Si cap then assign Sito W SCmaxbreak 10. done
11. if Sinot assigned then assign Sito W SCmin
12. sort WSC
13. done
solution with the minimum UMA and minimum number of partitions is chosen. The UMA is computed
using equation (3) (see Section 4). For the remainder of the paper mU MA np will denote the mUMA
heuristic when applied for np partitions.
Considering the ATE pin-group granularity as a constraint, in the above algorithm, implies filtering
the partitions set P such that each partition’s length is divisible by the ATE pin-group granularity.
Alter-natively, one could generate the partitions P such that each partition’s length is divisible with g.
mA heuristic The Minimum Area (mA) heuristic used to generate the WSC of the core wrapper is illustrated in Algorithm 2. The algorithm assigns the internal scan chain Si to the first wrapper scan
chain W SCj such that the UMA (uma pk ) on partition pk is minimum (step 7) without affecting the
maximum WSC length. The importance of assigning the scan chain to the first WSC will be detailed
in Section 4. The UMA on a partition pk is computed using equation (3) see Section 4. If there is no
such assignment, then if the length of the maximum WSC (W SCmax) added with the current scan chain
Siis smaller than the capacity cap (step 9), then scan chain Siis assigned to W SCmax. This ensures that
wsciand wscowill have close to equal length, hence reducing the UMA as illustrated in Example 2 (see
Section 2). It should be noted that this step is performed only for the inputs, when the internal scan
chains and the outputs are processed the cap 0 (see step 4 and 5 in Algorithm 1). If the scan chain Si
was not assigned to partition pkthen the next partition is chosen. If Siwas not assigned to any partition
(step 11), then it is assigned to the WSC with the minimum length (W SCmin). After every scan chain is
assigned, the WSCs are sorted ascending (step 12).
It is important to note that Algorithm 2 aims at generating a WSC representation like the one given
iterated in reversed order, i.e., firstly partition p2 and then partition p1(see Figure 4), and when the first
WSC assignment is found (step 8 in Algorithm 2) the next scan chain is selected. While alternative
algorithms for designing the core wrapper, aiming at minimum UMA, are possible, care must be taken
to ensure that reducing the trade-off between the UMA and test bus width will not result into a trade-off
between UMA and ATE control.
The complexity of Algorithm 2 is given by Os w s w logw , i.e., in the worst case scenario
there are w partitions, and each scan chain has to be assigned to one; in addition the reordering step
is performed for each assignment. As illustrated in Algorithm 1, the mA algorithm is used first for the
internal scan chains of the core (step 4), then for the outputs (step 5) and then for the inputs (step 8). The
inputs and the outputs are considered as scan chains of length 1. Hence, the complexity of Algorithm 1
is given by O 2
w 1
n m s w 1 log w .
To achieve reduction in memory requirements by exploiting WSC partitioning, ATEs need memory
management support. ATE test vector deployment methods which account for this requirement are
detailed in the following section.
3.2 Test vector deployment procedure for reduced UMA
This section illustrates two possible implementations of the proposed test methodology when different
ATE features are considered. Firstly, an ATE test vector deployment procedure is given for the particular
case of np 2 partitions, and secondly, the “Split Timing Mode” architecture is examined [35].
In order to fully exploit the new core wrapper design, the initial test set is divided into a number of
test sets equal to the number of partitions. The ATE program will have to deploy test vectors from the
different test sets at separate times. Hence, the increase in the number of partitions will lead to a more
complex ATE program (see Example 1 in Section 2). However, if the number of partitions is limited to
2 the changes on the ATE are minor. The pseudo-code for the ATE program for this particular case is
discussed in the following.
Consider two partitions p1 and p2 with the maximum WSC length for the two partitions wscp1 and wscp2 respectively. Since
p1
p2
w (this is how the partitions are constructed, see Section 3.1)
and wscp2
wscp
1 (the WSCs are ordered ascending after each iteration in the mA heuristic, see
Algorithm 2 – step 12), lets define maxwsc wscp
2 the maximum WSC, di f f maxwsc wscp
Procedure 3- test vector deployment
INPUT: maxwsc,di f f ,sp,nv,w,T S1,T S2
1.while (nv 0) do
2. for i = 0 to maxwscdo
3. if i di f f then 4. load
1sp ReadMemT S1 nv di f f
isp 5. load
spw ReadMemT S2
nv maxwsc
iw sp 6. done
7. dec nv
8.done
difference between the length of the two partitions, and sp
p1
the split point. Using this information,
the initial test set can be divided into two sets. The deployment of test vectors at different intervals
can be easily achieved by supplying the ATE, in addition to the two test sets (T S1and T S2), with three
parameters maxwsc, di f f and sp. The pseudo-code for a simple ATE procedure which accounts for the
mentioned parameters is shown in Procedure 3. The procedure takes as inputs the two test sets (T S1and
T S2), the width of the test bus (w), the number of patterns (nv), and the three parameters: maxwsc, di f f ,
and sp. ReadMem T Si
o f f set
length denotes a procedure which reads a word of length bits from the
test set (T Si) from the position indicated by o f f set, and loada b denotes the loading of data on the
ATE channels between a b. The procedure is detailed next.
For maxwsc clock cycles, the test data from T S2 is loaded onto the test bus. Since the first partition
is smaller than the second one, the ATE will read the test data for T S1 only after di f f clock cycles. It
should be noted that since all the WSCs are driven by the same clock, the data loaded into the WSCs
corresponding to the first partition represents don’t cares for the first di f f clock cycles. This is allowed
since valid test data is required in this partition only after di f f clock cycles (see Example 1 in Section 2).
It is important to note that the three parameters suffice to characterize any core wrapper designed with
mUMA for np 2. In Section 5 is shown that even though for np 2 the UMA is not always 0, the
particular case leads to a good solution from the UMA standpoint, at the benefit of simplifying extra
ATE requirements.
The three parameters provide the benefit of independence between the test control and the test data,
which is also the view put forth by the CTL [32] developed in parallel with the IEEE P1500 standard.
For a given core and it’s CTL description, after core wrapper design, using two WSC partitions, the
initial core can be seen as two virtually independent cores with their own CTL description. One case
in which the above scenario can be used is detailed below for the case when the Split Timing Mode
test. The basic idea behind this architecture is to configure a tester as two independent virtual test
systems using the same master clock [35], but providing data to the chip under test at two different
frequencies. The feature of interest in the investigated scenario is the fact that each virtual test system
has its own memory and pattern generator [35]. This feature can be exploited, in the case of the proposed
approach, as follows. When the difference (di f f ) between the two partition’s length is considerable, the
test set corresponding to the shorter partition can be augmented with scan op-codes for repeat fill [30].
These will, then, automatically generate the padded data for the shorter partition. Hence, the test vector
deployment procedure is no longer needed as the deployment information is already included within the
first test set.
4
Analyzing wrapper scan chain partitioning trade-offs
Having illustrated the proposed test methodology, in this section a theoretical analysis of WSC
parti-tioning is given and the WSC partiparti-tioning, VTD and test time trade-offs are examined.
4.1 Theoretical analysis
Consider that W SCjrepresents the length of the WSC corresponding to test bus line j, and w represents
the test bus width. Similar to multiple scan chain designs, WSCs also have different lengths, hence,
the memory depth of the corresponding ATE channels will also differ. As illustrated in Figure 1 (see
Section 1) for multiple scan chain cores, the UMA for one test vector represents the number of bits
required to make the scan chains of equal length. For wrapped cores (i.e., cores for which the WSCs
have already been determined) this translates into:
U MAw w max
j 1 w
W SCj
w
∑
j 1
W SCj (1)
i.e., the number of bits required to equal the WSCs for a given test bus width. Basically, it is the
difference between the maximum and the minimum memory requirements.
If, however, the WSCs are partitioned into np disjoint partitions p1
p2
pnp , the UMA on a
partition pkis given by:
uma pk
pk
max
j
pk
W SCj
∑
j
pk
i.e., the number of bits required to equal the WSCs from a given partition. Hence, the total UMA is:
U MAw
np
np
∑
k 1
uma pk
np
∑
k 1
pk max j pk
W SCj
w
∑
j 1
W SCj (3)
Starting with an initial ad-hoc partitioning with np partitions, the number of partitions can be further
increased through: i iterative partitioning – when one of the partitions is further divided; or ii
repar-titioning – when a new parrepar-titioning with more partitions, independent of the existing one, is performed.
With respect to iterative partitioning, the following lemma holds.
Lemma 1 For a wrapped core of test bus w and np disjunctive partitions such that ∑npk
1
pk
w, iterative partitioning will reduce the memory requirements.
Proof: The proof derives immediately from the fact that uma pk
uma p
k uma p
k when pkis split
into pk
and pk
through iterative partitioning.
Hence, when iterative partitioning is performed, then U MAw
np
U MA w
np 1
U MAw
np
2
U MAw
w 0. Note that the above relation also holds when repartitioning is done such that
minimum UMA is obtained on each partition. If repartitioning is done ad-hoc, increasing the number of
partitions may not necessarily lead to a reduction in UMA. It should be noted that the proposed mUMA
heuristic performs repartitioning and aims at selecting the solution with minimum UMA. Hence, the
above relation holds for the proposed mUMA heuristic as also illustrated in the following section.
4.2 Volume of test data and test application time trade-offs
As illustrated with equation (1) in Section 4.1, the memory requirements are dependent on the test
bus width. This implies that there is a trade-off between the VTD and test bus width, and consequently,
there is a trade-off between the VTD and test time. These trade-offs are analysed next.
The trade-off between VTD and test bus width is illustrated in Figure 8, where the memory
require-ments for mUMA with np 1
2 and 3 (see Figure 8(a)), and the test time (see Figure 8(b)) when the test
bus width is varied between 1 and 31 are given for Module26 of SOC p22810 from the ITC02
bench-mark circuits [4]. As can be seen in Figure 8(a), for np 1 with the increase in test bus width, there
is a variation of up to 1000k in the memory requirements. Hence, the trade-off between test bus width
2000k 2200k 2400k 2600k 2800k 3000k 3200k
0 5 10 15 20 25 30 35
Memory requirements
Bus width mUMA(1)
mUMA(2) mUMA(3)
(a) Memory requirements vs. Bus width
0 1000 2000 3000 4000 5000 6000
0 5 10 15 20 25 30 35
Test application time
Bus width
[image:20.598.58.535.78.263.2](b) Test application time vs. Bus width
Figure 8. Trade-off between test application time and memory requirements for core Module26 of SOC p22810 [4]
trade-off between the VTD and the test bus width is reduced for np 2, and eliminated in most of the
cases for np 3, as can be seen in the figure. In order to keep the figure simple, the plot for np 4 is
not shown. In this case however, there is no more trade-off between test bus width and VTD. It can be
seen in Figure 8(b), that the test time steadily decreases with the increase in test bus width. However,
due to the trade-off between the test bus width and the VTD, for np 1, there is a trade-off between the
VTD and the test time. Since, increasing np leads to reducing the trade-off between the test bus width
and the VTD, it also leads to reducing the trade-off between the VTD and the test time. It is interesting
to note that the reduction in the variation of volume of test data is considerable when the number of
partitions increases from np 1 to np 2. When np
2, the reduction is small. Therefore, while using
the number of partitions as a constraint can diminish the effectiveness of the proposed algorithm, as long
as at least two partitions are allowed, the UMA reduction can be significant. From the above example,
the following can be derived:
Observation 1 Minimizing the memory requirements and minimizing the test time can be viewed as
orthogonal problems if WSC partitioning is considered with the core wrapper design.
Thus, if the RMP feature is available, using WSC partitioning in the core wrapper design will allow
simultaneous reduction in both test time and ATE memory requirements. Hence, considering WSC
partitioning could also reduce the trade-off between test time and VTD in TAM designs.
Next, the relation between the test time obtained using the proposed core wrapper design and the one
Test time (clock cycles)
Method w 4 8 16 24 32
BFD[15] 535807 278641 145417 133405 72981
[image:21.598.160.437.72.132.2]mUMA(2) 535807 278641 145417 133405 72981
Table 1. Test time comparison for Module26 p22810 [4]
Observation 2 For a given test bus width w, the core wrapper designs obtained with the mUMA
heuris-tic for np 1 and np w are identical with the ones obtained using the BFD [15] heuristic when n
m.
This observation is justified by the following. The BFD [15] heuristic tries to equalize the WSCs by
assigning a scan chain to the WSC such that the length of the resulting WSC is closest to the maximum
WSC length. Hence, it tries to exploit “horizontally” the scan chain to WSC assignment process. This
is done to yield a minimum bus width core wrapper3. The mUMA heuristic (Algorithm 1) exploits both
“vertically” and “horizontally” the scan chain to WSC assignment process, i.e., it tries to minimize the
difference between the maximum and the minimum memory requirements for a partition (see equation
(2)). As shown in Algorithm 2 (step 7), a scan chain is assigned to the first WSC such that UMA is
minimized without an overrun on the maximum WSC. However, considering only 1 partition the UMA
will be the same regardless of the WSC to which the scan chain is assigned. Since, after each run the
WSC are sorted (see Algorithm 2 – step 12), assigning a scan chain to the first WSC such that no overrun
on the maximum WSC occurs, is equivalent to assigning a scan chain to a WSC such that the length of
the resulting WSC is closest to the maximum WSC length. The latter being the strategy used in BFD
[15]. Therefore, mUMA with np 1 and BFD [15] will generate the same core wrapper. The same
reasoning is applicable for np w. In this case, there is no UMA. Hence, assigning a scan chain to the first WSC such that no overrun on the maximum WSC occurs will yield the same core wrapper design
as the BFD [15] heuristic. Note that when n
m and np 1 or np w, the test time yielded by mUMA
will equal the one given by BFD, since the output WSCs are constructed in the same manner.
It is important to note that, in general the values for the length of the maximum WSC, which influence
directly the test time of the core, are comparable to the ones obtained by the BFD heuristic [15]. This
is because, in both approaches, the scan chains are assigned to WSCs such that the current maximum
WSC length is never exceeded. For the case illustrated in Figure 8, Table 1 gives the test time for the
BFD heuristic [15] and the mUMA(2) for different test bus widths. It can be observed from the table
3It should be noted that in some cases, the FFD[15] WSC assignment heuristic obtains the same maximum WSC using a
that they are equal. Therefore, considering WSC partitioning in the core wrapper design algorithm has
small or no penalty in test time at the great benefit of significant reduction in memory requirements as it
will be shown in Section 5.
5
Experimental results
The experimental analysis has been performed on a Pentium II 366 MHz Linux workstation with 128
Mb of RAM using the largest ISCAS89 [29] and ITC02 [4] benchmark circuits. Exploiting wrapper scan
chain (WSC) partitioning for reducing useless test data requires ATE with reconfigurable memory pool
(RMP). As illustrated with Lemma 1, the UMA can be reduced by increasing the number of partitions,
however, this will then increase the control overhead on the ATE. In addition, the ATE pin-group
granu-larity may also influence the effectiveness of WSC partitioning. Using the cores’ specifications detailed
in Section 5.1, the above issues are investigated with the following three experiments:
Experiment 1 illustrates the trade-off between ATE control overhead and UMA through a comparison
between the general case and the particular case of two partitions, for the mUMA algorithm, in
Section 5.2;
Experiment 2 outlines the effectiveness of the proposed methodology, in terms of memory
require-ments, when compared to conventional ATEs (with sequencing-per-vector), in Section 5.3;
Experiment 3 investigates the influence of the pin-group granularity on the performances of the
pro-posed mUMA and the importance of considering WSC partitioning within the core wrapper design
algorithm, in Section 5.4.
It should be noted that for the first two experiments a per-pin granularity is assumed.
5.1 Core specifications
For the ISCAS89 benchmark circuits, we considered the specifications as given in Table 2. The table
lists the circuit, the number of inputs/outputs (n/m), the number of internal scan chains (s), the total
number of internal scan cells (F Fs), the number of test vectors (nv) and the minimum memory required
Core n m s FFs nv mem wmax TAT
s5378 35/49 4 179 97 20758 6 4507
s9234 36/39 4 211 105 25935 5 5723
s13207 62/152 16 638 233 163100 20 9593
s15850 77/150 16 534 94 57434 21 3324
s35932 35/320 32 1728 12 21156 38 714
s38417 28/106 32 1636 68 113152 34 3656
[image:23.598.88.502.67.386.2]s38584 38/304 32 1426 110 161040 39 5105
Table 2. Core specification for ISCAS89 [29] benchmarks
Core n m q s FFs minsc maxsc nv mem wmax TAT
SOC p22810
Module1 28/56/32 10 1122 110/113 785 927870 11 102965
Module21 115/76/64 10 1054 93/186 465 578925 12 87141
Module26 66/33/98 31 11485 198/400 181 2108469 32 72981
SOC p34392
Module2 165/263/0 29 8856 8/570 514 4636794 30 294064
Module10 129/207/0 19 4731 16/519 454 2206440 20 236599
Module18 175/212/0 14 6555 198/729 745 5013850 15 544579
SOC p93791
Module6 417/324/72 46 23789 500/521 218 5292604 47 114317
Module20 136/12/72 44 7450 132/181 210 3185728 46 75893
[image:23.598.92.498.198.386.2]Module27 30/7/72 46 3026 50/68 916 2865248 49 63272
Table 3. Core specification for ITC02 [4] benchmarks
chosen to be as equal as possible. For example, for core s5378, three scan chains are of length 45, and
one is of length 44. For each circuit, wmax represents an upper bound on the test bus width considered
in the experiments. In order to ensure that the entire solution space is explored, with respect to core
wrapper design, the values for wmax have been computed using the formula4wmax
max n m ∑ s i 1
Si
1 s∑ s iSi
.
It should be noted that wmax, as computed above, will guarantee minimum test time, however, it will not
always represent the minimum test bus width for which the minimum test time is obtained. The test time
given in the table is obtained for wmax as computed above.
From the ITC02 benchmark circuits [4] we considered the systems p22810, p34392 and p93791.
While all the ITC02 benchmark systems have been taken into account in our experiments, only these
three are reported as they better exemplify the variation in memory requirements. This is mainly due
to the large number of scan chains and the scan chain length distribution. It should be noted, however,
that the results for the other systems are within the range of the reported results in this section. For each
4It should be noted that the formula given in [15] for w
mUMA mUMA for np 2
Core wmax P mem UMA Et P mem UMA Et
s5378 6 2-4 20758 0 0.01 2-4 20758 0 0.01
s9234 5 1-4 25935 0 0.02 1-4 25935 0 0.02
s13207 20 4-16 163100 0 0.13 4-16 163100 0 0.13
s15850 21 3-1-17 57434 0 0.31 3-18 57528 94 0.17
s35932 38 1-5-32 21156 0 0.85 6-32 21168 12 0.79
s38417 34 2-32 113152 0 0.19 2-32 113152 0 0.19
[image:24.598.68.518.88.416.2]s38584 39 4-3-32 161040 0 2.01 7-32 161480 440 0.76
Table 4. mUMA forwmaxwith ISCAS89 [29] benchmark circuits
mUMA mUMA for np 2
Core wmax P mem UMA Et P mem UMA Et
SOC p22810
Module1 11 1-6-4 927870 0 0.04 10-1 973400 45530 0.04
Module21 12 1-1-7-3 573345 0 0.09 11-1 638910 65565 0.05
Module26 32 1-3-6-22 2108469 0 0.86 10-22 2197340 88871 0.11
SOC p34392
Module2 30 7-8-15 4636794 0 0.44 14-16 4687680 50886 0.42
Module10 20 9-3-5-3 2206440 0 1.23 9-11 2591886 385446 0.20
Module18 15 1-3-6-2-1-1-1 5013850 0 4.13 5-10 5431050 417200 0.08
SOC p93791
Module6 47 1-46 5292604 0 0.09 1-46 5292604 0 0.09
Module20 46 1-6-16-23 3185728 0 2.57 8-38 3303872 118144 0.35
Module27 49 3-46 2865248 0 0.08 3-46 2865248 0 0.08
Table 5. mUMA forwmaxwith ITC02 [4] benchmark circuits
system, the three modules with the largest memory requirements were considered. The specifications
for the circuits used in our experiments are given in Table 3, the detailed specification can be found at
[4]. In addition to the information given for the cores in Table 2, in Table 3 the number of bidirectional
pins (q) is given as well. It should be noted that, for the core wrapper design, the bidirectional pins (q)
were added to both inputs and outputs as suggested in [3].
5.2 Experiment 1: Trade-off between ATE control and minimum UMA
As illustrated in Section 2, the number of partitions affects the UMA and at the same time influences
the control required on the ATE. In this experiment the performances of the mUMA heuristic for the
general case and the particular case of np 2 partitions are compared.
For the two benchmark sets ISCAS89 (see Table 2) and ITC02 (see Table 3), the results are reported
in Table 4 and Table 5 respectively. The tables list the length of the partitions, the memory requirements,
[image:24.598.69.522.211.415.2]bus width of wmax, for both: the general case (columns 3 – 6), and for the particular case with only two
partitions (column 7 – 10). It is interesting to note that even though for two partitions the UMA is not
zero in all of the cases, it is still very small. For example, in the case of core s38584 (see Table 4),
the increase is 0 27%, while in the case of Module26 from SOC p22810 (see Table 5) the increase is
4 04%. On average, the increase in memory requirements for the particular case of np 2 is of less than
5%. This justifies the usage of the proposed heuristic for the particular case with two partitions, since
minimum or close to minimum memory requirements are obtained with minor changes on the ATE (see
Section 3.2). The execution time (Et) is insignificant, e.g., for the general case it is up to 4 seconds and
for the particular case of two partitions it is under 1 second. Having shown that the particular case of
two partitions yields minimum or close to minimum UMA, for the remainder of the experiments this
particular case will be considered for further comparisons. In the following the overall performance of
the proposed test methodology is compared with the case when a conventional ATE is used.
5.3 Experiment 2: UMA(np 2) vs. conventional ATE
Although based on Lemma 1 (see Section 4.1), the VTD can be reduced when partitioning is
consid-ered, it is interesting to know how much reduction can be obtained. For this purpose a conventional ATE,
and an ATE with RMP are considered. For the former, two core wrapper designs (First Fit Decreasing
(FFD) [3], Best Fit Decreasing (BFD) [15]) have been used, while for the latter the mU MA2 has been
employed. To provide a common ground for the comparison it has been imposed that for all the cases
the test time is the same and the test bus has been varied between 4 and wmax. As noted in Observation 2,
BFD [15] and mU MA 1 obtain the same test time. In addition, for the performed experiments, it was
found that the test time obtained using mU MA 2 will equal the test time obtained using BFD. This
can be explained by the fact that both approaches assign the scan chains to WSCs such that the current
maximum WSC length is never exceeded. Therefore, there are no test time penalties when compared to
[15]. To also ensure that the test time obtained with FFD [3] equals to the one obtained with BFD, the
FFD algorithm was used considering the capacity given by the maximum WSC determined with BFD. It
should be noted that, although this might give the impression of a disadvantage with respect to [3], it will
actually lead to reduction in memory requirements when employing the FFD heuristics and comparing
FFD [3] BFD [15] mUMA for np 2
Core Min Max Avg Min Max Avg Min Max Avg
s5378 22116 26190 23457 22116 26190 23457 20758 20855 20782
s9234 26250 33075 27972 26250 33075 27972 25935 25935 25935
s13207 184070 272610 193367 184070 272610 198693 163100 165430 163394
s15850 64296 68244 65638 64296 93060 68593 57434 57998 57552
s35932 24576 25920 24728 24576 40176 27542 21156 22656 21470
s38417 118456 124848 122675 118456 215016 142889 113152 116416 113714
[image:26.598.67.522.71.198.2]s38584 190300 242000 201674 190300 300080 209569 161040 173800 163891
Table 6. Memory requirements comparison for ISCAS89 [29]
time as the FFD heuristic. Hence, discarding the empty WSCs for the core wrapper design produced
by FFD, will reduce the memory requirements. It is important to note that, due to the variation of w
between 4 and wmax, the entire core wrapper design solution space is explored and therefore the test time
can be considered as a reference point in the comparison.
As illustrated in Section 4.2 for different test bus widths there are different memory requirements.
Therefore, the three core wrapper designs have been employed when w has been varied between 4 and
wmax(w 4
wmax), and their minimum (Min), maximum (Max) and average (Avg) memory requirements
over all TAM widths have been computed. It should be noted that for mU MA2 for each test bus width
the two WSC partition solution which leads to minimum UMA has been chosen. The results are reported
for the three core wrapper design methods in the case of ISCAS89 benchmarks circuits [29] in Table 6,
and in the case of ITC02 benchmarks circuits [4] in Table 7. In the case of the ISCAS89 benchmark
circuits, for the FFD and BFD approaches, the minimum, maximum, and average memory requirements
over all test bus widths are given in columns 2 – 4 and 5 – 7 in Table 6 respectively. The results for
mU MA 2 are reported in columns 8 – 10 in the same table. Note that the difference between Max and Min is considerably greater in the case of the FFD and BFD methods than in the case of the proposed
core wrapper design algorithm. For example, for core s13207, in the case of both FFD and BFD, the
maximum memory requirements are 32 47% greater than the minimum memory requirements, hence,
the trade-off between VTD and test bus width. This is contrary to the proposed approach where the
increase is only 1 42%, which leads to the trade-off reduction. Based on the information provided in
Table 6, also the reduction in minimum, maximum and average memory requirements over the two
previous approaches, FFD and BFD, can be determined. For example, in the case of circuit s38584, the
maximum memory requirement is reduced by 28 18% when compared to FFD and by 42 08% when
FFD[3] BFD[15] mUMA for np 2
Core Min Max Avg Min Max Avg Min Max Avg
SOC p22810
Module1 949850 1208900 1081555 949850 1554300 1150722 927870 973400 939208
Module21 573345 778410 679272 573345 1037880 731166 573345 638910 581668
Module26 2130732 3134196 2475259 2130732 3179808 2583195 2108469 2238789 2154835
SOC p34392
Module2 4687680 8145872 5065690 4687680 8789400 6289267 4636794 4687680 4645587
Module10 2241852 2591886 2499572 2241852 4712520 3088637 2206440 2591886 2391470
Module18 5071215 5585265 5331621 5071215 8146575 5958280 5013850 5431050 5177406
SOC p93791
Module6 5294784 9374000 6160277 5294784 9810000 6796421 5292604 5301760 5293839
Module20 3186144 5002400 3761074 3186144 5031936 3897730 3185728 3303872 3199796
[image:27.598.51.566.71.270.2]Module27 2865248 4653280 3387231 2865248 4787016 3524378 2865248 2883568 2868756
Table 7. Memory requirements comparison for ITC02 benchmarks circuits [4]
to FFD and 21 80% when compared to BFD. Overall, the proposed test methodology achieves average
and maximum memory requirement reduction of up to 22 05% and 45 86% respectively.
For the ITC02 benchmarks circuits [4], the results are reported in Table 7. Once again, note the
difference between Max and Min in the case of the FFD and BFD methods. For example, for core
Module20 from SOC p93691, in the case of FFD (columns 2 – 4 in Table 7) the maximum memory
re-quirements are 36 30% greater than the minimum memory rere-quirements. Similarly, for BFD (columns
5 – 7 in Table 7), the maximum memory requirements are 36 68% greater than the minimum memory
requirements. Hence, the trade-off between the test bus width and the memory requirements. When the
reduction in minimum, maximum and average memory requirements over the two previous approaches,
FFD and BFD, are analyzed, considerable reduction in maximum and average memory requirements
can be observed. For example, in the case of core Module27 from SOC p93691, the maximum
mem-ory requirements are reduced by 38 03% and 39 76% when compared to the two previous approaches
(FFD and BFD) The reduction in average memory requirements over all test bus widths is 15 31% and
18 60% when compared to the FFD and BFD heuristics. Overall, the reduction in maximum memory
requirements is up to 46 67%, while the reduction in average memory requirements is up to 26 13%.
Based on the above results, it can be clearly seen that considering the ATE memory requirement
during core wrapper design reduces the trade-off between test bus width and memory requirements and
3.00 M 3.10 M 3.20 M 3.30 M 3.40 M 3.50 M 3.60 M
8 12 16 20 24 28 32 36 40 44
Memory requirements
Bus width mUMA(2) mUMA4(2)
FFD4
BFD4
(a) Module20 of SOC p93791 [4] with g 4
2.70 M 2.80 M 2.90 M 3.00 M 3.10 M 3.20 M 3.30 M
8 12 16 20 24 28 32 36 40 44 48
Memory requirements
Bus width mUMA(2)
mUMA4(2)
FFD4
BFD4
(b) Module 27 of SOC p93791 [4] with g 4
3.00 M 3.10 M 3.20 M 3.30 M 3.40 M 3.50 M 3.60 M 3.70 M 3.80 M
16 24 32 40
Memory requirements
Bus width
mUMA(2) mUMA8(2)
FFD8
BFD8
(c) Module20 of SOC p93791 [4] with g 8
2.70 M 2.80 M 2.90 M 3.00 M 3.10 M 3.20 M 3.30 M 3.40 M
16 24 32 40 48
Memory requirements
Bus width
mUMA(2) mUMA8(2)
FFD8
BFD8
(d) Module 27 of SOC p93791 [4] with g 8
Figure 9. ATE pin-group granularity and WSC partitioning
5.4 Experiment 3: ATE pin-group granularity constrained WSC partitioning
In this section two issues are investigated. Firstly, the implications of the pin-group granularity on
the performances of the proposed mUMA, and secondly, the importance of considering WSC
parti-tioning within the core wrapper design algorithm. It should be noted that in the framework of the
proposed test methodology, WSC partitioning has been considered as a step within the core wrapper
design algorithm. However, WSC partitioning could be also seen as a post processing step. To
pro-vide a comparison for these two cases, WSC partitioning has been considered as a post processing
step for the FFD [3] and the BFD [15] heuristics. WSC partitioning has been implemented on top of
the experimental setup illustrated in Section 5.3 as follows. For a given test bus (w), granularity (g)
and np 2, there are
w
g
![Figure 8. Trade-off between test application time and memory requirements for core Module26 of SOC p22810 [4]](https://thumb-us.123doks.com/thumbv2/123dok_us/1009558.615724/20.598.58.535.78.263/figure-trade-test-application-time-memory-requirements-module.webp)
![Table 1. Test time comparison for Module26 p22810 [4]](https://thumb-us.123doks.com/thumbv2/123dok_us/1009558.615724/21.598.160.437.72.132/table-test-time-comparison-module-p.webp)
![Table 2. Core specification for ISCAS89 [29] benchmarks� maxsc](https://thumb-us.123doks.com/thumbv2/123dok_us/1009558.615724/23.598.88.502.67.386/table-core-specication-iscas-benchmarks-maxsc.webp)
![Table 4. mUMA for wmax with ISCAS89 [29] benchmark circuits](https://thumb-us.123doks.com/thumbv2/123dok_us/1009558.615724/24.598.69.522.211.415/table-muma-wmax-iscas-benchmark-circuits.webp)
![Table 6. Memory requirements comparison for ISCAS89 [29]](https://thumb-us.123doks.com/thumbv2/123dok_us/1009558.615724/26.598.67.522.71.198/table-memory-requirements-comparison-for-iscas.webp)
![Table 7. Memory requirements comparison for ITC02 benchmarks circuits [4]](https://thumb-us.123doks.com/thumbv2/123dok_us/1009558.615724/27.598.51.566.71.270/table-memory-requirements-comparison-itc-benchmarks-circuits.webp)