Health, lifestyle and health care utilization among health
professionals
Paul A. Bourne1*,Lilleth V. Glen1, Hazel Laws1, Maureen D. Kerr-Campbell2
1Department of Community Health and Psychiatry, University of the West Indies, Kingston, Jamaica; *Corresponding Author
2Systems Development Unit, Main Library, University of the West Indies, Kingston, Jamaica
Received 2 February 2010; revised 22 February 2010; accepted 26 February 2010.
ABSTRACT
Health care workers are responsible for the ex-ecution of the health policy of a nation, yet little if any empirical evidence is there on health, lifestyle, health choices, and health conditions of health care workers in the rural parish of Hanover, Jamaica. The current study examines health, lifestyle and health behaviour among health professional in Hanover. The current study has a sample of 212 respondents. A 26- item questionnaire was used to collect the data. Data from the questionnaires were coded and entered into a micro-computer and analysis done using SPSS for Widows Version 15.0 soft- ware. The Chi-square test was used to test as-sociation between non-metric variables. A p- value < 0.05 (two-tailed) was selected to indicate statistical significance. It was found that 16.0% of respondents had diabetes mellitus (2.8% of males compared to 19.8% females); 22.6% had hypertension (25.5% of female and 12.8% of males); 0.5% breast cancer; 0.5% stomach cancer; 1.9% enlarged heart; and 0.5% ischemic heart disease. Forty-three percentage points of the sample was overweight, 33.5% obese and 24.1% had a normal weight. Over 15% of nurses and doctors were obese compared to 38% of ancillary staffers. Twenty percentage points of respondents consume alcohol on a regular ba-sis; 15.6% do no regular physical exercise, 42.4% add sweetening to their hot beverages, and 4.7% were smokers. There is a need for public health practitioners to formulate a health intervention programme that will target people in Hanover, but also specific groups such as doctors, nurses, administrative, ancillary sta- ffers and technical staffers.
Keywords:Health Care Workers; Health; Lifestyle; Health Choices; Health Behaviour; Hanover; Jamaica
1. INTRODUCTION
Empirically, it is well established that poverty and illness are positive associated with each other and that 80% of all chronic illnesses were in low-to-middle income countries [1-3]. Sen [1] encapsulated this well when he stated that low levels of unemployment in the economy is associated with higher levels of capabilities, suggest-ing that poverty predisposed people to illnesses. The World health organization (WHO) [2] reported that 60% of global mortality is caused by chronic illness and four-fifths of chronic dysfunctions are in low-to-middle income countries. This concurs with Sen’s finding that poverty does not only predisposed people to illnesses but that it accounts for premature mortality.
In many developing countries, the living standards of low income households could be improved by improving health services [4]. The lack of resources available for use by the government of Jamaica to address poverty in a significant way negatively impacts health care. There is a significant statistical correlation between poverty and illnesses in Jamaica [5,6]. A study by Bourne [5] found: 1) a positive correlation between not seeking
medical care and poverty (r2 = 0.58), 2) a positive
corre-lation between poverty and unemployment (r2 = 0.48),
and 3) an inverse correlation between mortality and
po-verty (r2 = 0.51). These findings do not substantiate the
peri-urban residents (13.9%).
Although premature mortality was empirically not found using the data for Jamaica, the positive correlation between poverty and illness is present and cannot be overlooked as there are public health challenges owing to this reality. Jamaica an English-speaking Caribbean nation is a developing country. In 2007, it had a popula-tion of 2,682,120 people (49.3% males); 75% black and 13% mixed; a growth rate of 0.47; 10.9% elderly
popu-lation (i.e., 60+ year old); a crude death rate of 6.4 per
1,000; crude birth rate of 17.0 per 1,000 [8]; income inequality of 0.4 (Gini coefficient); and 71.3% of the poor lived in rural areas [7]. The country is geographical divided into 14 parishes and three counties (Cornwall, Middlesex and Surrey). Cornwall covers the Western belt which includes parishes such as Westmoreland, Ha-nover, St. James and St. Elizabeth. Middlesex constitutes the middle proportions of the island with parishes such as Clarendon and St. Catherine. Surrey comprises the Eastern region with parishes such as Kingston, St. Tho-mas and Portland. Cities accounts for 27.3% of the pop-ulation, peri-urban 30.2% and rural areas, 42.5% in 2007.
With 43 out of every 100 Jamaicans resided in rural areas and those areas have 15.3% of the poverty, public health policy makers are concerned about health care and behaviour among rural residents. Hanover has the smallest percent of the nation’s population (2.6%—
69,660, in 2007), with one urban centre (i.e., Lucea) [9].
Lucea, the capital of Hanover is home to about 5,951 people. The parish of Hanover therefore is substantially rural, and the people rely on tourism, agriculture and seasonal employment for their economic livelihood. Al-though Hanover is rural and shares many of the eco-nomic challenges of rural zones, little if no information is available about health, lifestyle practices and health care seeking behaviour of the residents. Since public health agencies relies on research information to make inform decision that can effectively aid in improving the health of a population, then it follows that pertinent in-formation is needed on residents of Hanover in order to enhance public health capability on the parish. Most if not all the health information on Hanover is from the Ministry of Health (MOH) which only produce standard curative statistics (i.e., health service utilization; mortal-ity; health care expenditure; health care resources; mor-bidity) [10-12]. The findings from this study will add value to the existing literature by examining health in-formation on persons in the parish. This was done by examining health, lifestyle and health behaviour among health professional in Hanover in order to understanding choices, decision and health among its residents, with the purpose of aiding policy formulation and health in-tervention programmes for the parish.
2. MATERIALS AND METHODS
2.1. Sample, Sampling Methods and Setting We selected a representative sample of people from Ha-nover’s health institutions, which had sufficient num- bers to represent the people of the parish. The MOH in Jamaica sub-divided the country into 4 regional adminis-trative authorities (RHAs): the South-East (SERHA); South (SRHA); North-East (NERHA), and Western (WRHA). The NERHA covers four parishes—Hanover, Westmoreland, St. James and Trelawny. Another classi-fication of the island is statistical one based on Enume-ration Districts (EDs). The Planning Institute of Jamaica (PIOJ) and Statistical Institute of Jamaica (STATIN) used Primary Sampling Units (PSUs) as its sampling frame from which it design surveys of the national pop-ulation [7]. A PSU is an ED or a composition of EDs, usually consisting of 100 dwellings in a rural area and 150 dwellings in urban areas [7]. STATIN further refined required dwellings by stating that up to 400 households constituted a PSU [9]. The EDs are independent geo-graphical units which share common boun- daries with contiguous EDs. In keeping with a sampling error of ± 3% and a confidence interval of 95%, the calculated population for selection was 280 respondents. In another survey, the researchers used 36 persons per ED to calcu-late a representative sample of the nation [13,14]. Ha-nover has 4 PSUs, which means that using 36 persons per ED the sample should be 144. Hence, based on pre-vious surveys, the current study is sufficient to general-ize on the parish because it is has representative sample size [13,14]. The current sample of 212 respondents represents 0.3% of the population of the parish of Ha-nover (in 2007; n = 69,660). For this study, the sample was stratified by area of work, area of residence, and a Kish Random Selection Method of sub-sampling was used to select the actual respondents thereby facilitating independence of response [15]. On occasions when an individual was selected and could not participate, no other person was used to replace the individual. In cases where the selected person was not available a minimum of three call-back visits would be made to that person’s place of work. The response rate was 75.7%, of which 1.3% of the data were lost during data cleaning. This is in keeping with surveys conducted by PIOJ and STATIN
[7], and Wilks et al. [14]. For the survey study 77.8% of
the sample was female, which is similar to that reported
by Wilks et al. [14] in which the female sample was
75.9%.
Test-retest reliability of the questionnaire was conducted
for a month (i.e., February 2008) prior to the main study.
The instrument was vetted by academics from the Uni-versity of the West Indies, Mona, Jamaica. Then 20
res-pondents who were non-participants (i.e., health
profes-sional in Westmoreland Health Services) in the main study were interviewed on two separate occasions ap-proximately 7 days apart. The reliabilities were deter-mined by the percentage of agreement. Modifications were made to the final instrument based on the recom-mendations, queries and issues raised by the participants in order to attain clarity and conciseness of questions.
A 26-item questionnaire was used to collect the data. The instrument was sub-divided into general demo-graphic profile of the sample; family history; health seeking behaviour; chronic illnesses, perception on prostate examination and choice of method in prostate examination.
2.3. Measure
Regional Health Authorities: Decentralization of public
health care the shifted the central government (i.e., MOH)
into four semi-autonomous regional bodies: South-East, North-East, Western, and Southern.
Standardized instruments were used to record partici-pant’s weight (in kilograms) and height (in squared me-tres). The body mass index (BMI) is the weight in kg
divided by height in m2. The classification of the World
Health Organization was used in this study. The BMI was classified as normal, overweight and obese.
Normal BMI is defined as 18.5 kg/m2 to 24.99 kg/m2.
Overweight BMI is defined as 25.00 kg/m2 to 29.00
kg/m2 and obese BMI is defined as ≥ 30.00 kg/m2. Risky
behaviour denotes unhealthy health choices such as
smoking, alcohol consumption, infrequent exercise, poor dietary habit and food choices. The participants’ health status was measured using BMI categorization.
Technical staffers include trained personnel such as dental nurses, health educators, nutritionists and public health inspectors, contact investigators, pharmacists, and lab technicians.
The technical support staff comprises community health-aides, psychiatric aides, ward assistants, porters, mosquito spray men and community peer educators. Administrative staffers constitute administrator, parish manager, personnel officer, and matron. The administra-tive support staff comprises accountants, security per-sonnel, medical records officers, secretaries, drivers, telephone operators; cashiers and clerks. The ancillary staffers are cleaners, cooks and gardeners.
2.4. Data Analysis
The data were double entered using SPSS, verified and
cleaned. Data was stored, retrieved and analyzed, using SPSS for Windows (16.0). Percentages were used to provide background information on demographic cha-racteristics on sample, knowledge of prostate and self- reported information on prostate. Chi-square tests were utilized to examine whether statistical associations ex-isted between non-metric dependent and independent
variables. A p-value of 5% (i.e., 95% confidence interval)
will be used to determine statistical associations between variables.
2.5. Ethics
This study sought and was granted ethical approval by the University of the West Indies, Mona, Ethics Com-mittee. All participants gave written consent, and they were informed of procedures and the choice of with-drawal at any time convenient to them if they so desire. The data received from the participants is reported below.
3. RESULTS
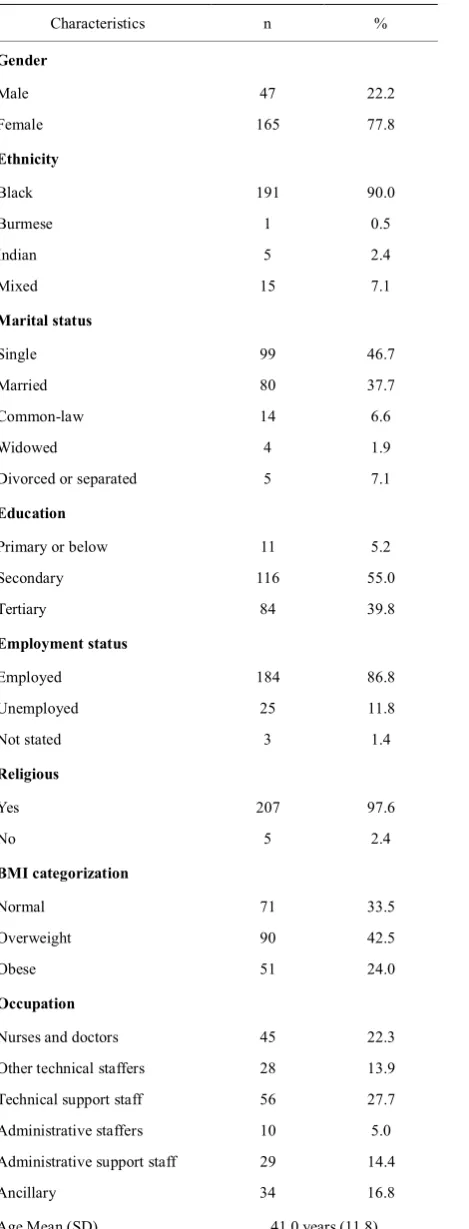
A sample of 212 respondents was interviewed for this study: females, 77.8%; blacks, 90%; single, 46.7%; ter-tiary level education, 39.8%; full-time employed, 86.8%; religious, 97.6%; nurses and doctors comprised of 22.3%
of the sample (Table 1). Forty-seven percentage points
of the sample were Seventh Day Adventist and Pente-costal members; 42.5% were overweight, 33.5% obese and 24.1% had a normal weight.
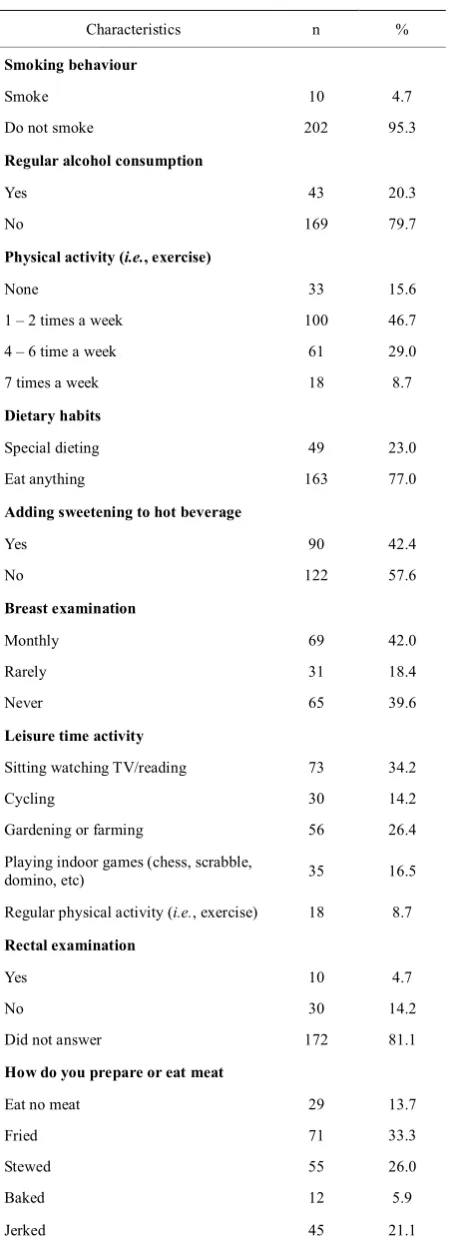
In Table 2 which reports information on particular self-reported diagnosed health conditions, 16.0% of res-pondents had diabetes mellitus; 22.6% had hypertension; 0.5% breast cancer; 0.5% stomach cancer; 1.9% en-larged heart and 0.5% ischemic heart disease.
In Table 3 which reports information on the lifestyle behaviour of respondents, 20.3% of respondents con-sumed alcohol on a regular basis; 15.6% do no regular physical exercise, 42.4% add sweetening to their hot beverages, and 4.7% were smokers.
A significant statistical relationship exists between BMI categorisation and occupation of the persons in the study (P < 0.01). Just over 15% of nurses and medical doctors were obese compared to 38.2% of ancillary
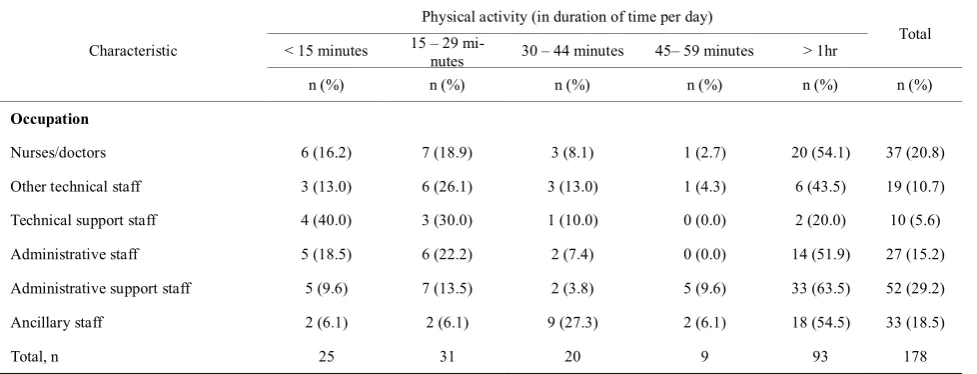
staf-fers (Table 4). In Table 5, of the 178 respondents who
indicated that they do some form of physical activity per week over the survey period, 52.3% spent at least one hour on the activity. Of the different typology of occupa-tion, technical support staff had the lowest percentage points of engagement for at least one hour (20.0%); with administrative support staff recorded the greatest en-gagement of 1 hour or more in physical activity (63.5%). On disaggregating the aforementioned demographic,
Characteristics n %
Gender
Male 47 22.2
Female 165 77.8
Ethnicity
Black 191 90.0
Burmese 1 0.5
Indian 5 2.4
Mixed 15 7.1
Marital status
Single 99 46.7
Married 80 37.7
Common-law 14 6.6
Widowed 4 1.9
Divorced or separated 5 7.1
Education
Primary or below 11 5.2
Secondary 116 55.0
Tertiary 84 39.8
Employment status
Employed 184 86.8
Unemployed 25 11.8
Not stated 3 1.4
Religious
Yes 207 97.6
No 5 2.4
BMI categorization
Normal 71 33.5
Overweight 90 42.5
Obese 51 24.0
Occupation
Nurses and doctors 45 22.3
Other technical staffers 28 13.9
Technical support staff 56 27.7
Administrative staffers 10 5.0
Administrative support staff 29 14.4
Ancillary 34 16.8
[image:4.595.62.544.74.707.2]Age Mean (SD) 41.0 years (11.8)
Table 2. Self-reported diagnosed chronic health conditions.
Characteristics n %
Diabetes mellitus
Yes 34 16.0
No 178 84.0
Hypertension
Yes 48 22.6
No 164 77.4
Cancer Breast
Yes 1 0.5
No 211 99.5
Stomach
Yes 1 0.5
No 211 99.5
Enlarged heart
Yes 4 1.9
No 208 98.1
Ischemic heart disease
Yes 1 0.5
No 211 99.5
health and lifestyle characteristic of the sample, 2.8% of those with diabetes mellitus were males compared to 19.8% females. Of the diagnosed diabetics, the majority were ancillary staffers (36.4%); 45.5% were 40 to 49
years old; and 36.4% were 31 to 45 years old (χ2 =
10.577, P < 0.005).
Of the 22.6% of the sample who had hypertension, 25.5% were female and 12.8% were males. The highest percentage points of the sample that had hypertension were 31 to 45 years old (47.9%), 27.1% were at least 45 years old, and 6.3% were unable to recall the age when they were first diagnosed with hypertension. When oc-cupation of respondents was disaggregated by diagnosed hypertensive cases, technical staffers recorded the high percentage points of cases (33.9%) followed by ancillary staffers (32.4%); nurses and medical doctors (22.2%); administrative staffers (20.0%) and administrative
sup-port staff (13.8%) (χ2 = 15.375, P < 0.0001).
Concur-rently, a statistical relationship existed between over-weight respondents and hypertensive respondents (P < 0.0001).
No significant statistical association was found
be-tween BMI categorisation and gender of respondents (χ2
= 3.793, P = 0.150). However, a significant relationship
[image:4.595.65.300.77.692.2]Characteristics n %
Smoking behaviour
Smoke 10 4.7
Do not smoke 202 95.3
Regular alcohol consumption
Yes 43 20.3
No 169 79.7
Physical activity (i.e., exercise)
None 33 15.6
1 – 2 times a week 100 46.7
4 – 6 time a week 61 29.0
7 times a week 18 8.7
Dietary habits
Special dieting 49 23.0
Eat anything 163 77.0
Adding sweetening to hot beverage
Yes 90 42.4
No 122 57.6
Breast examination
Monthly 69 42.0
Rarely 31 18.4
Never 65 39.6
Leisure time activity
Sitting watching TV/reading 73 34.2
Cycling 30 14.2
Gardening or farming 56 26.4
Playing indoor games (chess, scrabble,
domino, etc) 35 16.5
Regular physical activity (i.e., exercise) 18 8.7
Rectal examination
Yes 10 4.7
No 30 14.2
Did not answer 172 81.1
How do you prepare or eat meat
Eat no meat 29 13.7
Fried 71 33.3
Stewed 55 26.0
Baked 12 5.9
[image:5.595.61.287.74.694.2]Jerked 45 21.1
Table 4. BMI categorisation by occupation.
Occupation
BMI categorisation Normal Overweight Obese
% % %
Nurses/doctors 33.3 57.1 15.6
Other technical staff 46.4 42.9 10.7
Technical support staff 28.6 37.5 33.9
Administrative staff 50.0 40.0 10.0
Administrative support staff 41.4 44.8 13.8
Ancillary staff 20.6 41.2 38.2
P < 0.01
existed between BMI categorisation and self-reported diagnosed health condition (P < 0.0001). Disaggregated the smoker cohort revealed that 57.1% consumed be-tween 1 to 9 cigarettes per day, and that males were more likely to be smokers (57.1%) than females (42.9%).
Significant more males regularly consume alcohol (12.6%) than females (9.1%) (P < 0.0001). However, more females (47.9%) than males (13.3%) indicated that they were regularly engaged in physical activities (or exercise). The age cohort that indicated the most en-gagement in physical activity was 60+ year olds (67.1%). Of the 60+ year olds who are engaged in regular physi-cal activities, 13.7% indicated that they do so every day over the survey period. The percentage of other age co-horts and their engagement in physical activities were 50 to 59 years (59.1%); 30 to 39 years (56.5%) and 40 to 49 years (54.5%).
Of the 34.2% who indicated sitting watching televi-sion or reading as their leisure activities, 65% did this on a daily basis and 18% between 4 to 6 times per week. Furthermore, 43% of overweight respondents were en-gaged in sitting and watching television or reading as their leisure activities compared to 32% of those who were obese. Concurrently, 17% of females were engaged in sitting and watching television or reading as their lei-sure activities compared to 8.3% of males. Forty-three percent of overweight respondents were 40- 49 years old and 24.1% of the obese were in this age cohort.
Table 5. Physical activity (in duration of time per day) by occupation.
Characteristic
Physical activity (in duration of time per day)
Total < 15 minutes 15 – 29 mi-nutes 30 – 44 minutes 45– 59 minutes > 1hr
n (%) n (%) n (%) n (%) n (%) n (%)
Occupation
Nurses/doctors 6 (16.2) 7 (18.9) 3 (8.1) 1 (2.7) 20 (54.1) 37 (20.8)
Other technical staff 3 (13.0) 6 (26.1) 3 (13.0) 1 (4.3) 6 (43.5) 19 (10.7)
Technical support staff 4 (40.0) 3 (30.0) 1 (10.0) 0 (0.0) 2 (20.0) 10 (5.6)
Administrative staff 5 (18.5) 6 (22.2) 2 (7.4) 0 (0.0) 14 (51.9) 27 (15.2)
Administrative support staff 5 (9.6) 7 (13.5) 2 (3.8) 5 (9.6) 33 (63.5) 52 (29.2)
Ancillary staff 2 (6.1) 2 (6.1) 9 (27.3) 2 (6.1) 18 (54.5) 33 (18.5)
Total, n 25 31 20 9 93 178
well as the those 20-29 years (31.3%). Ancillary workers were most likely to consume fried meats (68%) com-pared to any other occupational group. Twenty five per-cent of the same had fruit juice (17.5% had it 2-3 times daily; 11.3% had it occasionally), and 49.5% had soda (57.1% had it occasionally; 14.3% daily and 1.9% 6 days per week). Twenty nine percent had vegetables daily, 23% 2-3 times per week and 0.5% never had vegetables.
On general health care-seeking behaviour, 28% of female respondents indicated having visited a health care provider in the last 6 months for breast examination. There was no significant statistical association between breast examination and occupation (P > 0.05); BMI (P > 0.05) and health conditions (P > 0.05). The majority of the females had done a pap smear (75%). Of those who indicated that they had not done a pap smear, the highest were among administrative staff (42.9%) followed by other technical staff (35.7%); administrative support staff (31.2%) and the least by technical support staff (12.2%). Forty percent of female have not done a breast examination compared to 62.9% of males who had never had a rectal examination. A significant relationship ex-isted between rectal examination and occupational type (P < 0.0001). The percentage points of males who had never done a rectal examination by occupational type can be disaggregated as technical support staff, 87.5%; administrative support staff, 60.1%; other technical staff, 55.6%. Furthermore, the highest number of males who had not done a rectal examination was among those 50 to 59 years old (69.2%).
4. DISCUSSIONS
This study examined the lifestyle, health and the use of health care services of some health care workers in the parish of Hanover, Jamaica. Generally, the health status of people who are employed to health institutions in Hanover is good, but when this was disaggregated into occupational types more information was revealed that indicated worrying signs for health care in the future. Using BMI categorisation to measure health status, the findings revealed that 34% of employees were classified as having normal weight, 43% overweight and 24% ob-ese. Apart from the afore-mentioned findings, 16.0% had diabetes mellitus, 22.6% hypertension, 0.5% breast can-cer, 0.5% stomach cancan-cer, 1.9% enlarged heart and 0.5% ischemic heart disease. Concurrently, 22% of men had done a rectal examination for prostate cancer, 60% of women had done a breast examination, 77% indicated that they eat every and/or anything, 42% added swee-tening to their hot beverage, 5% were smokers and 16% do no physical activities and 34% indicated that their leisure time was spent sitting watching television and/or reading. The disaggregation of BMI by occupation re-vealed that most doctors and nurses were at least over-weight (73%); other technical staff (54%); technical support staff (71%) and those in the ancillary categoriza-tion were most likely to be in the overweight category (79%).
population, disaggregating the figures by sexes revealed a remarkable difference. In the current study diabetes mellitus disparity between the sexes was 7.1 times (males, 2.8%; females, 19.8%) compared to 1.8 times in the national survey. With respect to hypertension, there was no difference between the percentage of those with diabetes in the country and health workers in Hanover. There are no available statistics on diabetes mellitus and hypertension by occupational type in the literature, and therefore the findings from this study provides this val-uable information. The findings showed that hyperten-sion was not greater among females than males; but it was also highest among those 31-45 years and among technical support as well as ancillary staffers. Both tech-nical support and ancillary staffers are among the poor, which concurs with the literature that poverty is asso-ciated with more illness as concur by the findings of this study [2,15-17].
This study highlighted that there was no statistical as-sociation between gender and BMI categorization, how-ever one existed for BMI and self-reported diagnosed health condition. Low socioeconomic status is empiri-cally established as having more people with illness, but the current study further shows that they were more likely to be obese than those who are more likely to be in the middle-to-upper class. The study also revealed that 34% of those in the technical support staff and 38% of those in ancillary staff category were obese and these persons are in the low socioeconomic status compared to 16% of medical doctors and nurse who are mid-dle-to-upper class individuals. Despite this finding, it can be inferred that the schedules of medical doctors and nurses in addition to their and lifestyle may account for a significant percent of them being at least overweight. This has implications for the future of the health sectors as overweight and obesity are associated with increased risk of morbidities and mortalities.
The sedentary lifestyle of health care professionals in Hanover may lead to a public health problem which may become worse in the future if not addressed. The health behaviour of the persons in the study is also a cause for concern and although their lifestyle is a sedentary one, they make more unhealthy lifestyle choices than healthy ones. It is clear from the findings that education, knowledge of health and health care are not influencing the decision of health care providers in Hanover. The findings concur with a study which showed that non-communicable diseases are largely apart of the life-style of Jamaicans, and that 50% of deaths were owing to non-communicable diseases such as heart, stroke, diabetes mellitus, cancers and obesity [18]. A study in by O’Connell and Gray [19] found that four-fifths of those with stroke had high blood pressure when they were
taken to hospital for treatment post-stroke, and that two-thirds of them had a history of hypertension. A later
study by Woo et al. [8] found that untreated
hyperten-sion was a significant risk of hemorrhagic stroke (i.e.,
OR = 3.5, 95% CI = 2.3, 5.2; P < 0.0001), and that treated hypertension was significantly lower in causing
hemorrhagic (OR = 1.4, 95% CI = 1.0 to 1.9; P = 0.03).
The WHO revealed that obesity was associated with health problems such as respiratory difficulties, chronic musculoskeletal problems, skin problems and infertility [20], indicating the pending public health challenge in the health sectors in Hanover.
In 2000, the Jamaica Lifestyle Survey revealed that 8% of Jamaican had diabetes mellitus (96.1% of males and 9.1% of females) and that the most cases were
among the elderly (i.e., 60 + years) [21], which reiterate
the health problem challenge that Hanover faces and speaks to the role of culture and low socioeconomic sta-tus influencing the healthy lifestyle choices of residents in Hanover. Morrison [22] in an article entitled ‘Diabetes and hypertension: Twin Trouble’ showed that diabetes mellitus and hypertension have now become the two major chronic non-communicable diseases thus health problems for Jamaicans and in the wider Caribbean. This finding was also corroborated by Callender [23] who found that there is a positive association between
di-abetic and hypertensive patients (i.e., 50% of individuals
with diabetes had a history of hypertension), which em-phasizes the public health problem of unhealthy health workers in Hanover.
When the sedentary lifestyle, unhealthy lifestyle choices, and low socioeconomic status are coupled with the fact that the sample is relatively middle-aged to old
(i.e., mean age was 41.0 years), it was observed that with
the increased risk of morbidities and disabilities asso-ciated with ageing, the health of individuals in this study becomes exacerbated by the unhealthy diet, alcohol consumption, lack of exercise and sedentary lifestyle. While the prevalence of smokers among residents and health workers in Hanover (4.7%) are lower than the national figures (17.7%), the percentage points of male smokers in this was 2.3 times more than the prevalence in the national (24.8%) and this was 5.9 times more fe-males in this sample compared to the national figures (7.1%).
why some health care workers particularly the profes-sionals who have years of education, knowledge, expe-rience and training become engaged in unhealthy life-style practices. Once the reasons for the poor lifelife-style choices of health care workers that affect their health are understood, further research is necessary on the content and procedures that are required for a strategic and ef-fective national health literacy communication pro-gramme. This programme should be cognizant of the fact that education and knowledge about health does not automatically influence the educated knowledge holders’ behavior in a positive way. There is also need for re-search on how training and wellness programme for health care workers on the job including medical doctors and nurses would influence the choices they make about their health.
5. CONCLUSIONS
The current study has revealed pertinent information on the perception of health care workers about healthy life-style, health choices and general perception of residents in Hanover on their health. Smoking, obesity, over-weight, high cholesterol, sedentary lifestyle, unhealthy lifestyle practices and low socioeconomic status in-creased the risk of cardiovascular diseases in health workers in Hanover and this is further complicated by hypertension, diabetes mellitus and unhealthy choices. The level of health education is greater among health workers than non-health care workers which indicate that the pending health problems in Hanover would have been understated by the current study. There is a need for public health practitioners to formulate a health inter-vention programme that will target people in Hanover including specific groups such as medical doctors, nurses, administrative, ancillary staffers and technical staffers in health care institution in the parish of Hanover. Clearly education and knowledge of health do not lead to better and healthier choices by health care workers in Hanover, and this could be a general social dilemma as the general populace may be left to use home remedy if premature mortality were to befall those high risk health workers in Hanover. Then, there is reality of an increase burden of health care workers in Hanover on the health care services in the future, which would increase health care expenditure for the country.
REFERENCES
[1] Sen, A. (1979) Poverty: An ordinal approach to mea-surement. Econometricia, 44(2), 219-231.
[2] World Health Organization (2005) Preventing chronic
diseases a vital investment. Geneva.
[3] Emerson, E. (2009) Relative child poverty, income in-equality, wealth, and health. Journal of the American Medical Association, 301(4), 425-426.
[4] Mitra, A. and Tsujita, Y. (2009) Health-Poverty nexus: A study of low income households in India. International Journal of Child and Adolescent Health, 2(1), 99-107. [5] Bourne, P.A. (2009) Impact of poverty, not seeking
medical care, unemployment, inflation, self-reported ill-ness, health insurance on mortality in Jamaica. North American Journal of Medical Sciences, 1(3), 99-109. [6] Levy, H. (1996) They cry ‘Respect’: Urban violence and
poverty in Jamaica. The Centre for Population, Commu-nity and Social Change, University of the West Indies, Kingston.
[7] Planning Institute of Jamaica and Statistical Institute of Jamaica (2007) Jamaica survey of living conditions. Kingston.
[8] Woo, D., Haverbusch, M., Seka r, P., Kissela, B., Khoury, J., Schneider, A., Kleindorfer, D., Szaflarski, J., Pancioli, A., Jauch, E., Moomaw, C., Sauerbeck, L., Gebel, J. and Broderick J. (2004) Effect of untreated hypertension on hemorrhagic stroke. Stroke, 35(7), 1703-1708.
[9] Statistical Institute of Jamaica (2008) Demographic sta-tistics, 2001, 2007. Kingston.
[10] Ministry of Health (2005-2008) Annual report, 2004- 2007. Policy, Planning and Development Division, King-ston.
[11] Ward, E. and Grant, A. (2005) Epidemiological prolife of selected health conditions and services in Jamaica, 1990- 2002. Health Promotion and Protection Division, Minis-try of Health, Kingston.
[12] Pan American Health Organization (2007) Health in the Americas. Countries, 2, Washington DC.
[13] Ataman, S.L., Cooper, R., Rotimi, C., McGee, D., Oso- timehin, B., Kadiri, S., Kingue, S., Muna, W., Fraser, H., Forrester, T. and Wilks, R. (1996) Standardization of blood pressure measurement in a international compara-tive study. Journal of Clinical Epidemiology, 49(8), 869- 877.
[14] Wilks, R., Younger, N., Mullings, J., Zohoori, N., Figue-roa, P., Tulloch-Reid, M., Ferguson, T., Walters, C., Ben-nett, F., Forrester, T., Ward, E. and Ashley, D. (2007) Factors affecting study efficiency and item non-response in health surveys in developing countries: The Jamaica national healthy lifestyle survey. BMC Med Research Methodology,7(13), 1-14.
[15] List, J. (2006) Illness, poverty and the invisible patient.
American Medical Association Journal of Ethics, Virtual Mentor, 8(11), 705-708.
[16] Link, B.G. and Phelan, J.C. (1995) Social conditions as fundamental cause of disease. Journal of Health and So-cial Behavior, 36(Special Issue), 80-94.
[17] Foster, A. (1994) Poverty and illness in low-income rural areas. American Economic Review, 84(2), 216-220. [18] Ministry of Health (2004) National policy for the
promo-tion of healthy lifestyle in Jamaica. Health Promopromo-tion and Protection Division, Kingston.
[20] World Health Organization (2003) Obesity and overweight.
Geneva.
[21] Ministry of Health (2004) National policy for the promo-tion of healthy lifestyle in Jamaica. Health Promopromo-tion
and Protection Division, Kingston.
[22] Morrison, E. (2000) Diabetes and hypertension: Twin trouble. Cajanus, 33(2), 61-63.