Copyright © 2011 SciRes. Openly accessible athttp://www.scirp.org/journal/SCD/
Analysis of proteomic profiling of mouse embryonic
stem cells derived from fertilized, parthenogenetic and
androgenetic blastocysts
Xiang-Shun Cui1, Xing-Hui Shen2, Chang-Kwon Lee3, Yong-Kook Kang4, Teruhiko Wakayama5, Nam-Hyung Kim1,*
1Department of Animal Science, Chungbuk National University, Cheongju, Chungbuk, Korea
2Department of Histology and Embryology, Harbin Medical University, Harbin, Heilongjiang Province, China 3Department of Physiology, Konkuk University, Chungju City, Chungbuk, Korea
4Laboratory of Development and Differentiation, Korea Research Institute of Bioscience and Biotechnology, Daejeon, South Korea 5Center for Developmental Biology, RIKEN Kobe, Kobe, Japan; nhkim@chungbuk.ac.kr
Received January 23 2011; revised March 13 2011; accepted March 20 2011.
ABSTRACT
Embryonic stem cells (ESCs) are derived from the inner cell mass (ICM) of preimplantation embryos. ESCs exhibit true pluripotency, i.e., the ability to differentiate into cells of all three germ layers in the developing embryo. We used 2-DE MALDI-TOF/TOF to identify differentially expressed proteins among three types of mouse embryonic stem cells (ESCs) derived from fer-tilized, parthenogenetic, and androgenetic (fESC, pESC and aESC, respectively) blastocysts. We detected more than 800 proteins on silver- stained gels of whole protein extracts from each type of ESC. Of these, 52 differentially expressed proteins were identified by the MALDI–TOF/TOF analyzer, including 32 (fESCs vs. pESCs), 28 (fESCs vs. aESCs) and 17 (pESCs vs. aESCs) prominent proteins with significantly higher or lower expression relative to the comparison cells. Among the 32 proteins from fESCs, 12 were significantly increased in expression and 20 were reduced in expression in fESCs com-pared with pESCs. Similarly, 10 of 28 and 8 of 17 proteins were more highly expressed in fESCs and pESCs compared with aESCs, respectively. In contrast, 18 of 28 and 9 of 17 proteins were reduced in expression in fESCs and pESCs compared with aESCs, respectively. Of the eight protein candidates in fESCs, four were in-creased and four were dein-creased in expression relative to both pESCs and aESCs in the 2-DE analysis. Differential expression of these pro-teins were confirmed by mRNA expression analysis using real time RT-PCR. For three
pro-teins, ANXA5, CLIC1 and SRM, Western blot analysis corroborated the expression patterns indicated by the 2-DE results. ANXA5 and CLIC1 were increased in expression and SRM was de-creased in expression in fESCs compared with both pESCs and aESCs. The differentially ex-pressed proteins identified in the present study warrant further investigation towards the goal of their potential application in ESC therapy.
Keywords:Protein Profiling; Embryonic Stem Cell; Parthenogenote; Androgenote; Fertilization
1. INTRODUCTION
The field of stem cell biology has attracted increasing attention in recent years due to the plasticity of stem cells and their broad potential for use in cell therapy. Despite this focus, relatively little is known about the mechanisms underlying the regulation and thereby the potential for the manipulation of stem cells for clinical applications. Embryonic stem cells (ESCs) are pluripo-tent cells derived from the inner cell mass (ICM) of blastocysts. ES cells can proliferate indefinitely in vitro
and can differentiate into a wide variety of cell types both in vivo and in vitro [1,2]. Because of their
excep-tional properties, ESCs have enormous potential to be used for developmental biology studies, drug screening, tissue engineering and transplantation therapy.
problems inherent in transplantation. pESCs are able to differentiate into cell types from all three germ layers and are immunologically matched with their oocyte do-nors [3]. The other uniparental cells, androgenetic ES Cells (aESCs), can be established from androgenotes, which cannot develop into viable fetuses. Like pESCs, aESCs can also be generated with a full complement of major histocompatibility complex antigens [4]. A previ-ous report suggested that pESCs were indistinguishable from ESCs derived from fertilized embryos (fESCs) [5]. However, a detailed understanding of signalling path-ways and molecular mechanisms involved in biparental and uniparental pluripotency will be essential before using them in ESC-based therapies.
Over the past few years, there has been a growing in-terest in applying proteomics to the study of proteins in ESCs [6,7]. Although previous studies have generated a wealth of data, the molecular mechanisms that determine the characteristics of ESCs remain largely unknown. In general, little is known about the functional aspects of ESC-specific proteins. Moreover, in contrast to fESCs, no detailed comparisons of the proteins expressed in pESCs and aESCs have been undertaken. In this study, we used two-dimensional gel electrophoresis (2-DE) and matrix-assisted laser desorption/ionization time-of-flight mass spectrometry (MALDI-TOF/TOF MS) to analyze protein patterns in mouse ESCs. This is the first report to display the global cellular protein profiles in mono- and bi-parentally derived ESCs, and in particular to identify the protein signatures for multipotency in fESCs, pESCs and aESCs.
2. MATERIALS AND METHODS
2.1. Cell Culture, Differentiation in Vitro and Sample Preparation
Mouse ES cell lines, derived from fertilized (fESC1 and 2, line 1 and 2, respectively), parthenogenetic (pESC1 and 2), and androgenetic (aESC1 and 2) blasto-cysts, were kindly provided by Dr. Wakayama (Center for Developmental Biology, RIKEN Kobe, Japan). Each type of blastocysts were generated by fertilization, par-thenogenetically activated by strontium chloride (SrCl2)
following cytochalasin B (CB, Sigma) treatment 6 h and two sperm heads were injected into enucleated oocytes for generation of androgenote embryos. Embryos were cultured in M16 medium for 4 days. ESCs were estab-lished based on general methods using inner cell mass (ICM) of single blastocyst. The fESC1, pESC1 and aESC1 cell lines were used for two-dimensional gel electrophoresis (2-DE) analysis, and experiments were repeated three times using passages 6, 7 and 8, respec-tively. All ESCs were maintained on non-gelatin coated
dishes in DMEM (high glucose; Invitrogen, Carlsbad, CA, USA) supplemented with 15% fetal calf serum, 0.1 mM b-mercaptoethanol, 1000 U/mL recombinant mouse LIF (ESGRO; Chemicon International, Temecula, CA, USA), 1% glutamine (Sigma, St Louis, MO, USA), 0.5% penicillin/ streptomycin (Sigma), and 1% non-essential amino acids (Sigma). fESCs, pESCs and aESCs were differentiated by treatment with 1 mM retinoic acid (RA, Sigma) for 6 days (fRA, pRA and aRA, respectively).
Protein samples were prepared essentially as de-scribed in Lee et al. [8] reports. The cultured cells were harvested with 2-DE lysis buffer containing 8 M Urea, 2 M thiourea, 100 mM DTT, 4% CHAPS and 1 × com-plete protease inhibitor cocktail (Roche Applied Science, Germany). The lysates were incubated for 20 min and centrifuged at 12 000 × g for 10 min at 10℃. The su-pernatants were diluted with rehydration buffer contain-ing 7 M Urea, 2 M thiourea, 100 mM DTT, 2% CHAPS 0.5% ampolyte (Bio-Rad) and 0.01 % bromophenol blue, and then used as the sample to 2-DE analysis.
2.2. 2-DE, in-Gel Digestion and MAL-DI-TOF/TOF MS
2-DE was performed as described in Lee et al. [8]. Images of silver-stained gels were digitized with a den-sitometer (VersaDoc Imaging System 1000TM). The gels
were normalized and statistically analyzed with PDQuest software (Version 7.1.1, Bio-Rad).
In-gel digestion and identification of the altered pro-tein spots were performed as reported previously. [8] Briefly, the protein spots were digested with trypsin and desalted with ZipTip C18 (Millipore). The peptide
sam-ples were mixed with CHCA matrix solution and then analyzed by MALDI-TOF/TOF (AB4700, Applied Bio-systems) in the reflector mode.
Spectra were processed and analyzed with the Global Protein Server Explorer 3.0 software (Applied Biosys-tems). The internal MASCOR (Matrix Science, UK) program was used for matching MS and MS/MS data against database information. The resulting data were surveyed against mouse databases downloaded from both NCBI and the Swiss Prot/TrEMBL homepage.
2.3. Genomic DNA Polymerase Chain Reaction (PCR)
Whole genomic DNA was extracted by phenol/chlo- roform method. PCR reaction was carried out in 25 μl volumes, containing distilled water, 2.5 μl of reaction buffer, 200 μM of dNTPs, 2.0 units of Taq DNA poly-merase (Promega, USA), 10 mM of each primer for Zinc finger protein 1, Y linked (Zfy1), Zinc finger protein
X-linked (Zfx) and Ras association domain family
Copyright © 2011 SciRes. Openly accessible athttp://www.scirp.org/journal/SCD/
total DNA. Amplification was performed following con-ditions: an initial 2-min denaturation at 94˚C was fol-lowed by 30 cycles of 30 s at 94˚C, 45 s at 55˚C - 60˚C, and 60 s at 72˚C. The PCR products for 3 genes were separated on 2.0% agarose gels containing ethidium bromide.
2.4. Reverse Transcriptase-Polymerase Chain Reaction (RT-PCR) and Real Time RT-PCR
Messenger RNA was extracted with the Dynabeads
mRNA Direct Kit (Dynal Asa, Oslo, Norway), standard cDNA synthesis was achieved by reverse transcription of RNA using the oligo(dT) 12 - 18 primer and super-script reverse transuper-scriptase (Invitrogen Co., Grand Island, NY).
For determination of pluripotency and differentiation, mRNA expression in the ESCs and differentiated cells were analyzed by RT-PCR using cDNA as the template, and following primers: POU domain, class 5, transcrip-tion factor 1 (Pou5f1, Oct4), Nanog homeobox (Nanog),
Paired box gene 6 (Pax6), Nestin (Nes) and
[image:3.595.73.518.250.715.2]glyceralde-hyde-3-phosphate dehydrogenase (Gapdh, Table 1).
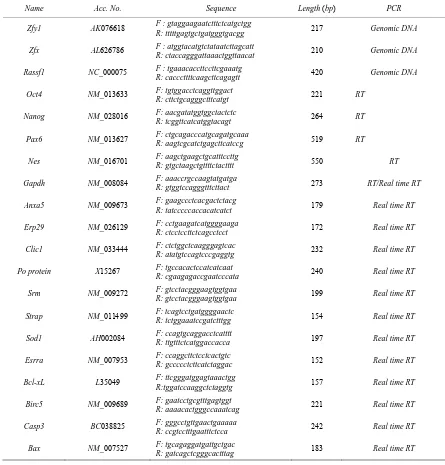
Table 1. Primers used in PCR.
Name Acc. No. Sequence Length (bp) PCR
Zfy1 AK076618 F : gtaggaagaatctttctcatgctgg
R: tttttgagtgctgatgggtgacgg 217 Genomic DNA
Zfx AL626786 F : atggtacatgtctataatcttagcatt R:ctaccagggattaaactggttaacat 210 Genomic DNA
Rassf1 NC_000075 F : tgaaacaccttccttcgaaatg
R: cacccttttcaagcttcagagtt 420 Genomic DNA
Oct4 NM_013633 F: tgtggacctcaggttggact
R: cttctgcagggctttcatgt 221 RT
Nanog NM_028016 F: aacgatatggtggctactctc
R: tcggttcatcatggtacagt 264 RT
Pax6 NM_013627 F: ctgcagacccatgcagatgcaaa
R: aagtcgcatctgagcttcatccg 519 RT
Nes NM_016701 F: aagctgaagctgcatttccttg
R: gtgctaagctgttttctactttt 550 RT
Gapdh NM_008084 F: aaaccrgccaagtatgatga
R: gtggtccagggtttcttact 273 RT/Real time RT
Anxa5 NM_009673 F: gaagccctcacgactctacg
R: tatcccccaccacatcatct 179 Real time RT
Erp29 NM_026129 F: cctgaagatcatggggaaga
R: ctcctccttctcagcctcct 172 Real time RT
Clic1 NM_033444 F: ctctggctcaagggagtcac
R: atatgtccagtcccgaggtg 232 Real time RT
Po protein X15267 F: tgccacactccatcatcaat
R: cgaagagaccgaatcccata 240 Real time RT
Srm NM_009272 F: gtcctacgggaagtggtgaa R: gtcctacgggaagtggtgaa 199 Real time RT
Strap NM_011499 F: tcagtcctgatggggaactc
R: tctggaaatccgatctttgg 154 Real time RT
Sod1 AH002084 F: ccagtgcaggacctcatttt
R: ttgtttctcatggaccacca 197 Real time RT
Esrra NM_007953 F: ccaggcttctcctcactgtc
R: gccccctcttcatctaggac 152 Real time RT
Bcl-xL L35049 F: ttcgggatggagtaaactgg
R:tggatccaaggctctaggtg 157 Real time RT
Birc5 NM_009689 F: gaatcctgcgtttgagtggt R: aaaacactgggccaaatcag 221 Real time RT
Casp3 BC038825 F: gggcctgttgaactgaaaaa
R: ccgtcctttgaatttctcca 242 Real time RT
Bax NM_007527 F: tgcagaggatgattgctgac
R: gatcagctcgggcactttag 183 Real time RT
Gapdh amplification was used as a loading control for
the sample. PCR conditions were as follows:95˚C for 30 s, 55˚C - 60˚C for 30 s and 72˚C for 1 min. The PCR products for 5 genes were separated on 2.0% agarose gels containing ethidium bromide.
Cell lines from fESC1/2, pESC1/2, and aESC1/2 were used for real time RT-PCR. Real-time RT-PCR was performed using the 13 primer sets shown in Table 1
using the DNA Engine OPTICOJ 3 (MJ research, USA). Relative gene expression was quantified using the 2-ddCt method. Gapdh mRNA, a house keeping gene,
was employed as a control.
2.5. Western Blot Analysis
Western blot analysis was performed as described previously [9]. Briefly, ESC lysates were separated by electrophoresis in a CriterionTM Precast Gel (Bio-Rad, Hercules, CA), followed by transfer to a PVDF mem-brane (iBlot TM Gel Transfer Stacks, Cat. No. IB4010-02; Invitrogen). After blocking, the membrane was incubated with primary anti-ANXA5 (GenWay Biotech, Inc., CA, USA), anti-CLIC1 (Aviva Systems Biology, CA, USA), anti-SRM (GeneTex, CA, USA), and anti-GAPDH (Cell Signaling Technology, Danvers, MA, USA). Then, the membrane was incubated with HRP-linked anti-rabbit IgG (Cell Signaling Technology). Finally, the antibody-binding bands on the membrane were visualized using Chemiluminescence Luminol Re-agent (Invitrogen).
2.6. Statistical Analysis
The general linear model (GLM) procedure in the SAS program [10] was applied to analyze data from all experiments. Significant differences were determined using Tukey’s multiple range test [11] and P < 0.05 was considered statistically significant.
3. RESULTS
3.1. Sex Diagnosis and Characterization of ESC and Differentiated Cell Lines
ESC lines which were established from Dr. Waka-yama were well characterized for their pluripotency and differentiation potential including karyotypping [12,13] and chimera formation [14]. To determine accuracy of genotype diagnosis of ESCs, PCR amplification of
Zfy1/Zfx were employed. Genes common to X and Y
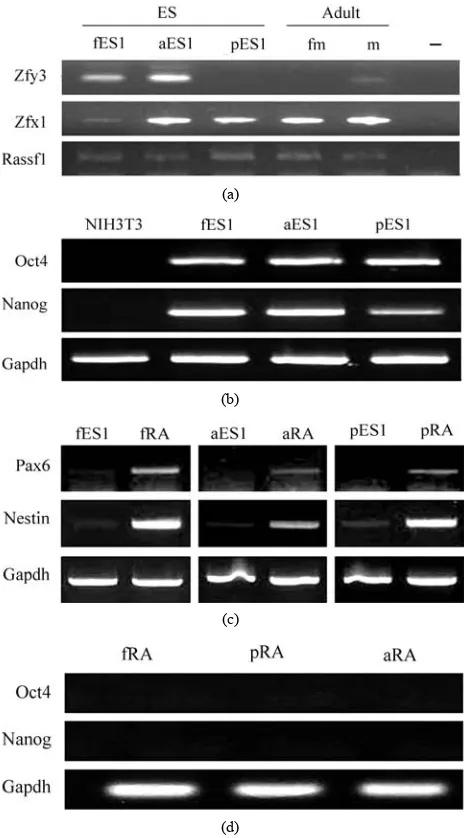
chromosomes (ZFY/ZFX, zinc finger protein) can am-plify by a single primer pair. As shown in Figure 1 (a),
both fESCs and aESCs contain both X and Y chromo-somes, whereas pESCs only shows X chromosome, the same to the adult somatic female cells (fm) that were
used as a positive control. Rassf1 was used as a genomic
DNA positive control, expressed all samples except for negative control, no template group.
(a)
(b)
(c)
(d)
[image:4.595.309.542.132.551.2]Copyright © 2011 SciRes. Openly accessible athttp://www.scirp.org/journal/SCD/
Embryonic stem cells and ESC-derived neuroecto-dermal spheres (NESs) were shown to have characteris-tics typical of pluripotency and neuroprogenitors. RT- PCR results showed that ESC marker genes Oct4 and Nanog were expressed in ESC lines but did not express
in control (NIH3T3) cell line (Figure 1 (b)). An the
oth-er hand, neural stem cell markoth-er genes such as Nes and Pax6 were expressed at markedly increased levels in the
NESs compared with the ESCs (Figure 1 (c)). In
con-trast, Oct4 and Nanog were not expressed in fRA, pRA
and aRA cells which were treated with retinoic acid for 6 days, and all of them were shown with differentiated state (Figure 1 (d)).
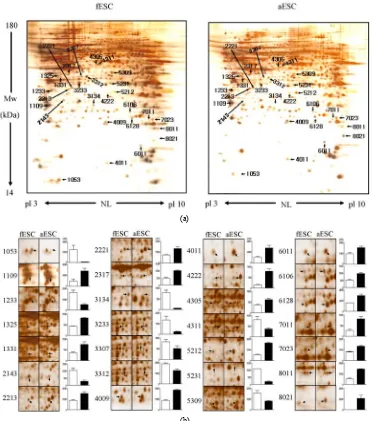
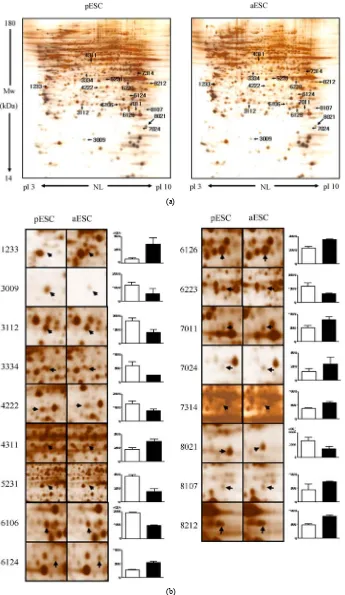
3.2. Comparative Proteomics in fESCs, pESCs and aESCs
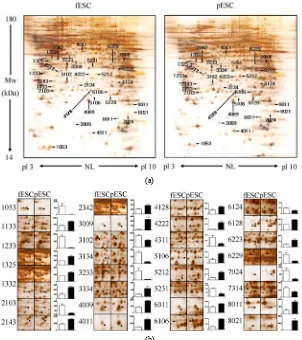
To identify differentially expressed proteins between fESCs vs. pESCs, fESCs vs. aESCs, and pESCs vs. aESCs, proteins were separated using the 2-DE tech-
nique, and experiments were repeated three times for each ESC type, using different passages. Separated pro-teins were visualized with silver staining and analyzed with PDQuest software. Figures 2(a), 3(a) and 4(a)
show typical 2-DE gels of total ESC proteins for the three groups. In total, more than 800 proteins may be seen in each gel, with isoelectric pH values of pH 3–10 and molecular weights (MW) of 14 - 180 kDa. The MALDI–TOF/TOF analyzer identified 52 differentially expressed proteins among the three types of ESCs, with gels placed side-by-side for ease of comparison between groups (Figure 2(b), 3(b) and 4(b)). We identified 32
(fESCs vs. pESCs, Table 2), 28 (fESCs vs. aESCs, Ta-ble 3), and 17 (pESCs vs. aESCs, Table 4) prominent
proteins in each comparison. Tables 2-4 list these pro-teins, highlight representative peptide sequences and sequence coverage, note the theoretical and experimental isoelectric point(pI)and MW values, and provide
acces-sion numbers from both the Swiss-Prot and NCBI data-bases.
(a)
[image:5.595.148.450.330.670.2](b)
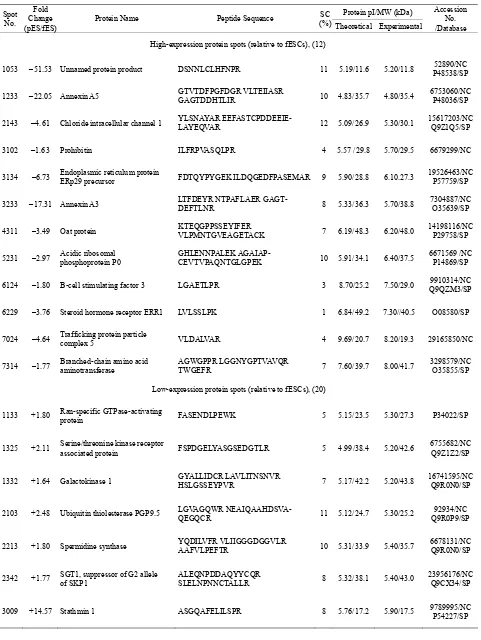
Table 2. Identification of differentially expressed proteins between fESCs and pESCs.
Protein pI/MW (kDa) Spot
No. Fold Change (pES/fES)
Protein Name Peptide Sequence SC
(%) Theoretical Experimental
Accession No. /Database
High-expression protein spots (relative to fESCs), (12)
1053 –51.53 Unnamed protein product DSNNLCLHFNPR 11 5.19/11.6 5.20/11.8 P48538/SP 52890/NC
1233 –22.05 Annexin A5 GTVTDFPGFDGR VLTEIIASR GAGTDDHTLIR 10 4.83/35.7 4.80/35.4 6753060/NCP48036/SP
2143 –4.61 Chloride intracellular channel 1 YLSNAYAR EEFASTCPDDEEIE-LAYEQVAR 12 5.09/26.9 5.30/30.1 15617203/NCQ9Z1Q5/SP
3102 –1.63 Prohibitin ILFRPVASQLPR 4 5.57 /29.8 5.70/29.5 6679299/NC
3134 –6.73 Endoplasmic reticulum protein ERp29 precursor FDTQYPYGEK ILDQGEDFPASEMAR 9 5.90/28.8 6.10.27.3 19526463/NCP57759/SP
3233 –17.31 Annexin A3 LTFDEYR NTPAFLAER GAGT-DEFTLNR 8 5.33/36.3 5.70/38.8 7304887/NCO35639/SP
4311 –3.49 Oat protein KTEQGPPSSEYIFER VLPMNTGVEAGETACK 7 6.19/48.3 6.20/48.0 14198116/NC P29758/SP
5231 –2.97 Acidic ribosomal phosphoprotein P0 GHLENNPALEK AGAIAP-CEVTVPAQNTGLGPEK 10 5.91/34.1 6.40/37.5 6671569 /NCP14869/SP
6124 –1.80 B-cell stimulating factor 3 LGAETLPR 3 8.70/25.2 7.50/29.0 Q9QZM3/SP9910314/NC
6229 –3.76 Steroid hormone receptor ERR1 LVLSSLPK 1 6.84/49.2 7.30//40.5 O08580/SP
7024 –4.64 Trafficking protein particle complex 5 VLDALVAR 4 9.69/20.7 8.20/19.3 29165850/NC
7314 –1.77 Branched-chain amino acid aminotransferase AGWGPPR LGGNYGPTVAVQR TWGEFR 7 7.60/39.7 8.00/41.7 3298579/NCO35855/SP
Low-expression protein spots (relative to fESCs), (20)
1133 +1.80 Ran-specific GTPase-activating protein FASENDLPEWK 5 5.15/23.5 5.30/27.3 P34022/SP
1325 +2.11 Serine/threonine kinase receptor associated protein FSPDGELYASGSEDGTLR 5 4.99/38.4 5.20/42.6 6755682/NCQ9Z1Z2/SP
1332 +1.64 Galactokinase 1 GYALLIDCR LAVLITNSNVR HSLGSSEYPVR 7 5.17/42.2 5.20/43.8 16741595/NCQ9R0N0/SP
2103 +2.48 Ubiquitin thiolesterase PGP9.5 LGVAGQWR NEAIQAAHDSVA-QEGQCR 11 5.12/24.7 5.30/25.2 Q9R0P9/SP 92934/NC
2213 +1.80 Spermidine synthase YQDILVFR VLIIGGGDGGVLR AAFVLPEFTR 10 5.31/33.9 5.40/35.7 6678131/NC Q9R0N0/SP
2342 +1.77 SGT1, suppressor of G2 allele of SKP1 ALEQNPDDAQYYCQR SLELNPNNCTALLR 8 5.32/38.1 5.40/43.0 23956176/NCQ9CX34/SP
Copyright © 2011 SciRes. Openly accessible athttp://www.scirp.org/journal/SCD/ 3334 +3.43 Steroid hormone receptor ERR1 LVLSSLPK 1 6.84/49.2 6.00/41.8 131224731/NC
4009 +2.16 DJ-1 protein VTVAGLAGKDPVQCSR MMNGSHYSYSESR 15 6.32/19.9 6.20/22.5 16924002/NC Q99LX0/SP
4011 +3.36 Cu/Zn-superoxide dismutase KHGGPADEER VISLSGEHSIIGR 14 6.23/15.9 6.20/16.0 201006 /NCP08228/SP
4128 +1.73 Heat shock protein 27 LFDQAFGVPR AV-TQSAEITIPVTFEAR 13 6.12/22.8 6.30/24.6 204665/NC P14602/SP
4222 +8.40 Estrogen-related receptor alpha LV LVLSSLPK 1 5.77/45.0 6.30/33.2 6679693/NCO08580/SP
5106 +2.89 Acyl-protein thioesterase 1 (Lyso-phospholipase I) ASFSQGPINSANR 5 6.14/24.6 6.40/23.3 P97823/SP
5212 +3.50 Uridine phosphorylase 1 FVCVGGSSSR EYPNICAGTDR MLYHAR CSNITIIR 11 6.12/34.0 6.50/33.3 6678515/NCP52624/SP
6011 +1.60 Similar to basic transcription factor 3 VQASLAANTFTITGHAETK 34 7.85/19.4 7.60/18.5 51762066/NC
6106 +3.87 GTP-binding nuclear protein Ran FNVWDTAGQEK NVPNWHR VCE-NIPIVLCGNK SIVFHR 17 7.01/24.4 7.00/24.5 P62827/SP
6128 +1.82 Glutathione S-transferase, alpha 4 EKEESYDLILSR FLQPGSQR KPPPDGPYVEVVR 14 6.77/25.5 7.10/23.3 6754082/NCP24472/SP
6223 +2.67 L-lactate dehydrogenase chain M VIGSGCNLDSAR SLNPELGTDAD-KEQWK SADTLWGIQK 11 7.62/36.4 7.50/37.6 P06151/SP 65923/NC
8011 +3.16 Proteasome (prosome, macropain) subunit, beta type 5
RGPGLYYVDSEGNR GPGLY-YVDSEGNR RAIYQATYR AIYQATYR DAYSGGAVNLYHVR
14 6.52/28.5 8.50/21.3 6755204/NC O55234/SP
8021 +413.80 Hypothetical protein VGPMLSPR 4 9.69/21.0 8.50/19.6 51767674/NCQ7TQH0/SP
[image:7.595.62.539.495.722.2]pES/fES: pESCs/fESCs.
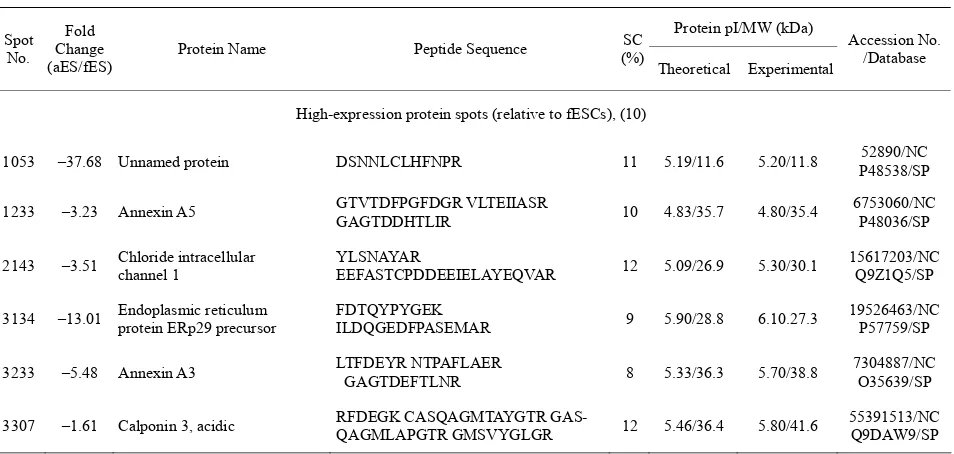
Table 3. Identification of differentially expressed proteins between fESCs and aESC.
Protein pI/MW (kDa) Spot
No. Fold Change (aES/fES)
Protein Name Peptide Sequence (%)SC
Theoretical Experimental
Accession No. /Database
High-expression protein spots (relative to fESCs), (10)
1053 –37.68 Unnamed protein DSNNLCLHFNPR 11 5.19/11.6 5.20/11.8 P48538/SP 52890/NC
1233 –3.23 Annexin A5 GTVTDFPGFDGR VLTEIIASR GAGTDDHTLIR 10 4.83/35.7 4.80/35.4 6753060/NCP48036/SP
2143 –3.51 Chloride intracellular channel 1 YLSNAYAR EEFASTCPDDEEIELAYEQVAR 12 5.09/26.9 5.30/30.1 15617203/NCQ9Z1Q5/SP
3134 –13.01 Endoplasmic reticulum protein ERp29 precursor FDTQYPYGEK ILDQGEDFPASEMAR 9 5.90/28.8 6.10.27.3 19526463/NCP57759/SP
3233 –5.48 Annexin A3 LTFDEYR NTPAFLAER GAGTDEFTLNR 8 5.33/36.3 5.70/38.8 7304887/NCO35639/SP
3312 –1.50 Unnamed protein APIQWEER CSDFTEEICR 4 6.27/39.6 5.90/41.4 26339056/NC
4311 –2.16 Oat protein KTEQGPPSSEYIFER VLPMNTGVEAGETACK 7 6.19/48.3 6.20/48.0 14198116/NC P29758/SP
5231 –5.55 Acidic ribosomal phosphoprotein P0 GHLENNPALEK AGAIAP-CEVTVPAQNTGLGPEK 10 5.91/34.1 6.40/37.5 6671569/NCP14869/SP
5309 –1.94 Heterogeneous nuclear ribonucleoprotein A/B EVYQQQQYGSGGR 4 7.68/30.8 6.50/43.6 Q99020/SP
Low-expression protein spots (relative to fESCs), (18)
1109 +2.97 14-3-3 protein gamma LAEQAER NVTELNEPLSNEER MKGDYYR 11 4.80/28.3 4.80/28.1 3065929/NCP68510/SP
1325 +1.89 Serine/threonine kinase receptor-associated protein FSPDGELYASGSEDGTLR 5 4.99/38.4 5.20/42.6 6755682/NCQ9Z1Z2/SP
1331 +2.05
B-cell stimulating factor-3 precursor (BSF-3) (Novel neurotrophin-1) (NNT-1)
LGAETLPR 3 8.70/25.2 5.20/42.0 Q9QZM3/SP
2213 +1.76 Spermidine synthase YQDILVFR VLIIGGGDGGVLR AAFVLPEFTR 10 5.31/33.9 5.40/35.7 6678131/NC Q9R0N0/SP
2221 +1.83 Similar to hypothetical protein MGC36907 NKYEDEINKR 3 5.42/36.2 5.50/36.3 34868312/NC
2317 +2.17 Ubiquitin-like 1 activating enzyme E1A VDQICHR 2 5.24/38.5 5.40/43.7 Q9R1T2/SP
4009 +2.15 DJ-1 protein VTVAGLAGKDPVQCSR MMNGSHYSYSESR 15 6.32/19.9 6.20/22.5 16924002/NC Q99LX0/SP
4011 +2.47 Cu/Zn-superoxide dismutase KHGGPADEER VISLSGEHSIIGR 14 6.23/15.9 6.20/16.0 201006/NC P08228/SP
4222 +5.09 Estrogen-related receptor alpha LV LVLSSLPK 1 5.77/45.0 6.30/33.2 6679693/NCO08580/SP
4305 +1.76 eIF3-p44 CPYKDTLGPMQK CPYKDTLGPMQK 3 6.08/35.3 6.10/47.8 4097873/NCQ9Z1D1/SP
5212 +3.03 Uridine phosphorylase 1 FVCVGGSSSR EYPNICAGTDR MLYHAR CSNITIIR 11 6.12/34.0 6.50/33.3 6678515/NCP52624/SP
6011 +1.56 Similar to basic transcription factor 3 VQASLAANTFTITGHAETK 34 7.85/19.4 7.60/18.5 51762066/NC
6106 +1.95 GTP-binding nuclear protein Ran FNVWDTAGQEK NVPNWHR VCE-NIPIVLCGNK SIVFHR 17 7.01/24.4 7.00/24.5 P62827/SP
6128 +1.88 Glutathione S-transferase, alpha 4 EKEESYDLILSR FLQPGSQR KPPPDGPYVEVVR 14 6.77/25.5 7.10/23.3 6754082/NCP24472/SP
7011 +3.06 Thymidylate kinase; TMK YAFSGVAFTGAK GEFGLER 8 9.16/25.5 8.00/22.8 1836042/NCP97930/SP
7023 +1.63 Component C5 of proteasome LSEGFSIHTR DVFISAAER 8 8.29/24.6 8.20/23.1 1165123/NCO09061/SP
8011 +2.74 Proteasome (prosome, macropain) subunit, beta type 5
RGPGLYYVDSEGNR GPGLY-YVDSEGNR RAIYQATYR AIY-QATYR DAYSGGAVNLYHVR
14 6.52/28.5 8.50/21.3 6755204/NC O55234/SP
8021 +562.88 Hypothetical protein VGPMLSPR 4 9.69/21.0 8.50/19.6 51767674/NCQ7TQH0/SP
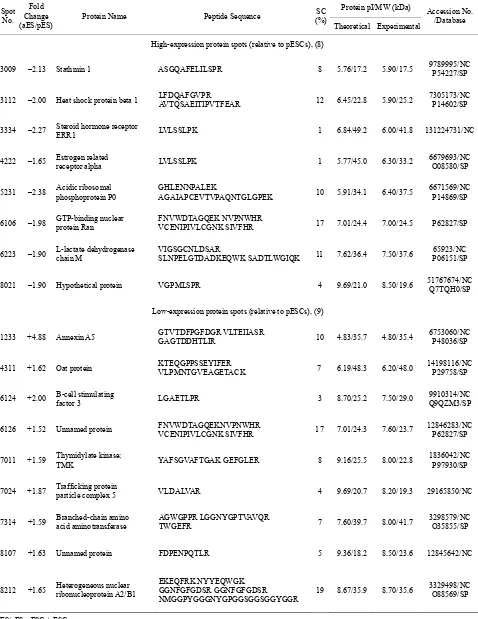
Copyright © 2011 SciRes. Openly accessible athttp://www.scirp.org/journal/SCD/ Table 4. Summary of differentially expressed proteins between pESCs and aESCs.
Protein pI/MW (kDa) Spot
No. Fold Change (aES/pES)
Protein Name Peptide Sequence (%)SC
Theoretical Experimental
Accession No. /Database
High-expression protein spots (relative to pESCs), (8)
3009 –2.13 Stathmin 1 ASGQAFELILSPR 8 5.76/17.2 5.90/17.5 9789995/NCP54227/SP
3112 –2.00 Heat shock protein beta 1 LFDQAFGVPR AVTQSAEITIPVTFEAR 12 6.45/22.8 5.90/25.2 7305173/NCP14602/SP
3334 –2.27 Steroid hormone receptor ERR1 LVLSSLPK 1 6.84/49.2 6.00/41.8 131224731/NC
4222 –1.65 Estrogen related receptor alpha LVLSSLPK 1 5.77/45.0 6.30/33.2 6679693/NCO08580/SP
5231 –2.38 Acidic ribosomal phosphoprotein P0 GHLENNPALEK AGAIAPCEVTVPAQNTGLGPEK 10 5.91/34.1 6.40/37.5 6671569/NCP14869/SP
6106 –1.98 GTP-binding nuclear protein Ran FNVWDTAGQEK NVPNWHR VCENIPIVLCGNK SIVFHR 17 7.01/24.4 7.00/24.5 P62827/SP
6223 –1.90 L-lactate dehydrogenase chain M VIGSGCNLDSAR SLNPELGTDADKEQWK SADTLWGIQK 11 7.62/36.4 7.50/37.6 P06151/SP 65923/NC
8021 –1.90 Hypothetical protein VGPMLSPR 4 9.69/21.0 8.50/19.6 51767674/NCQ7TQH0/SP
Low-expression protein spots (relative to pESCs), (9)
1233 +4.88 Annexin A5 GTVTDFPGFDGR VLTEIIASR GAGTDDHTLIR 10 4.83/35.7 4.80/35.4 6753060/NCP48036/SP
4311 +1.62 Oat protein KTEQGPPSSEYIFER VLPMNTGVEAGETACK 7 6.19/48.3 6.20/48.0 14198116/NC P29758/SP
6124 +2.00 B-cell stimulating factor 3 LGAETLPR 3 8.70/25.2 7.50/29.0 Q9QZM3/SP9910314/NC
6126 +1.52 Unnamed protein FNVWDTAGQEKNVPNWHR VCENIPIVLCGNK SIVFHR 17 7.01/24.3 7.60/23.7 12846283/NCP62827/SP
7011 +1.59 Thymidylate kinase; TMK YAFSGVAFTGAK GEFGLER 8 9.16/25.5 8.00/22.8 1836042/NCP97930/SP
7024 +1.87 Trafficking protein particle complex 5 VLDALVAR 4 9.69/20.7 8.20/19.3 29165850/NC
7314 +1.59 Branched-chain amino acid aminotransferase AGWGPPR LGGNYGPTVAVQR TWGEFR 7 7.60/39.7 8.00/41.7 3298579/NCO35855/SP
8107 +1.63 Unnamed protein FDPENPQTLR 5 9.36/18.2 8.50/23.6 12845642/NC
8212 +1.65 Heterogeneous nuclear ribonucleoprotein A2/B1
EKEQFRK NYYEQWGK GGNFGFGDSR GGNFGFGDSR
NMGGPYGGGNYGPGGSGGSGGYGGR 19 8.67/35.9 8.70/35.6
3329498/NC O88569/SP
3.3. Identification of Proteins in fESCs, pESCs and aESCs
Table 2 lists the majority of the protein spots
dis-playing different protein expression in fESCs and pESCs. There are 32 spots with significant differences in post-intensities between fESCs and pESCs (Figure 2 (b)). Among these 32, 12 were expressed at significantly
higher levels and 20 were expressed at significantly lower levels in fESCs than in pESCs. The identities of the 32 proteins were determined by comparing the re-corded masses of fingerprint peptides with the theoreti-cal peptide masses derived from known mouse peptides
in the protein database.
Similarly, Table 3 and 4 show proteins that were
dif-ferentially displayed between fESCs vs. aESCs and pESCs vs. aESCs, respectively. Individual protein spots for these groups are shown in Figure 3(b) and Figure 4(b). Ten out of the 28 proteins differentially expressed
in fESCs vs. aESCs were decreased in fESCs as com-pared with pESCs, and 8 out of the 17 proteins differen-tially expressed in pESCs vs. aESCs were decreased in pESCs as compared with aESCs. In contrast, 18 and 9 proteins were increased in expression for fESCs vs. aESCs and pESCs vs. aESCs, respectively.
(a)
(b)
Copyright © 2011 SciRes. Openly accessible athttp://www.scirp.org/journal/SCD/ (a)
[image:11.595.127.472.78.673.2](b)
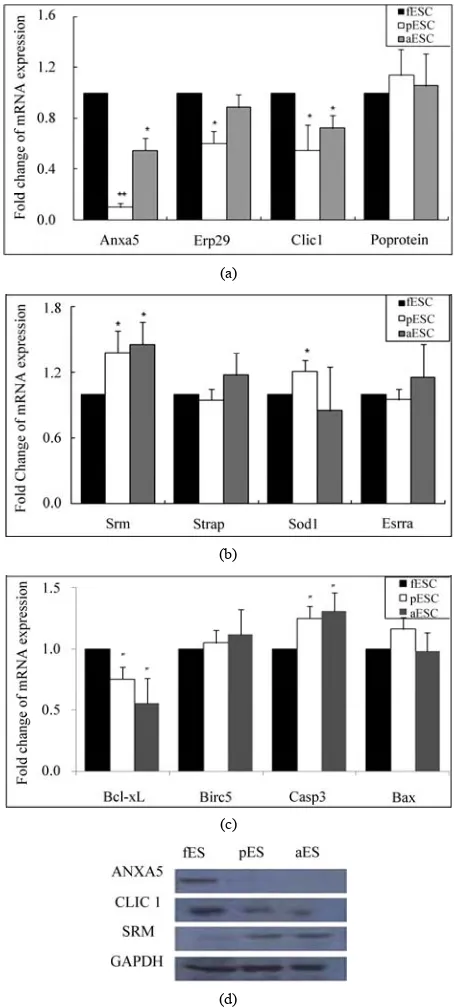
3.4. mRNA and Protein Expression
To investigate the changes in gene expression at the mRNA level, some proteins identified by MS were veri-fied by real time RT-PCR to detect mRNA transcription (Figure 5 (a)-(c)). First, transcription levels were
deter-mined for eight protein candidates displaying differential expression in 2-DE. Four of these exhibited increased expression (Figure 5 (a)) and the other four exhibited
reduced expression (Figure 5 (b)) in fESCs compared
with both pESCs and aESCs. Additionally, apoptosis related four genes that were not identified by MS were also analyzed: Bcl-xL, Baculoviral IAP repeat-containing
5 (Birc5, Survivin), Caspase 3 (Casp3) and BCL2-asso-
ciated X protein (Bax, Figure 5 (c)). As seen in Figure 5,
analyses of Annexin A5 (Anxa5), Chloride intracellular
channel 1 (Clic1) and Spermidine synthase (Srm) mRNA
(Figure 5 (a) & (b)) showed the same expression
pat-terns as the 2-DE results, i.e., the mRNA expression of Anxa5 and Clic1 was higher in fESCs than in pESCs and
aESCs, and, SRM was low expressed in the fESCs compared with pESCS and aESCs. In addition, we con-firmed ANXA5, CLIC1 and SRM protein expression by Western blot analysis, and these expression patterns were in agreement with the mRNA analyses (Figure 5 (b)). Endoplasmic reticulum protein ERp29 precursor
(Erp29) and Cu/Zn-superoxide dismutase (Sod1) were
increased and reduced in expression, respectively, in fESCs compared with pESCs, though no differences were observed between fESCs and aESCs. For three other candidates, Acidic ribosomal phosphoprotein P0 (Po protein), Serine/threonine kinase receptor associated
protein (Strap) and Estrogen-related receptor alpha ( Es-rra), no differences were observed among the three
types of ESCs (Figure 5 (a) & (b)). For the apoptosis
related genes, the anti-apoptotic gene Bcl-xL was highly
expressed in the fESCs compared with the pESCs and aESCs; in contrast, the pro-apoptotic gene Bax was
higher in the pESCs and aESCs than in the fESCs ( Fig-ure 5 (c)).
(a)
(b)
(c)
4. DISCUSSION
(d)Figure 5. Relative mRNA expression levels of differentially expressed protein candidates with high (A) or low (B) ex-pression levels in fESCs compared with both pESCs and aESCs in 2-DE analysis. Apoptosis-related genes (C) were analyzed by real time RT-PCR. Gapdh mRNA expression was used as an internal standard and its mRNA level in fESCs was designated as one-fold (baseline). Black bars, fESCs; white bars, pESCs; grey bars, aESCs. Statistically significant differences are indicated: *, P < 0.05; **, P < 0.01. Values are means ±SEM for two independent cell lines. (D), Protein expression in fESCs (fES), pESCs (pES), and aESCs (aES). GAPDH protein expression was used as the control.
[image:12.595.310.537.78.582.2]Copyright © 2011 SciRes. Openly accessible athttp://www.scirp.org/journal/SCD/
negative for differentiated cell markers, Pax6 and Nes.
Sex diagnosis results showed that both fESCs and aESCs contained both X and Y chromosomes.
Several transcription factors are essential for ES cell pluripotency. Octamer-binding protein 3 or 4 (Oct3/4, Oct4), a POU family member, is one such factor. Oct4 is
downregulated in response to differentiation, and its upregulation induces differentiation. Therefore, a critical amount of Oct4 is required to sustain stem-cell
self-renewal [17]. Also, Nanog, a homeodomain protein,
was found to be capable of maintaining ES cell self-renewal, independent of the LIF/STAT3 pathway [18,19]. In the present study, Oct4 and Nanog were
ex-pressed in the fESCs, pESCs, and aESCs. The data par-tially suggested that pluripotency of pESCs and aESCs did not differ from that of fESCs. This supports evidence from a previous study [5], in which chimeras produced from pESCs generated by diploid blastocysts developed well postnatally, with no growth retardation, and the age of the chimeras did not affect the proportions of tissues contributed by pESCs. Furthermore, pESCs have the capacity to differentiate into all tissue types in the body; Surprisingly, even in organisms as complex as mice, pESCs can support full-term development, resulting in a pESC-derived newborn [5]. aESCs also exhibit a sur-prising ability to differentiate. Dinger et al. [20]
ob-served widespread contributions from aESCs in fetal chimeric mice and reported that their neural differentia-tion potential, in terms of self-renewal properties of neural stem cells, did not differ from that of normal bi-parental fESCs [20]. In addition, aESCs are able to dif-ferentiate into various cell types of all three embryonic germ layers [21]. Together, homozygous ESCs, or at least pESCs, are indistinguishable from fESCs with re-spect to tissue/organ contribution. Reliable derivation of pluripotent pESCs or aESCs is a critical step towards the feasibility of female or male patient-specific ES cell therapy in regenerative medicine.
One of the proteins highly expressed in fESCs was identified as ANNEXIN A5 (ANXA5, spot no. 1233), a 35 kD plasma protein. The membrane-binding capacity of ANXA5 has multiple functions, including the modu-lation of signalling events, a function as a Ca-channel, involvement in calcification processes, and a function as a receptor for viruses [22]. ANXA5 can also interfere with calcium and phospholipid signalling pathways [23]. Of note, ANXA5 mRNA and protein have been shown to be expressed in the zebrafish oocyte [24]. It is possi-ble that the expression level of Anex5 is higher in fESCs
than in pESCs and aESCs, and that this may be related to fertilization and calcium oscillation upon sperm penetra-tion into the oocyte. As seen in a previous report [25], after sperm capacitation, Anex5 binding sites were found
mainly in the post-acrosomal region of the sperm head plasma membrane. After induction of the acrosome re-action, the Anex5 binding sites were found almost only
in the acrosomal region and with higher numbers of binding sites in the equatorial area.
Spot no. 2143 was also highly expressed in fESCs compared with pESCs and aESCs. This protein spot was identified as CLIC1. CLIC1, also known as NCC27, is a member of the Clic family of chloride channels, which
can function as chloride channels in vitro [26,27]. These
proteins have significant structural homology with glu-tathione-S-transferase [28]. In somatic cells, the expres-sion of CLIC1 is localized mainly in the nuclear and vesiculo-cytoplasmic membranes. Furthermore, vesiculo- cytoplasmic CLIC1 colocalizes with mitochondria, and CLIC1 may play a role in the regulation of osteoblastic differentiation from mesenchymal progenitors [29]. CLIC1 protein is expressed in Xenopus oocytes in
com-bination with the cystic fibrosis transmembrane conduc-tance regulator (CFTR) [30]. To date, no study has re-ported any function associated with CLIC1 in ESCs or embryos. However, one study did report that CLIC1 might play important roles in gallbladder carcinoma me-tastasis, including in cell motility and invasion [31]. It would be considering that CLIC1 may be associated with lower efficiency in derivation of pESC line than fESC line [5]. During ICM outgrowth, MAPK signalling is noticeably reduced in parthenogenetic blastocysts compared with fertilized blastocysts. Though no similar study has been done for aESCs, as uniparental ESCs, aESCs may undergo intracellular processes more similar to those of pESCs than to those of fESCs. CLIC1, highly expressed in fESCs compared with pESCs and aESCs, is required further observation of its function during pre-implantation embryogenesis and ESC generation in both uniparental and biparental chromosomes.
quality and high levels of apoptosis in pESCs and aESCs compared with fESCs. In the present study, significantly higher expression level of Casp3 and lower expression
level of Bcl-xL in pESCs and aESCs vs. fESCs provided
strong evidence in support of this idea, although no dif-ferentially expressed protein spot was identified by MS. Previous reports have indicated that polyamines were essential for normal cell growth [33] and required for apoptosis with Caspase activation [34]. Spermidine
synthase gene is also essential for survival of Arabidop-sis [35]. In plant cells, spermidine acts as a signalling regulator in stress signalling pathways, leading to a build-up of stress tolerance mechanisms under stress conditions [36]. Apoptosis occurs during the normal development of mammalian embryos because it helps to remove unnecessary cells, an important developmental process [37]. In pESCs and aESCs, SRM may act as a Caspase activator for cells which are needed to undergo apoptosis.
This study describes analyses of the expressed pro-teins in fESCs as compared with pESCs and aESCs. This information contributes to our understanding of the in-tracellular processes in uniparental- or biparental-de- rived homozygous or heterozygous ESCs, and should serve to provide insight into the functional capabilities of these distinct cell types. Although we believe that the proteins identified in this study are important for ESC therapy in the clinical setting, we should also point out that the actual function of these proteins in these types of stem cells, especially during differentiation, is at present unknown. Studying each protein individually, using gain of function, loss of function, and dominant-negative mutants, may reveal how and when these molecules contribute to the self-renewal and differentiation of ESCs.
In conclusion, two protein candidates, ANXA5 and CLIC1, were more highly expressed in fESCs compared with pESCs and aESCs. In contrast, SRM was more highly expressed in pESCs and aESCs than in fESCs. Further study of these protein candidates is needed to identify and clarify their functions, including functions related to the avoidance of immune rejection problems during ESC therapy, the maintenance of pluripotency, and the properties of ESC differentiation.
5. ACKNOWLEDGEMENTS
This work is supported by grant No. 20100301-061-224-001-50-00 from the Biogreen 21 program, RDA, Republic of Korea.
REFERENCES
[1] Evans, M.J. and Kaufman, M.H. (1981) Establishment in culture of pluripotential cells from mouse embryos. Nature,
292, 154-156.doi:10.1038/292154a0
[2] Thomson, J.A., Itskovitz-Eldor J., Shapiro S.S., Waknitz, M.A., Swiergiel, J.J., Marshall, V.S. and Jones, J.M. (1998) Embryonic stem cell lines derived from human blastocysts. Science, 282, 1145-1147.
doi:10.1126/science.282.5391.1145
[3] Allen, N.D., Barton, S.C., Hilton, K., Norris, M.L. and Sura-ni, M.A. (1994) A functional analysis of imprinting in parthenogenetic embryonic stem cells. Development, 120, 1473-1482.
[4] Eckardt, S, Leu, N.A., Bradley, H.L., Kato, H., Bunting, K.D. and McLaughlin, K.J. (2007) Hematopoietic reconstitution with androgenetic and gynogenetic stem cells. Genes De-veplment, 21, 409-419.doi:10.1101/gad.1524207
[5] Li, C., Chen, Z., Liu, Z., Huang, J., Zhang, W., Zhou, L., Keefe, D.L. and Liu, L. (2009) Correlation of expression and methylation of imprinted genes with pluripotency of parthenogenetic embryonic stem cells. Human Molecular Genetics, 18, 2177- 2187.doi:10.1093/hmg/ddp150 [6] Baharvand, H., Fathi, A., Gourabi, H., Mollamohammadi, S.
and Salekdeh, G.H. (2008) Identification of mouse embry-onic stem cell-associated proteins. Journal of Proteome Re-search, 7, 412-423.doi:10.1021/pr700560t
[7] Intoh, A., Kurisaki, A., Yamanaka, Y., Hirano, H., Fukuda, H., Sugino, H. and Asashima, M. (2009) Proteomic analysis of membrane proteins expressed specifically in pluripotent murine embryonic stem cells. Proteomics, 9, 126-137. doi:10.1002/pmic.200800496
[8] Lee, C.K., Kim, H.J., Lee, Y.R., So, H.H., Park, H.J., Won, K.J., Park, T., Lee, K.Y., Lee, H.M. and Kim, B. (2007) Analysis of peroxiredoxin decreasing oxidative stress in hy-pertensive aortic smooth muscle. Biochimica at Biophysica Acta, 1774, 848-855.
[9] Zhang, D.X., Cui, X.S. and Kim, N.H. (2009) Involvement of polyadenylation status on maternal gene expression dur-ing in vitro maturation of porcine oocytes. Molecular Re-production Development, 76, 881-889.
doi:10.1002/mrd.21056
[10] Cary. Statisitics. (1985) SAS User's Gudie Version 5, NC, SAS. [11] Torrie, RGDSa, J.H. (1980) Principles and Procedures of
Statistics. New York, McGraw Hill Book Companies. [12] Hikichi, T., Wakayama, S., Mizutani, E., Takashima, Y.,
Kishigami, S., Van Thuan, N., Ohta, H., Thuy Bui, H., Ni-shikawa, S. and Wakayama, T. (2007) Differentiation poten-tial of parthenogenetic embryonic stem cells is improved by nuclear transfer. Stem Cells, 25, 46-53.
doi:10.1634/stemcells.2006-0439
[13] Hikichi, T., Ohta, H., Wakayama, S. and Wakayama, T. (2010) Functional full-term placentas formed from parthe-nogenetic embryos using serial nuclear transfer. Develop-ment, 137, 2841-2847.doi:10.1242/dev.051375
[14] Wakayama, S., Ohta, H., Kishigami, S., Thuan, N.V., Hiki-chi, T., Mizutani, E., Miyake, M. and Wakayama, T. (2005) Establishment of male and female nuclear transfer embry-onic stem cell lines from different mouse strains and tissues. Biology of Reproduction, 72, 932-936.
doi:10.1095/biolreprod.104.035105
[15] Wakayama, T., Tabar, V., Rodriguez, I., Perry, A.C., Studer, L. and Mombaerts, P. (2001) Differentiation of embryonic stem cell lines generated from adult somatic cells by nuclear transfer. Science, 292, 740-743.
Copyright © 2011 SciRes. Openly accessible athttp://www.scirp.org/journal/SCD/
[16] Wakayama, S., Jakt, M.L., Suzuki, M., Araki, R., Hikichi, T., Kishigami, S., Ohta, H., Van Thuan, N., Mizutani, E., Sa-kaide, Y., Senda, S., Tanaka, S., Okada, M., Miyake, M., Abe, M., Nishikawa, S., Shiota, K. and Wakayama, T. (2006) Equivalency of nuclear transfer-derived embryonic stem cells to those derived from fertilized mouse blastocysts. Stem Cells, 24, 2023-2033.
doi:10.1634/stemcells.2005-0537
[17] Niwa, H., Miyazaki, J. and Smith, A.G. (2000) Quantitative expression of Oct-3/4 defines differentiation, dedifferentia-tion or self-renewal of ES cells. Nature Genetics, 24, 372-376.doi:10.1038/74199
[18] Mitsui, K., Tokuzawa, Y., Itoh, H., Segawa, K., Murakami, M., Takahashi, K., Maruyama M, Maeda M and Yamanaka S. (2003) The homeoprotein Nanog is required for mainte-nance of pluripotency in mouse epiblast and ES cells. Cell,
113, 631-642.doi:10.1016/S0092-8674(03)00393-3 [19] Kashyap, V., Rezende, N.C., Scotland, K.B., Shaffer, S.M.,
Persson, J.L., Gudas, L.J. and Mongan, N.P. (2009) Regula-tion of stem cell pluripotency and differentiaRegula-tion involves a mutual regulatory circuit of the NANOG, OCT4, and SOX2 pluripotency transcription factors with polycomb repressive complexes and stem cell microRNAs. Stem Cells Develop-ment, 18, 1093-1108.doi:10.1089/scd.2009.0113
[20] Dinger, T.C., Eckardt, S., Choi, S.W., Camarero, G., Kuro-saka, S., Hornich, V., McLaughlin, K.J. and Muller, A.M. (2008) Androgenetic embryonic stem cells form neural pro-genitor cells in vivo and in vitro. Stem Cells, 26, 1474-1483. doi:10.1634/stemcells.2007-0877
[21] Teramura, T., Onodera, Y., Murakami, H., Ito, S., Mihara, T., Takehara, T., Kato, H., Mitani,T., Anzai, M., Matsumoto, K., Saeki, K., Fukuda, K., Sagawa, N. and Osoi, Y. (2009) Mouse androgenetic embryonic stem cells differentiated to multiple cell lineages in three embryonic germ layers in vitro. Journal of Reproduction and Development, 55, 283-292. doi:10.1262/jrd.20146
[22] Dedman BASaJR. Annexins. Biometals (1998) 11, 399-404. doi:10.1023/A:1009205925714
[23] Russo-Marie, F. and Annexin, V. (1999) Phospholipid me-tabolism. Clinical Chemistry and Laboratory Medicine, 37, 287-291.doi:10.1515/CCLM.1999.050
[24] Ozerova, S.G. and Minin, A.A. (2008) A study of proteins of annexin group in early fish development. IV. Identification of calcium-binding proteins in zebrafish egg by mass spec-trometry. Ontogenez, 39, 222-226.
[25] Avalos-Rodriguez, A., Ortiz-Muniz, A.R., Ortega-Camarillo, C., Vergara-Onofre, M., Rosado-Garcia, A. and Ro-sales-Torres, A.M. (2004) Fluorometric study of rabbit sperm head membrane phospholipid asymmetry during ca-pacitation and acrosome reaction using Annexin-V FITC. Archives of Anthology, 50, 273-285.
doi:10.1080/01485010490448741
[26] Cromer, B.A., Morton, C.J., Board, P.G. and Parker, M.W. (2002) From glutathione transferase to pore in a CLIC. Eu-ropean Biophysics Journal, 31, 356-364.
doi:10.1007/s00249-002-0219-1
[27] Ashley, R.H. (2003) Challenging accepted ion channel bi-ology: P64 and the CLIC family of putative intracellular an-ion channel proteins (Review). Molecular Membrane Biol-ogy, 20, 1-11.doi:10.1080/09687680210042746
[28] Harrop, S.J., DeMaere, M.Z., Fairlie, W.D., Reztsova, T., Valenzuela, S.M., Mazzanti, M., Tonini, R., Qiu, M.R., Jan-kova, L., Warton, K., Bauskin, A.R., Wu, W.M., Pankhurst, S., Campbell, T.J., Breit, S.N. and Curmi, P.M. (2001) Crys-tal structure of a soluble form of the intracellular chloride ion channel CLIC1 (NCC27) at 1.4-A resolution. The Jour-nal of Biological Chemistry, 276, 44993-45000.
doi:10.1074/jbc.M107804200
[29] Yang, J.Y., Jung, J.Y., Cho, S.W., Choi, H.J., Kim, S.W., Kim, S.Y, Kim, H.J., Jang, C.H., Lee, M.G., Han, J. and Shin, C.S. (2009) Chloride intracellular channel 1 regulates os-teoblast differentiation. Bone, 45, 1175-1185.
doi:10.1016/j.bone.2009.08.012
[30] Edwards, J.C. (2006) The CLIC1 chloride channel is regu-lated by the cystic fibrosis transmembrane conductance reg-ulator when expressed in Xenopus oocytes. Journal of Membrane Biology, 213, 39-46.
doi:10.1007/s00232-006-0059-5
[31] Lee, H.Y., Cui, X.S., Lee, K.A. and Kim, N.H. (2006) An-nealing control primer system identifies differentially ex-pressed genes in blastocyst-stage porcine parthenotes. Zy-gote, 14, 71-80.doi:10.1017/S0967199406003571 [32] Cui, X.S. and Kim, N.H. (2005) Polyamines inhibit
apop-tosis in porcine parthenotes developing in vitro. Molecular Reproduction and Development, 70, 471-477.
doi:10.1002/mrd.20228
[33] Pegg, A.E. (1988) Polyamine metabolism and its importance in neoplastic growth and a target for chemotherapy. Cancer Research, 48, 759-774.
[34] Stefanelli C, P.C., Tantini, B., Fattori, M., Stanic, I., Mack-intosh, C.A., Flamigni, F., Guarnieri, C., Caldarera, C.M. and Pegg, A.E. (2001) Effect of polyamine depletion on caspase activation: A study with spermine synthase-deficient cells. Biochemical Journal, 355, 199-206.
doi:10.1042/0264-6021:3550199
[35] Imai, A., Matsuyama, T., Hanzawa, Y., Akiyama, T., Tama-oki, M., Saji, H., Shirano, Y., Kato, T., Hayashi, H., Shibata, D., Tabata, S., Komeda, Y. and Takahashi, T. (2004) Sper-midine synthase genes are essential for survival of Arabi-dopsis. Plant Physiology, 135, 1565-1573.
doi:10.1104/pp.104.041699
[36] Kasukabe, Y., He, L., Nada, K., Misawa, S., Ihara, I. and Tachibana, S. (2004) Overexpression of spermidine synthase enhances tolerance to multiple environmental stresses and up-regulates the expression of various stress-regulated genes in transgenic Arabidopsis thaliana. Plant Cell Physiology, 45, 712-722.doi:10.1093/pcp/pch083
[37] Hardy, K. (1997) Cell death in the mammalian blastocyst. Molecular Human Reproduction, 3, 919-925.