SITE-DIRECTED SPIN-LABELLING OF PROTEINS FOR EPR SPECTROSCOPY:
APPLICATION TO PROTEIN COMPLEXES AND DEVELOPMENT OF NEW METHODS FOR CYSTEINE RICH PROTEINS
Stacey Bell
A Thesis Submitted for the Degree of PhD at the
University of St Andrews
2016
Full metadata for this item is available in Research@StAndrews:FullText
at:
http://research-repository.st-andrews.ac.uk/
Please use this identifier to cite or link to this item: http://hdl.handle.net/10023/8237
Site-Directed Spin-Labelling of Proteins for EPR
Spectroscopy: Application to Protein
Complexes and Development of New Methods
for Cysteine Rich Proteins.
Stacey Bell
This thesis is submitted in partial fulfilment for the degree of Doctor
of Philosophy at the
University of St Andrews
2
Time for a little acknowledgement…
First and foremost I would like to extend my gratitude to my Ph.D. supervisor Janet, for providing such stimulating problems to work on. For always motivating, asking insightful questions and for her invaluable advice throughout, I am forever grateful. During the course of my PhD, I have been very fortunate to attend several conferences, both in the U.K. and abroad, which would not have been possible without her support. Not only did these conferences expand my knowledge in the field of EPR and inspire my research, but also introduced me to the wider EPR community, with whom I made many great memories.
Throughout my PhD studies, I have been very fortunate to work with so many wonderful people, and form true friendships both in Edinburgh where it all began, and in St Andrews. To the ‘Chamberlain Street Massive’; Jenny, Lizzie, Marc and Ravi, who have been friends since day one, and my lab mates Andri, Claire and Lee, I wish nothing but the best for each of you. We’re all trying hard to find our own place in the world, but I take comfort in knowing we’ll always be friends.
A special thank you must go to Ashley. We have shared so many memories over the years and I really can’t put into words how comforting it’s been going on the PhD journey with your best friend.
Lastly, but always most importantly, I want to thank Mum & Dad, without whom none of this would be possible. Thank you for your endless love and support. Achieving anything in life is impossible without encouragement, and I have been blessed with the best support network anyone could hope for. From holding my hand on my first days at school, and throughout the PhD process, you have been with me every step of the way. Finishing your PhD really can be all consuming, but when necessary, I’m grateful to you for always being able to bring my mind back from science to the humanities.
To my mum Rose; my biggest supporter in my studies, and in life. Thank you for always having my corner, thank you for being my rock, and most importantly thank you for being my friend. To my dad Bobby, my hero; you’ve taught me the value of hard work and determination in achieving your goals, but most importantly you’ve taught me the importance in always being kind, and the simple beauty of laughter.
3
For Erin and For Orla.
4
Abstract
The work described in this thesis is an experimental study into the application of Electron Paramagnetic Resonance (EPR) Spectroscopy for the study of biological systems.
Using a variety of methods of site-directed spin-labelling (SDSL), this thesis aims to explore long range structure in an assortment of recombinant and native proteins, and complexes thereof.
The work described in this thesis covers all aspects of the work, from experimental design, molecular biology and cloning, protein expression and purification, as well as functional characterisation, and finally EPR distance measurements, data analysis and interpretation. Challenges and pitfalls will also be addressed.
Chapters 1 and 2 introduce EPR spectroscopy, and its application in the study of long range structure in biological systems. The experimental techniques employed throughout this thesis are also introduced.
Chapter 3 details an investigation into the complement C3b:factor H complex. This chapter addresses the challenges associated with the SDSL of cysteine rich proteins. Utilising hidden cysteine residues in native proteins for spin-labelling purposes will also be addressed.
Chapter 4 looks at the interactions of the human myosin regulatory light chain (RLC) with cardiac myosin binding protein C (cMyBP-C). Optimisation of expression and purification protocols will be the focus, as well as addressing issues with protein solubility and spin labelling efficiencies.
5
Declaration
I, Stacey Bell, hereby certify that this thesis, which is approximately 55,000 words in length,
has been written by me, and that it is the record of work carried out by me, or principally by
myself in collaboration with others as acknowledged, and that it has not been submitted in any
previous application for a higher degree.
I was admitted as a research student in October 2011 and as a candidate for the degree of
Doctor of Philosophy in September 2015, the higher study for which this is a record was
carried out in the University of St Andrews between 2013 and 2015.
Date …… signature of candidate ………
I hereby certify that the candidate has fulfilled the conditions of the Resolution and
Regulations appropriate for the degree of Doctor of Philosophy in the University of St Andrews
and that the candidate is qualified to submit this thesis in application for that degree.
6
Copyright Declaration
In submitting this thesis to the University of St Andrews I understand that I am giving
permission for it to be made available for use in accordance with the regulations of the
University Library for the time being in force, subject to any copyright vested in the work not
being affected thereby. I also understand that the title and the abstract will be published, and
that a copy of the work may be made and supplied to any bona fide library or research worker,
that my thesis will be electronically accessible for personal or research use unless exempt by
award of an embargo as requested below, and that the library has the right to migrate my
thesis into new electronic forms as required to ensure continued access to the thesis. I have
obtained any third-party copyright permissions that may be required in order to allow such
access and migration, or have requested the appropriate embargo below.
The following is an agreed request by candidate and supervisor regarding the publication of
this thesis:
Access to printed copy and electronic publication of thesis through the University of St
Andrews.
Date …… signature of candidate ……
7
Abbreviations
A280 Absorbance at 280nm
A412 Absorbance at 412nm
8
ddH2O double distilled Water
ddNTP any deoxyribonucleotide triphosphate DEER Double Electron Electron Resonance DMSO Di-methyl Sulfoxide DNA Deoxyribonucleic Acid DTNB 5,5’-dithiobis-(2-nitrobenzoic acid) DTT Dithiothreitol εACA ε-Amino Caproic Acid
E. coli Escherichia coli
EDTA Ethylenediaminetetraacetic Acid ELC Essential light chain of myosin ENDOR Electron Nuclear Double Resonance EPR Electron Paramagnetic resonance EtBr Ethidium Bromide EtOH Ethanol fB Factor B fH Factor H fI Factor I FPLC Fast Protein Liquid Chromatography FRET Forster Resonance Energy Transfer
G Gauss
9
hr hour(s) HRP Horse Radish Peroxidase HYSCORE Hyperfine Sublevel Correlation IEC Ion Exchange Chromatography IMAC Immobilised Metal Affinity Chromatography IPA Isopropanol IPTG Isopropyl β-D-1-thiogalactopyranoside
J Joules
10
NMR Nuclear Magnetic Resonance NTB 2‐nitro‐5‐thiobenzoicacid OD600 Optical density at 600nm
o/n overnight pAcPhe p-acetyl phenylalanine PBS Phosphate Buffered Saline PCR Polymerase Chain Reaction PDB Protein Data Bank PEG3350 Polythylene Glycol 3350
Pi Inorganic Phosphate pI Isoelectric Point pK propargyl lysine PMSF Phenylmethylsulfonyl Fluoride
P. pastoris Pichia pastoris
11
s/n supernatant SOB Super Optimal Broth SOC Super Optimal Broth (with catabolite repression) SPPS Solid Phase Peptide Synthesis T Tesla TBE Tris-Borate EDTA TBTA Tris(benzyltriazolylmethyl)amine TCEP Tris(2-carboxyethyl) Phosphine TE Thioester TED Thioester Domain TEMPO (2,2,6,6-TetraMethylPiperidin-1-yl)Oxyl – a small molecule containing a nitroxide radical Tet Tetracycline TEV Tobacco Etch Virus Tmelt primer melting temperature
12
Amino Acids
Alanine (Ala) A
Arginine (Arg) R
Asparagine (Asn) N
Aspartic Acid (Asp) D Cysteine (Cys) C
Glutamine (Gln) Q
Glutamic Acid (Glu) E
Glycine (Gly) G
Histidine (His) H
Isoleucine (Ile) I
Leucine (Leu) L
Lysine (Lys) K
Methionine (Met) M
Phenylalanine (Phe) F
Proline (Pro) P
Propargyl Lysine pK
Serine (Ser) S
Threonine (Thr) T
Tryptophan (Trp) W
Tyrosine (Tyr) T
13 List of Figures
Figure 1.1: The Electronic Zeeman Splitting Effect.
Figure 1.2: Near Isotropic 3 line Spectrum of 4-amino-TEMPO.
Figure 1.3: Spectral Simulations of a nitroxide radical (such as TEMPO), at X-band.
Figure 1.4: The Principle of the Hahn Spin Echo.
Figure 1.5: Schematic representation of the 3-pulse DEER sequence.
Figure 1.6: Schematic representation of the 4-Pulse DEER Experiment.
Figure 1.7: Chemical structure of the amino acid cysteine.
Figure 1.8: Structural composition of Pyrrolinoxyls, and SDSL of Cysteine Residues with MTSSL.
Figure 1.9: Chemical Structure of the unnatural amino acid p-acetyl-phenylalanine (pAcPhe).
Figure 1.10: Chemical structure of a cysteine-specific trityl radical.
Figure 1.11: Chemical structure of the UAA containing the 2,2,5,5-tetramethyl-pyrrolin-1-oxyl moiety.
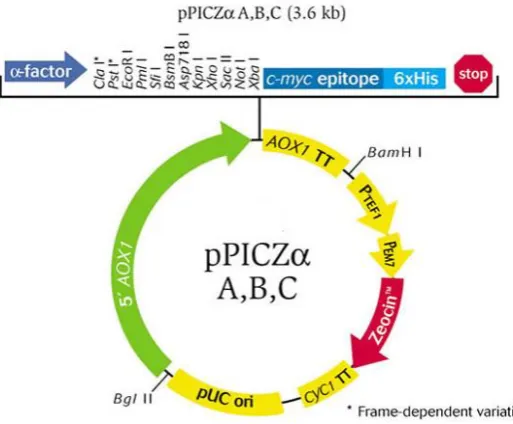
Figure 2.1: The pPICZαB vector. Figure 2.2: Ellman’s Assay Reaction.
Figure 2.3: L-cysteine calibration curves for determining free cysteine concentration.
Figure 2.4: Schematic Representation of the Fluid-Phase Cofactor Assay.
Figure 3.1: ‘Tick-Over’ Mechanism of the AP of Complement Activation. Figure 3.2: Conversion of Complement C3 to its activated form C3b.
Figure 3.3: Generalised Reaction Mechanism for the Reaction of a Nucleophile with the TE of C3.
Figure 3.4: Linker lengths and residues in Complement fH.
Figure 3.5: NMR derived three- dimensional cartoon representation of CCP 16 of fH in solution.
Figure 3.6: Schematic representation of a ‘bent back’ fH, showing distinct interaction sites for C3b. Figure 3.7: Crystal Structures of fH bound to C3b, shown as cartoons, with accompanying schematics.
Figure 3.8: Superposition of the X-Ray Crystal structure of fH1-4 bound to C3b, with fH19-20 bound to the TED of C3b.
Figure 3.9: Model for the interaction of full length fH with C3b.
Figure 3.10: Schematic representation of fH bound to Complement C3 – as shown in Figure 3.9.
Figure 3.11: MMM Simulations of the DEER Time Traces (I) and Distance Distributions (II) for fH/C3b complexes.
Figure 3.12: Confirmation of the presence of a cysteine residue in the fH1-4 construct, K247C.
Figure 3.13: SDS-PAGE Analysis of small scale test expression of the fH1-4 K247C mutant.
Figure 3.14: Confirmation of the presence of a hexa-Histidine tag onto fH1-4 K247C. Figure 3.15: SDS-PAGE Analysis of fH1-4 K247C Expression Tests.
Figure 3.16: SDS-PAGE and Western Blotting Analysis of Expression from a single fH1-4 K247C clone.
Figure 3.17: SDS-PAGE Analysis of the Elution of fH1-4 K247C from the Ni-NTA Superflow IMAC Cartridge.
Figure 3.18: Anion Exchange chromatography of fH1-4 K247C.
Figure 3.19: Size Exclusion Chromatography of the fH1-4 K247C Fragment.
Figure 3.20: Confirmation of the presence of a cysteine residue in the fH19-20 construct, G1107C.
Figure 3.21: SDS-PAGE Analysis of fH19-20 G1107C Expression Tests.
Figure 3.22: Example Fermentation Log from the Bioflo4500 Vessel.
Figure 3.23: Cation Exchange Chromatography of fH19-20 G1107C from 10 Litre Fermentation.
Figure 3.24: Reversible Oxidation of Cysteine to Cystine, visualised using Chemdraw ®.
Figure 3.25: Mechanism for reduction of a disulphide with DTT, visualised using Chemdraw®.
Figure 3.26: Mechanism for reduction of a disulphide bond with TCEP, visualised using Chemdraw ®.
Figure 3.27: SDS-PAGE Analysis of the reduction of fH19-20 G1107C with varying concentrations of DTT and TCEP.
14
Figure 3.29: Cation Exchange Chromatography of fH19-20 G1107C from Large Scale Flask Expression (Source 15 S).
Figure 3.30: Size Exclusion Chromatography of the fH19-20 G1107C Fragment.
Figure 3.31: X-band CW EPR of fH1-4 K247C and fH19-20 G1107C constructs.
Figure 3.32: X-Band CW EPR Spectrum of the fH1-4 K247C construct following freezing.
Figure 3.33: CW EPR spectra and SDS-PAGE analysis of fH1-4K247C (A&D), fH19-20 G1107C (B&E) and fH19-20 R1210C (C&F).
Figure 3.34: Anion Exchange Chromatography of Plasma C3 following PEG3350 Precipitation.
Figure 3.35: Anion Exchange Chromatography (Mono Q) of pooled C3 Fractions Following the QSFF Catchment Step.
Figure 3.36: Anion Exchange Chromatography (Mono Q) of Digested Plasma Purified C3, converted to C3b.
Figure 3.37: SDS-PAGE analysis of C3 Purification Troubleshooting.
Figure 3.38: Peptide Fingerprinting of the C3 α and β chains, as well as ceruloplasmin, following in-gel
digest.
Figure 3.39: Structure of Plasma Protein Ceruloplasmin showing the copper centres (orange spheres).
Figure 3.40: Anion Exchange Chromatography of C3 pool, following QSFF, and before treatment with the nucleophile methylamine.
Figure 3.41: Anion Exchange Chromatography of Methylamine treated purified C3 and its conversion to C3(N).
Figure 3.42: X-band CW EPR of spin-labelled C3b and C3(N).
Figure 3.43: Fluid-Phase Cofactor Assay.
Figure 3.44: Raw data from the EPR experiments taken for the spin labelled fH fragments in complex with either labelled or unlabelled C3(N).
Figure 4.1: Schematic Representation of Actin and Myosin Positioned in the Sarcomere.
Figure 4.2: Schematic Representation of the Thick Myosin Filament Structure.
Figure 4.3: Schematic Representation of the Actin-Myosin Interaction in Striated Muscle.
Figure 4.4: Schematic representation of cMyBP-C positioning in the C zone of the sarcomere, in relation to the thick and thin filaments.
Figure 4.5: Schematic representation of cMyBP-C showing features unique to the cardiac isoform, including the 3D NMR Structure of domain C0.
Figure 4.6: Cartoon depicting the current understanding of cMyBP-C Function.
Figure 4.7: Model for the arrangement of the N’ terminus of cMyBP-C around the myosin S1-S2
junction and the light chains.
Figure 4.8: SDS-PAGE Analysis Following Small-Scale Test Expression (100mL) of the C0 and RLC/MiniHMM Constructs.
Figure 4.9: Elution profile and corresponding SDS-PAGE analysis for the cMyBP-C Domain C0 Following IMAC.
Figure 4.10: Mass Spectrum of cMyBP-C, domain C0, performed at SIRCAMS, using FT–ICR mass spectrometry.
Figure 4.11: Schematic Representations of the Myosin Heavy and Light chains (A), zoomed in showing the MiniHMM Fragment, with bound RLC (B).
Figure 4.12: Crystal structure of human cardiac beta-myosin II S2∆.
Figure 4.13: Schematic representation of the Leucine Zipper motif.
Figure 4.14: Sequence of the original MiniHMM construct aligned with the modified MiniHMM.
Figure 4:15: SDS-PAGE Analysis Following Large Scale Expression and Purification of WT
RLC/MiniHMM Using IMAC.
Figure 4.16: Size Exclusion Chromatography elution profile (A) and SDS-PAGE analysis (B) for wt RLC/MiniHMM.
15
Figure 4.18: Structures illustrating the positioning of the RLC in the S2 junction, in the vicinity of the S1 heads.
Figure 4.19: MMM Simulations of the DEER Time Traces (I) and Distance Distributions (II) shown alongside PyMOL cartoons illustrating the site for cysteine mutagenesis.
Figure 4.20: Sequencing chromatograms, comparing the wt sequence to the sequence following SDM, showing successful substitution for cysteine in all cases.
Figure 4.21: SDS-PAGE analysis following purification of each of the Cysteine RLC/MiniHMM Mutants following IMAC.
Figure 4.22: SDS-PAGE analysis of the E88C RLC/MiniHMM Mutant, showing purification using IMAC and elution from the Ni-NTA following Histag Cleavage.
Figure 4.23: SDS-PAGE analysis of the TEV-treated K30C mutant following passage over the IMAC column.
Figure 4.24: Elution profile for the K30C RLC/MiniHMM mutant following SEC and resulting SDS-PAGE analysis.
Figure 4.25: CW EPR spectrum for the E88C mutant.
Figure 4.26: (A) SDS-PAGE analysis and (B) CW EPR spectrum for the E88C mutant. of the elution of the new E88C sample following IMAC.
Figure 4.27: Raw DEER data obtained from the RLC E88C mutant.
Figure 4.28: Schematic representation of the effect phosphorylation of the RLC has on the
RLC/MiniHMM complex.
Figure: 4.29: Schematic representations of the RLC/MiniHMM complex, showing how SDSL could be used to monitor dissociation of the S2 coiled coil upon phosphorylation of the RLC, both in the absence and presence of C0.
Figure 5.1: Schematic representation of mRNA processing at the ribosome, and resulting polypeptide synthesis.
Figure 5.2: X-Ray Crystal Structure of Sperm Whale Myoglobin.
Figure 5.3: Chemical Structures of (A) Lysine and (B) the UAA propargyl Lysine (pK), visualised using ChemDraw ®.
Figure 5.4: Confirmation of mutagenesis of S4C and S118C in sperm whale myoglobin.
Figure 5.5: Expression and purification of the Sperm Whale Myoglobin,S4CS118C mutant.
Figure 5.6: SDS-PAGE analysis following purification of the S4C Mutant following IMAC (A), shown alongside the elution profile (B) and resulting SDS-PAGE analysis following SEC (C).
Figure 5.7: SDS-PAGE analysis following purification of the S118C Mutant following IMAC (A), shown alongside the elution profile (B) and resulting SDS-PAGE analysis following SEC (C).
Figure 5.8: X-band CW EPR of myoglobin S4CS118C SL.
Figure 5.9: Confirmation of mutagenesis of S4pK and S118pK in sperm whale myoglobin.
Figure 5.10: SDS-PAGE Analysis of Small Scale Test Expressions OF the single pK mutants (A) S4pK and (B) S118pK.
Figure 5.11: SDS-PAGE analysis from large scale expression of the single mutants.
Figure 5.12: SDS-PAGE analysis from large scale expression of double pK mutant S4pKS118pK.
Figure 5.13: Reaction Mechanism for the copper catalyzed azide-alkyne cycloaddition of the pK containing peptide to spin label.
Figure 5.14: HPLC (Shimadzu) of the reaction mixture at t=0, 30, 90min using Phenomenex C18 column
150*4.60mM.
Figure 5.15: X-band CW EPR of the S4pK myoglobin Mutant.
Figure 5.16: X-band CW EPR of the S4pKS118pK myoglobin Mutant.
16
Figure 5.19: Chemical Structures of novel nitroxide spin labels (A) BMSL, (B) POMSL, and (C)
SLAsH. (visualised using ChemDrawTM).
Figure 5.20: XRC Structures of the (A) 14-3-3ϛ and (B) Vps75.
Figure 5.21: Elution profile (A) and SDS-PAGE (B) analysis of 14-3-3ϛ following the final purification step (SEC).
Figure 5.22: Elution profile (A) and SDS-PAGE (B) analysis of Vps75 following the final purification step (SEC).
Figure 5.23: CW EPR of labelled 14-3-3 ϛ with (A) MTSSL, (B) SLAsH and (C) BMSL.
Figure 5.24: DEER time traces and associated distance distributions for the S4CS118C doubly labelled Met-myoglobin mutant, shown alongside MMM simulation.
Figure 5.25: DEER time traces and associated distance distributions for the S4C singly labelled Met-myoglobin mutant to the ferric heme, shown alongside MMM simulation.
Figure 5.26: DEER time traces and associated distance distributions for the S118C singly labelled Met-myoglobin mutant to the ferric heme, shown alongside MMM simulation.
Figure 5.27: Schematic representation of the NOS homodimer with NOS CaM bound.
List of Tables
Table 1.1: Microwave bands found in commercial EPR spectrometers, with the static magnetic field required for resonance of a free electron.
Table 2.1: PCR Reaction Mixture for SDM.
Table 2.2: Programme used for Site-Directed Mutagenesis PCR.
Table 2.3: Final concentration of antibiotics for selection following E. coli transformation.
Table 2.4: Sequencing primers for pPICZα.
Table 2.5: Sequencing primers for T7 promotor and terminator.
Table 2.6: Programme used for Sequencing PCR.
Table 2.7: PCR Reaction Mixture for CCP Amplification.
Table 2.8: Programme used for fH CCP Amplification PCR.
Table 2.9: Programme used for PCR Colony Screen.
Table 2.10: Antibodies used for Blotting, company purchased from, and working dilution.
Table 3.1: Concentration of free cysteine in the fH19-20 G1107C samples following reduction, as determined by the Ellman's assay (DTNB).
Table 3.2: FH fragments yields following expression in P. pastoris, and purification.
Table 3.3: Summary of C3/C3b/C3(N) Yields following Isolation and purification From Plasma.
Table 3.4: Compositions of Samples analysed by DEER.
Table 4.1: Final Yields of RLC/MiniHMM Mutants per Litre of Cell Culture.
Table 5.1: Protein Yields for Myoglobin Mutants Per Litre of Cell Culture.
17
Table of Contents
Acknowledgement 2
Abstract 4
Declaration 5
Copyright Declaration 6
Abbreviations 7
Amino Acids 12
List of Figures 13
List of Tables 16
Table of Contents 17
Chapter 1: An Introduction to EPR Spectroscopy 25
1.1 Distance Measurements in Proteins 25
1.2 EPR Theory - The Static Spin Hamiltonian 26
1.2.1 The Electronic Zeeman Splitting Effect 26
1.2.1.1 The Spectroscopic g-factor 27
1.2.1.2 Resonance and the CW EPR Experiment 28
1.2.2 The Hyperfine Splitting 29
1.2.2.1 Spin Label Dynamics 30
1.2.3 The Electron Electron Interaction 32
1.2.3.1 Exchange Coupling 32
1.2.3.2 Dipolar Coupling 32
1.2.4 Zero-Field Splitting 32
1.2.5 Nuclear Quadrupole Interaction 32
1.2.6 Nuclear Zeeman Interaction 33
1.3 Obtaining Distances Between Paramagnetic Centres Using EPR Spectroscopy 33
1.3.1 Distance Measurements Using CW EPR Spectroscopy 34
1.4 Pulsed Methods of EPR Spectroscopy 34
1.4.1 Distance Measurements Using Pulsed EPR Techniques – DEER 35
1.4.1.1 3-Pulse DEER 36
18
1.4.2 Enhancing DEER Sensitivity - Solvent, Temperature, and Deuteration Effects 39
1.4.3 DeerAnalysis 40
1.5 Site-Directed Spin Labelling (SDSL) – Cysteine Substitution Mutagenesis 40
1.5.1 Cysteine Chemistry 41
1.5.2 Nitroxide-Radical Spin Labels 41
1.6 SDSL – Incorporation of Unnatural Amino Acids (UAAs) 43
1.6.1 Solid Phase Peptide Synthesis (SPPS) (Merrifield Coupling) and Semi- Synthesis 43
1.6.2 Expanding the Genetic Lexicon 44
1.6.2.1 Reprogramming Translation Using Orthogonal Ribosomes 44
1.6.2.2 Orthogonal Amino-acyl tRNA Synthetase/ tRNA Pairs 45
1.6.2.3 Incorporation of the UAA p-acetyl Phenylalanine (pAcPhe) in response to the amber Stop Codon 45
1.7 Simulation of DEER Data 46
1.7.1 Multiscale Modeling of Macromolecules (MMM) 46
1.7.2 Mtssl Wizard 47
1.8 Advancing the Field of Structural Biology 47
1.8.1 EPR Spectroscopy in the Study of Large and Flexible Soluble Proteins 47
1.8.2 EPR in the Study of Membrane Proteins 48
1.8.3 EPR as a Stand Alone Technique 49
1.9 Beyond in vitro EPR, and towards physiological conditions 49
1.9.1 Trityl and Spiro Radical Spin Labels 50
1.9.2 in vivo EPR Studies 51
1.10 Application of EPR in this Thesis 52
Chapter 2: Materials and Methods 53
2.1 Mutagenesis, Purification, and Manipulation of DNA for Transformation into Chemically Competent E. coli 53
2.1.1 Site – Directed Mutagenesis (SDM) 53
2.1.1.1 Designing Mutants Suitable for EPR 54
2.1.1.2 Primer Design 54
2.1.2 Transformation of Plasmid DNA into Chemically Competent E. coli Cells 55
2.1.3 Isolation and Purification of Plasmid DNA 56
2.1.3.1 Mini-Prep 56
19
2.1.3.3 Gel Extraction 57
2.1.4 Sequencing of Plasmid DNA 58
2.2 Mutagenesis, Purification, and Manipulation of DNA for Transformation into Electro-Competent P. pastoris 60
2.2.1 Amplification of specific CCPs from the full length codon optimised fH gene using PCR 60
2.2.2 DNA Agarose Gel Electrophoresis 61
2.2.3 Cloning of fH Fragments into pPICZαB Vector, Using Restriction Enzymes 61
2.2.3.1 Double Digest 62
2.2.3.2 Ligation of Digested Fragments into pPICZαB 62
2.2.3.3 PCR Colony Screen 62
2.2.4 Preparation of DNA for Transformation into P. pastoris 63
2.2.4.1 Phenol-Chloroform Extraction 63
2.2.4.2 EtOH Precipitation 64
2.2.5 Preparation of electro-competent P. pastoris cells 64
2.2.6 Electro-transformation of P. pastoris 65
2.3 Recombinant Protein Expression Using E. coli Expression Systems 65
2.3.1 Expression of RLC/MiniHMM Constructs 65
2.3.1.1 Cell Lysis of RLC/MiniHMM Constructs 66
2.3.2 Expression of Myoglobin Mutants and cMyBP-C Domain C0 66
2.3.2.1 Cell Lysis of Myoglobin Mutants and cMyBP-C Domain C0 by Sonication 67
2.3.3 Expression of 6xHis TEV Protease 67
2.3.3.1 Cell Lysis of 6xHis TEV Protease by Sonication 67
2.3.4 Expression of Myoglobin with the UAA pK Incorporated 67
2.3.4.1 Cell Lysis of Myoglobin containing the UAA, pK, 68
2.3.5 Expression of 14-3-3ϛ and Vps75 mutants 68
2.3.5.1 Cell Lysis of 14-3-3ϛ and Vps75 Mutants by Sonication 69
2.4 Recombinant Protein Expression Using the P. pastoris Expression System 69
2.4.1 The P. pastoris Expression System 69
2.4.2 Small-scale protein production 71
2.4.3 Large-scale protein production 72
2.4.4 Fermentation 72
20
2.5.1 Purification of 6xHIS TEV Protease Using IMAC 74
2.5.2 Purification of RLC/MiniHMM Constructs Using IMAC 74
2.5.2.1 Cleavage of the Histidine Tag 74
2.5.3 Purification of Wild Type, Cysteine and pK Containing Myoglobin Mutants and cMyBP-C Domain C0 using IMAC 75
2.5.3.1 Size Exclusion Chromatography 75
2.5.4 Purification of 14-3-3 ϛ Using IMAC 75
2.5.4.1 Size Exclusion Chromatography 76
2.5.5 Purification of Vps75 Using IMAC 76
2.5.5.1 Size Exclusion Chromatography 76
2.5.6 Purification of fH 1-4 K247C Fragment Using IMAC 76
2.5.6.1 Anion Exchange Chromatography 77
2.5.6.2 Size Exclusion Chromatography 77
2.5.7 Purification of fH19-20 G1107C Fragment Using SP Sepharose FastFlow Cation Exchange Chromatography Resin 77
2.5.7.1 Cation Exchange Chromatography 78
2.5.7.2 Size Exclusion Chromatography 78
2.6 Isolation and Purification of Complement Proteins From Human Blood/Plasma 78
2.6.1 Small-scale isolation of complement C3 78
2.6.1.1 Obtaining the Plasma Fraction from Whole Blood 79
2.6.1.2 Precipitation of Major Blood Proteins 79
2.6.1.3 Anion Exchange Chromatography – Q-Sepharose Fast Flow Resin 79
2.6.1.4 Anion Exchange Chromatography – Mono Q 79
2.6.1.5 Size Exclusion Chromatography 80
2.6.2 Large Scale Isolation of Complement C3 80
2.6.3 Conversion of C3 to C3b using Trypsin 80
2.6.4 Conversion of C3 to ‘C3 (N)’ – An Alternative to C3b 81
2.7 Protein Quantification 81
2.7.1 Sodium-Dodecyl Sulphate Polyacrylamide Gel Electrophoresis(SDS-PAGE) 81
21
2.7.3 Determination of Protein Concentration Using Absorbance A280 83
2.7.4 Determination of Protein Concentration Using the Micro-Bradford Assay 83
2.8 Protein Characterisation 84
2.8.1 Mass Spectrometry (MS) Analysis 84
2.8.2 Ellman’s Assay - For the Quantification of Free Cysteine 84
2.9 Protein Chemistry 86
2.9.1 SDSL of Incorporated Cysteine Residues 86
2.10 Functional Characterisation 87
2.10.1 Assessing Cofactor Activity of C3b, C3 (N) and fH1-4 K247C 87
2.11 EPR Spectroscopy 88
Chapter 3: The Complement Factor H (fH) – C3b Complex: An EPR Study 89
3.1 The Role of the Complement System in Innate Immunity 89
3.1.1 Mechanisms of Complement Activation 90
3.1.2 The Alternative Pathway of Complement Activation 90
3.1.3 Complement Activation – Driven by Conformational Change 91
3.1.4 Derivatization of Complement C3 – Labelling with Bio-Reporters 93
3.1.5 Regulators of Complement – fH 95
3.1.6 The fH-C3b Interaction 98
3.1.7 Aims of this work 101
3.2 Simulation of the DEER Experiment for the fH:C3b Complex Using MMM 103
3.3 Generation of Spin-Labelled fH1-4 K247C Fragment for EPR Studies, using the P. pastoris
Expression System 105
3.3.1 Mutagenesis 105
3.3.2 Small Scale Test Expression of fH K247C 105
3.3.3 The need for an Affinity Tag? 106
3.3.4 Mutagenesis – Incorporation of a C’ Histag onto fH1-4 K247C 107
3.3.5 Small Scale Test Expression of fH1-4 K247C 107
3.3.6 Large Scale Expression of fH1-4 K247C 108
3.3.7 Purification of fH1-4 K247C 109
22
3.3.7.2 Anion Exchange Chromatography (AEC) TricornTM Mono Q 4.6/100 PE 110
3.3.7.3 Size Exclusion Chromatography 111
3.4 Generation of a Spin-Labelled fH19-20 Fragment for EPR Studies using the P. pastoris Expression System 111
3.4.1 Mutagenesis 111
3.4.2 Small Scale Test Expression of fH19-20 G1107C 112
3.4.3 Fermentation of fH19-20 G1107C 113
3.4.4 Purification of fH19-20 G1107C Following Fermentation 114
3.4.4.1 SP-Sepharose FastFlowTM CEC Resin 114
3.4.5 Selection of an Appropriate Reducing Agent 115
3.4.6 Purification of fH19-20 G1107C Following Large Scale Flask Expression 119
3.4.6.1 SP-Sepharose FastFlowTM CEC Resin 120
3.4.6.2 Resource 15STM CEC 120
3.4.6.3 Size Exclusion Chromatography 122
3.5 Spin labelling of fH Fragments 1-4 K247C and 19-20 G1107C 122
3.6 Generation of Spin-Labelled C3b, Following Isolation and Purification of C3 126
3.6.1 Small Scale Isolation of C3/C3b 126
3.6.1.1 Q-Sepharose FastFlowTM AEC Resin 126
3.6.1.2 Anion Exchange Chromatography (AEC) – TricornTM Mono Q 4.6/100 PE 127
3.6.2 Conversion of C3 to C3b Using Limited Trypsin Digestion 128
3.6.3 Small Scale Isolation of C3/C3b – Troubleshooting 130
3.7 Generation of Spin-Labelled C3(N), an Alternative to C3b, following Isolation and Purification of C3 132
3.8 Spin labelling of C3b and C3(N) 135
3.9 Functional Characterisation – fI mediated cleavage of C3b and C3(N) in the presence of fH 136
3.10 The fH1-4. C3(N). fH19-20 Complex – An EPR Study 137
3.11 Outlook and Future Work 141
Chapter 4: Probing the Interaction of the Cardiac Myosin RLC with cMyBP-C Using EPR Spectroscopy 143
4.1 Muscle Contraction - The ‘Dance’ of Actin and Myosin, and regulation in the sarcomere 143
4.1.1 Cardiac Myosin Structure 145
23
4.1.3 Myosin Binding Protein-C (cMyBP-C) 147
4.1.4 The RLC-C0 interaction 151
4.1.5 Aims of this work 151
4.2 Small Scale Test Expressions of cMyBP-C C0 and RLC/MiniHMM 153
4.3 Expression and Purification of cMyBP-C Domain C0 154
4.4 Optimisation of Expression of the WT RLC/MiniHMM Complex 155
4.4.1 Modification of the MiniHMM Construct 156
4.5 Large Scale Expression of wt RLC/MiniHMM 157
4.5.1 IMAC of wt RLC/MiniHMM 158
4.5.2 Size Exclusion Chromatography of wt RLC/MiniHMM 159
4.6 Generation of Cysteine Mutants of the myosin RLC for SDSL Purposes 160
4.7 Simulation of the DEER Experiment for RLC/MiniHMM Cysteine Mutants 161
4.8 Generation of Cysteine Mutants of the myosin RLC for SDSL Purposes 164
4.9 Large Scale Expression and Purification of cardiac Myosin RLC Cysteine Mutants 165
4.9.1 Further Purification of K30C RLC/MiniHMM 167
4.10 Spin labelling of the E88C RLC/MiniHMM Mutant 169
4.11 DEER Measurements of E88C RLC/MiniHMM, with and Without cMyBP-C domain C0 170
4.12 DEER Measurements of E88C in High and Low NaCl 170
4.13 Outlook and Future Work 174
Chapter 5: Development of New Strategies for the Site-Directed Spin –Labelling of Cysteine Rich Proteins 177
5.1 The Limits of SDSL by Cysteine Substitution Mutagenesis 177
5.2 Site Directed Site Labelling via Reassignment of the Amber Stop Codon 178
5.2.1 Translation of mRNA into a Polypeptide at the Ribosome 178
5.2.2 Incorporation of Unnatural Amino Acids (UAAs) into Recombinant Proteins 180
5.3 Project Aims 180
5.4 Generation of Single (SC4 &S C118) and Double Cysteine (S4CS118C (or C4C118)) Myoglobin Mutants 183
5.4.1 Mutagenesis 183
5.4.2 Expression and Purification of the S4CS118C Myoglobin Mutant 184
5.4.3 Expression and Purification of the Single Cysteine Mutants S4C and S118C 185
24
5.5 Expression and Purification of Sperm Whale Myoglobin Mutants with the UAA, pK. 188
5.5.1 Mutagenesis 188
5.5.2 Small-Scale Expression of Myoglobin pK Single Mutants 189
5.5.3 Large Scale Expression and Purification of Myoglobin Single pK Mutants 190
5.5.4 Expression of the double mutant S4pKS118pK 191
5.6 Coupling of a Peptide Containing pK to an Azide Spin Label Using ‘Click’ Chemistry 192
5.7 Coupling of pK containing myoglobin to an azide spin label 194
5.7.1 From Peptide to Protein - Optimisation of Coupling 194
5.7.2 Spin Labelling of S4pK Using Copper Catalysed ‘Click’ chemistry 195
5.7.3 Spin Labelling of S4pKS118pK Using Copper Catalysed ‘Click’ chemistry 195
5.8 Confirmation of Spin Labelling of the S4pKS118pK mutant using Mass Spectrometry 196
5.9 DEER Experiments 197
5.10 Outlook and Future Work 199
5.11 A New Generation of Spin Label 202
5.11.1 Expression and Purification of the 14-3-3 ϛ and Vps75 Proteins 202
5.11.2 Spin Labelling of 14-3-3ϛ 204
5.12 Obtaining Nanometre Scale Distances Between the Ferric Heme of Sperm Whale Myoglobin and
Nitroxide Spin Labels Using DEER 205
5.12.1 Aims of this work 206
5.13 Expression and Purification of Low Spin (s= ½) Myoglobin Mutants 207
5.14 DEER Experiments 207
5.14.1 Nitroxide-Nitroxide DEER Measurements (S4CS118C) at W-Band 208
5.14.2 Nitroxide-Heme (FeIII) DEER Measurements at W-Band 209
5.15 Beyond MTSSL - Outlook and Future Work 211
Appendices 213
Chapter 1: An Introduction to EPR Spectroscopy
25
Chapter 1: An Introduction to Electron Paramagnetic
Resonance Spectroscopy (EPR) and its Application in
Measuring Nanometre (nm) Scale Distances in Proteins
1 An Introduction to EPR Spectroscopy
Understanding how proteins and their complexes interact at a three dimensional,
structural level is crucial in elucidating function. Obtaining distances between sites of
interest in proteins and complexes thereof offers further insight into such interactions.
This thesis aims to explore the application of EPR Spectroscopy, in particular the use
of Double Electron-Electron Resonance (DEER) Spectroscopy, in the study of
protein-protein interactions in large functional bio-macromolecular complexes.
The introduction to EPR spectroscopy is summarised by Atkins & de Paula, 2011, and
Brustolon & Giamello, 2009.
1.1 Distance Measurements in Proteins
Generally, spectroscopy can be defined as a measurement of the interaction of a given
material with electromagnetic radiation. Molecules, or atoms, have discrete states, each
of which has a corresponding energy. Spectroscopy can be used to measure and
interpret the difference between these energy states (∆E), gaining further insight into the
structural dynamics of the sample of interest. EPR is no exception, and involves the
application of microwave frequency electromagnetic radiation to activate and
specifically detect unpaired electrons.
Naturally occurring organic cofactors, e.g. flavin radicals, metal centres, e.g. copper,
and metal clusters, e.g. ferric heme, in proteins are held in a fixed orientation with
respect to the protein structure, and therefore are ideal spin probes, if paramagnetic.
Very often, however, the EPR spectra of metal centres and naturally occurring radicals
are too broad, and consequently very difficult to study by DEER (Bowen et al, 2013).
Alternatively, spin labels containing radicals which are sensitive to their local
environment can be incorporated site-specifically into proteins of interest, allowing
indirect molecular observations of the protein/complex under study, at precisely defined
Chapter 1: An Introduction to EPR Spectroscopy
26
Due to the relationship between the coupling of unpaired electrons and the distance
between them, one can collect several long range nm distance constraints between spin
labels. This allows one to yield global structural elements from proteins of interest, and
gain further insight into how the small pieces come together, and how this contributes to
overall biological function.
1.2
EPR Theory - The Static Spin Hamiltonian
These energy differences, ∆E, can be measured due to the relationship between ∆E
and the absorbance of electromagnetic radiation, as shown in equation 1.1
∆E = hν, (EQUATION 1.1)
where h is Plank’s constant (6.62607x10⁻³⁴ Js) and ν is the frequency of the radiation. The EPR spectrum of an unpaired electron in an external magnetic field B0, can be
described by a Hamiltonian of the form described in equation 1.2:
H0 = HEZ + HHFS + HEE + HZFS + HQ + HNZ(EQUATION 1.2)
where the above terms stand for the Electronic Zeeman Interaction (EZ), Hyper-Fine
Splitting (HFS), the Electron-Electron Interaction (EE), Zero-Field Splitting (ZFS), the
Quadrupolar Interaction(Q), and the Nuclear Zeeman Interaction (NZ), respectively.
The greater majority of the work undertaken in this thesis has been done so using spin
labels containing the nitroxide radical (NO.), with spin ½. For such spin systems the
HEZ, HZFS and HEE contributions are the most significant, although all contributions to
the spin Hamiltonian will be discussed.
1.2.1 The Electronic Zeeman Splitting Effect
Each unpaired electron has an intrinsic angular momentum, or ‘spin’, denoted S. Due
to the charge carried by each unpaired electron, the angular motion of this particle
generates a magnetic field, resulting in each unpaired electron displaying
paramagnetism when aligned with an external magnetic field (B0). The magnetic field,
B0, produces two energy levels for the magnetic moment, µ , of the electron, causing a
Chapter 1: An Introduction to EPR Spectroscopy
27
A single electron has a spin, S of ½, with magnetic components of ms ± ½, making it
doubly degenerate, and restricted to two positions, referred to as up and down. When an
external magnetic field is applied there is an absorption of energy, causing an EPR
transition from the lower energy state (when aligned in the same direction as the field
(ms= - ½)) to the higher energy state (when aligned against the magnetic field direction
(ms = +½)). This movement between energy levels is the Zeeman Splitting Effect, which
is illustrated in Figure 1.1.
Figure 1.1: The Electronic Zeeman Splitting Effect. Divergence of energy levels of discrete spin states with application of magnetic field for a S= ½ system.
The energies for an electron with magnetic moments ms ± ½ are given by equations 1.3
and 1.4, respectively
E +½ = ½ geβB0 (EQUATION 1.3).
and E -½ = - ½ geβB0 (EQUATION 1.4).
for each electron, µ = msgeβ, where β is a conversion constant called the Bohr magneton
(9.27401 x10⁻²⁴ J x T-1) and ge is the spectroscopic g-factor of the electron. The g factor
is a constant of proportionality, whose value is the property of the electron in a certain
environment.
1.2.1.1The Spectroscopic g-factor
In order to interpret EPR spectra of radicals incorporated into proteins, one must first
be able to compare the spectrum of the sample of interest with that of a free electron.
The g-factor of a dimensionless electron in space is 2.003192778 (~2.00). Combining
B0 = 0 B0≠0
E
n
e
rg
y
mS = +½
mS = -½
Chapter 1: An Introduction to EPR Spectroscopy
28
equations 1.3 and 1.4, in a magnetic field (B0) the energy levels of a free electron are
split by the following, equation 1.5:
∆E = hν = ge.β.B0 (EQUATION 1.5).
however, the magnetic moment of the nitroxide radical interacts with the external
magnetic field in a different manner than that of a free electron.
Therefore, on account of local magnetic fields induced in the specific molecular
framework of the nitroxide radical, the resonance condition is normally denoted by that
described in equation 1.6:
∆E = hν = g.β.B0 (EQUATION 1.6),
where g is equal to the g-value of the specific radical under study.
Typically, organic radicals have g-values of ~ 2.0027, inorganic radicals between
1.9-2.1, and paramagnetic d-metal complexes anywhere between 0 and 6. A
measurement of a system’s g factor yields some level of information about electronic
structure, although it does not give much in way of structural dynamics.
1.2.1.2Resonance and the CW EPR Experiment
By keeping the electromagnetic radiation frequency constant and scanning the
magnetic field, a peak in absorption will occur when the magnetic field tunes the two
spin states, so that the difference in energy, ∆E, matches the energy of the radiation.
This is called the field for resonance and is the technique used in Continuous Wave
(CW) EPR Spectroscopy. Typically for such experiments, in a 0.3 T static field, the
frequency, ν, of electromagnetic radiation required to cause an inversion of the
unpaired electron spin is about 9 GHz. This is often referred to as X-band frequency.
The application of a resonant microwave frequency magnetic field induces the
transitions between energy states, and is how CW EPR can be used to measure the
resonance. Electrons are not isolated, and can exchange energy with their
surroundings and with other spins in the system. Relaxation of the electron to its
ground state is crucial in understanding magnetic resonance, as the shape of the EPR
spectra obtained is determined by both the spin-lattice (T1) and spin-spin (T2)
Chapter 1: An Introduction to EPR Spectroscopy
29
Table 2.1 Microwave bands found in commercial EPR spectrometers, with the static magnetic field required for resonance of a free electron
Designation (band) ν (GHz) Field (T)
X-Band 9 0.3
Q-Band 35 1.0
W-Band 95 3.4
Historically, microwave frequencies are divided into bands, with most commercially
available EPR spectrometers operating at X, Q and W band, which are outlined in Table
1.1 with the corresponding magnetic field required for the resonance of a free electron.
At higher field, the spectral resolution of the nitroxide radical improves since the
Zeeman splitting increases with the applied magnetic field.
1.2.2 The Hyperfine Splitting
In order to interpret EPR spectra, one must take into account the effect that magnetic
nuclei have on the energy of the unpaired electron. In EPR, the hyperfine structure is the
result of the magnetic interaction between the electron spin, and the magnetic dipole
moments of the nuclei, in the radical under study. Generally a nucleus with spin, I, splits
the EPR spectrum into 2I+1 hyperfine lines. For a nitroxide radical (I=1), the EPR
spectrum consists of three lines of equal intensity (Figure 1.2), due to the three possible
spin orientations of the 14N nucleus.
Figure 1.2: Near Isotropic 3 line Spectrum of 4-amino-TEMPO. The nitroxide containing small molecule TEMPO is in double distilled H2O (ddH2O) (spectrum normalised to maxima).
3440 3460 3480 3500 3520 3540 3560
Magnetic Field (G)
int
e
n
s
it
y
1
0
in
te
n
Chapter 1: An Introduction to EPR Spectroscopy
30
In theory, the total energy absorbed by a sample is measurable, however, in practice
the noise component significantly obscures the resonance signal. For this reason, the
static magnetic field is modulated, and only the modulated part of the output voltage
detected. The output is therefore the detection of the first derivative of the absorption,
rather than the absorption itself, but with an enhanced signal to noise ratio. The
hyperfine structure of the EPR spectra is a basic fingerprint of this interaction from
which it is possible to gleam a host of information. Figure 1.2 shows the near isotropic
CW spectra of the nitroxide containing 4-amino TEMPO.
The hyperfine coupling has anisotropic components which influence the CW EPR
line-shape. A small molecule containing a nitroxide radical, such as TEMPO – see Figure
1.2, tumbling rapidly in solution has an average hyperfine splitting, typically of about
15G. The hyperfine anisotropy is due to the majority of the electron density being
distributed in molecular orbitals (p orbitals of the nitrogen lone pair), aligned parallel to
the molecular z axis of the paramagnetic moiety. Typically therefore Azz>Ayy,Axx and
this becomes evident for crystal or powdered samples.
Furthermore the hyperfine coupling, and consequently the CW EPR linewidth is
sensitive to variation from the spin label side chain sampling different water, protein
and lipid environments. Bordignon & Steinhoff, 2007 confirmed this with their studies
on solvent accessibility in membranes.
Generally as the polarity and proticity of the environment increases, so does the
hyperfine coupling, showing the potential for defining the topology of the spin label
side chain with respect to other proteins, as well as the identification of
water-membrane boundaries.
Characterising specific regions of proteins in terms of their polarity/proticity profiles,
as well as identifying hydrophobic barriers by monitoring changes in hyperfine
coupling, may provide means to obtain structural and topological detail of proteins, and
help elucidate further specific biological process.
1.2.2.1 Spin Label Dynamics
The appearance of the EPR spectrum changes as the motion of the radical is restricted,
and rotational correlation time increases due to the anisotropic nature of the hyperfine
Chapter 1: An Introduction to EPR Spectroscopy
31
EPR line-shape, as well as the effect of freezing. Restricted motion may be as a result of
a reduced tumbling rate due to attachment of the spin label to a particularly large
protein, or restriction of the label’s rotation through binding position, temperature
reduction or an increase in viscosity (Beier & Steinhoff, 2006).
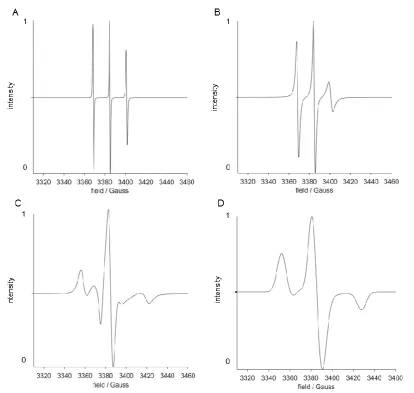
Figure 1.3: Spectral Simulations of a nitroxide radical (such as TEMPO), at X-band. Shows increasing correlation times, as simulated using the Easyspin Spectral Simulation Software (Chili and Pepper Functions) for MatLab® (spectra normalised to maxima). (A) correlation time of 0.1x10⁻⁹s, (B) correlation time of 1x10⁻⁹s, (C) correlation time of 10x10-9s, (D) simulated powder spectrum of a nitroxide (e.g. frozen).
Ideally, spin labels should produce an EPR spectrum that significantly broadens as its
motion is even slightly restricted. This is true for nitroxide spin labels, as we can see an
increased rotational correlation time from Figures 1.3A to 1.3C. Assuming total
[image:32.595.88.503.186.579.2]Chapter 1: An Introduction to EPR Spectroscopy
32
correlation time results in a broadening of the spectral lines due to an increased rigidity,
and more restricted motion of the spin label.
1.2.3The Electron-Electron Interaction
The interaction of two (or more) electrons results in a coupling of spin states. There
are two magnetic interactions that operate between two interacting unpaired electrons,
one being the isotropic exchange coupling interaction and the second the anisotropic
through space dipole-dipole interaction.
1.2.3.1 Exchange Coupling
The exchange interaction, characterised by the exchange coupling tensor, J, is
dependent upon the electric interaction between electrons, from a combination of
repulsion and overlapping of orbital densities. This interaction falls off exponentially as
the distance between interacting centres increases, assuming no orbital overlap.
1.2.3.2 Dipolar Coupling
The dipolar coupling interaction will be discussed in greater detail in 1.4. Briefly, the
dipolar coupling is the interaction between two magnetic moments, which for the
purpose of this thesis will be the magnetic moments between two interacting electrons
separated in space.
1.2.4 Zero-Field Splitting
The ZFS interaction is only relevant when applied to high spin systems, i.e. S > ½.
Zero-field splitting describes various interactions of the energy levels of an electron spin
in the absence of an applied magnetic field. The electrons couple to one another,
causing an energy level splitting called the ZFS. This can be very large, e.g. common
transition metal ions in biological systems, such as iron, have such large ZFS energies
that their spectra have still to be fully measured even at very high magnetic fields
(Bowen et al, 2013).
1.2.5 Nuclear Quadrupole Interaction
The Nuclear quadrupole interaction is analogous to the zero-field interaction, as these
Chapter 1: An Introduction to EPR Spectroscopy
33
possess an electrical quadrupole moment Q, arising from their non-spherical charge
distribution. This charge distribution then interacts with the electric-field gradient
produced by the electrons in the vicinity.
In EPR spectra, nuclear quadrupole interactions can cause a shift in resonance, and the
appearance of forbidden transitions, however, such effects are usually of the second
order and difficult to observe.
1.2.6 Nuclear Zeeman Interaction
This contribution is analogous to the electronic Zeeman, but addresses the coupling of
nuclear spins to the external magnetic field. For the most part, this can be considered
isotropic. This small energy contribution has little influence on EPR spectra, however,
may affect nuclear frequency spectra measured by EPR techniques, such as
Electron-Nuclear Double Resonance (ENDOR) Spectroscopy.
1.3
Obtaining Distances Between Paramagnetic Centres Using EPR
Distance determination across all methods of EPR relies upon the magnetic
dipole-dipole interaction between the magnetic moments µA and µB, of two spins A and B.For
the purpose of this thesis, the focus will be on dipolar interactions between pairs of
electrons, from which the distance between them can be resolved.
The energy of the dipolar interaction is a result of the change in Zeeman energy of the
observed spin A, due to the presence of the second spin, B. In the high field
approximation, the dipolar coupling to the external magnetic field dominates all other
contributions. Hence the dipoles align parallel to B0. The energy of the dipolar coupling
interaction is simplified to that shown in equation 1.7:
E= 𝜇0
4𝜋 1
𝑟3 (1 - 3cos
2 θ)
(EQUATION 1.7)
where µ0 is equal to the vacuum permeability constant, r is the distance between the
two unpaired electrons and θ is the angle formed by the applied field and the vector
connecting the unpaired electrons.
The θ value can give information on the orientation, (Prisner et al, 2015, Gophane et
al, 2014) however, this is not of interest for the work described in this thesis, where the
Chapter 1: An Introduction to EPR Spectroscopy
34
and limited g-value splitting at X and Q band, do not give much away in terms of
orientation.
1.3.1 Distance Measurements Using CW EPR Spectroscopy
CW EPR is most often applied to nitroxides whose powder spectra (i.e. static, e.g.
frozen) are dominated by the (inhomogeneous) broadenings from nitrogen hyperfine
interactions and g tensors (Bowen et al, 2013). The effect of dipolar coupling is a small
broadening effect, which can be extracted using deconvolution methods, (Rabenstein &
Shin, 1995) or multi-parameter fits (Hustedt et al, 1997) and from the dipolar coupling
interaction, distances can be determined.
CW EPR is practical for the measurement of short distances of ~ 0.8nm up to a
maximum of 1.5-2.0nm, with those distances less than 1.5nm being the most reliable
(Banham et al, 2008). For protonated spin labels, the inhomogeneous line broadening
(in part due to unresolved hyperfine coupling) obscures dipolar broadening for distances
in the 1.5-1.7nm range resulting in lower distance resolution.
With increasing distance between paramagnetic centres, it becomes progressively
more difficult to measure the dipolar interaction with CW EPR as an effect on line
broadening, as the coupling strength becomes comparable to the linewidth. To extend
this limit, with respect to CW EPR, the spin label can be deuterated (de Vira et al, 2015)
or trityl spin labels may be used as an alternative to nitroxides. Due to the much
narrower line-shape of trityl radicals (Kunjir et al, 2013) inter-spin distances can be
accurately measured from the CW EPR spectrum up to ~2.4nm (Reginsson et al, 2012).
1.4 Pulsed Methods of EPR Spectroscopy
Unlike CW EPR spectroscopy, where the microwave frequency is kept constant
throughout, pulsed methods of EPR spectroscopy apply a series of microwave pulses, in
order to refocus the broadening that occurs in spectra obtained from CW EPR, and
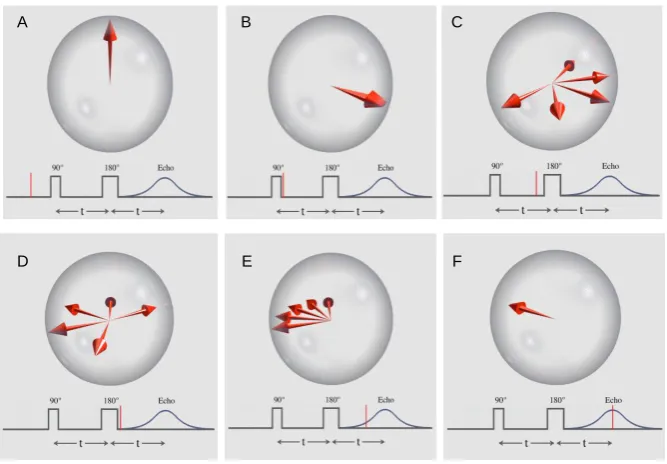
collect more high resolution data. The Hahn echo pulse set (π/2-τ-π-τ) is the basis for
Chapter 1: An Introduction to EPR Spectroscopy
[image:36.595.133.467.97.329.2]35
Figure 1.4: The Principle of the Hahn Spin Echo. (A) The vertical red arrow is the average magnetic moment of a group of spins. All are vertical in the vertical magnetic field and spinning on their long axis, but this illustration is in a rotating reference frame where the spins are stationary on average. (B) A 90° (π/2) pulse is applied that flips the arrow into the horizontal plane. (C) Due to local magnetic field inhomogeneity some spins slow due to lower local field strength while some speed up due to higher field strength. This makes the signal decay. (D) A 180° (π) pulse is applied so that the slower spins lead ahead of the main moment and the fast ones trail behind. (E) The fast moments catch up with the main moment and the slow moments drift back toward the main moment. (F) Complete refocusing has occurred and at this time, an accurate T2 echo can be measured.
Pulsed methods of EPR spectroscopy come in many flavours. Electron Nuclear Double Resonance (ENDOR) and Hyperfine Sublevel Correlation Spectroscopies
(HySCORE) are just two pulsed methods of EPR spectroscopy that can be used to probe
the environment surrounding paramagnetic centres.
For more on other pulsed EPR methods see Borbat & Freed, 2013. However, the
focus of this thesis is the use of DEER spectroscopy in obtaining nm scale distance
measurements between paramagnetic centres, based on the dipolar interactions between
them.
1.4.1 Distance Measurements Using Pulsed EPR Techniques - DEER
Whilst CW EPR is used for accurate distance determination of the shortest distances,
it is the pulse techniques which allow access to long range distance distributions, more
synonymous with large functional biological complexes. The focus of this thesis is the
A B C
Chapter 1: An Introduction to EPR Spectroscopy
36
use of DEER for studying the structure of biomolecules on the nanoscale, by measuring
the dipolar coupling between paramagnetic centres.
Using DEER, the dipolar couplings are isolated by suppression of the hyperfine
couplings, allowing longer range distance measurements to be obtained. Until recently
the often quoted range for DEER distance measurements was 1.5-8nm (Tsvetkov &
Grishin, 2009) (Gunnar Jeschke, 2012), however recent work by El Mkami (2014) and
co-workers have pushed the limits to a theoretical maximum of 13nm.
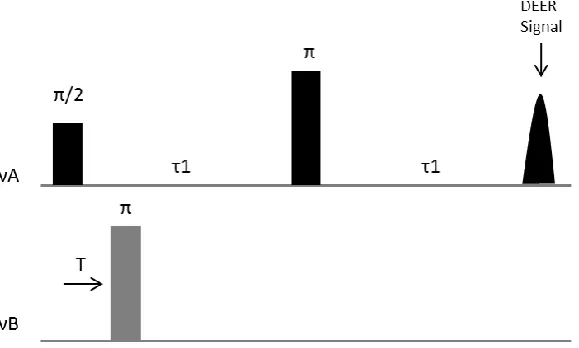
1.4.1.1 3-Pulse DEER
The constant time 3-Pulse DEER sequence (shown in Figure 1.5) was initially used to
gain further insight into molecular distribution by Milov et al, 1981.
Figure 1.5: Schematic representation of the 3-pulse DEER sequence. Observer and pump pulses shown at frequencies A and B (νA, νB).
Application of the π pulse at νB, between the Hahn Echo pulse sequence (π/2, π)
causes a focusing of the electrons coupled to the observer spins. At time T, the local
field at the A spins (in resonance with νA) is altered. T is incremented, and the extent of
coupling determines the modulation period.
However, the start of the DEER time trace is usually distorted due to application of
the pump pulse, at νB, at the same time as the first observer pulse, π/2, at νA.
Consequently, the complete shape of the dipolar spectrum is not recovered, leading to a
‘dead-time’, which proves detrimental if distance distributions are broad (Lovett et al,
[image:37.595.162.452.308.482.2]Chapter 1: An Introduction to EPR Spectroscopy
37
4-Pulse DEER, although less sensitive than 3-pulse DEER, is commonly used in
measuring distance distributions in structural biology investigations, where broad
distance distributions are more commonplace.
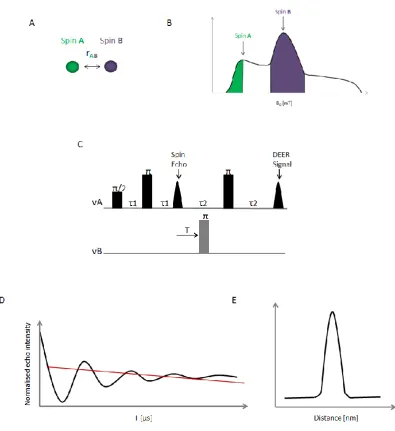
1.4.1.2 4-Pulse DEER
The four pulse DEER technique provides a dead-time-free method for measuring the
frequency of the dipolar coupling interactions and is the chosen method used in this
thesis.
For a two spin system containing spins A and spin B, both from nitroxide radicals, the
spins are differentiated by exciting different parts of the nitroxide spectrum, using two
very different microwave frequencies (νA and νB), as illustrated in Figure 1.6B and 1.6C.
A two-pulse Hahn echo sequence is employed to selectively monitor the intensity of
the echo (Figure 1.6C), ν(T), of the paramagnetic species A, at frequency νA, in
resonance with spins A. This particular pulsed sequence generates a refocused echo
after the last delay, τ2, which is the measurable DEER signal. The π pulse at microwave
frequency νB, applied during the time interval T, often referred to as the pump pulse,
then excites spins B, in resonance with frequency B, νB. This introduces a coupling
between spins A and B.
Using the two microwave frequencies νA and νB, and keeping the refocused echo at a
fixed position in the time domain, strongly suppresses the hyperfine interactions. The
time T, at which the pump pulse is applied, is incremented, resulting in an increase or
decrease in the intensity of the refocused echo. The frequency of this oscillation, νAB,
Chapter 1: An Introduction to EPR Spectroscopy
[image:39.595.104.500.84.516.2]38
Figure 1.6: Schematic representation of the 4-Pulse DEER Experiment. (A) For a two spin system, the distance between Spin A (green sphere) and Spin B (purple sphere) is denoted rAB. (B) Field sweep
spectrum of a nitroxide at X-band, illustrating where in the spectrum Spins A and Spins B are excited (green and purple respectively). (C) The dead-time free 4 pulse DEER sequence. (D) The four pulse DEER time trace (black line) together with the fitted intermolecular background decay (red line). (E) Background corrected distance distributions rAB obtained following Tikhonov regularisation of the DEER
time trace (Jeschke 2006).
Due to potential intermolecular spin-spin interactions, there may be an exponential
decay of the DEER signal. These interactions are the background contribution (as
shown in Figure 1.6D), and so the DEER trace obtained must first be background
corrected, in order to obtain an accurate representation of the intramolecular spin-spin
Chapter 1: An Introduction to EPR Spectroscopy
39
and 200µM will minimise this contribution, whilst ensuring sensitivity. For the
experiments performed throughout, a final sample of ~80µL is required.
1.4.2 Enhancing DEER Sensitivity - Solvent, Temperature and Deuteration Effects
Typically, DEER experiments are conducted at temperatures in the range of 50K, with
the protein solution forming a frozen glass. At 50K, one of the major factors
contributing to the persistence of an echo, and therefore the sensitivity and measureable
distances between spin labels, is the electron spin echo dephasing time, TM.
Due to the cryogenic temperatures involved, cryo-protectants are required to prevent
ice crystal formation and protein aggregation, which can leads to a dramatic decrease in
the TM, therefore seriously compromising the signal to noise ratio (S de Vera et al,
2015).
Due to relatively short TM (Ward et al, 2010) when measuring proteins, it is standard
practice to deuterate the solvent in which the proteins are present, which slows
relaxation and extends the range of distance measurements and level of sensitivity
(Huber et al, 2001).
In a non-deuterated environment, short spin echo dephasing times – between 2-4µ
s-would only allow for distances in the 3-4nm range, with limited sensitivity (El Mkami
et al, 2014), however, deuteration of the solvent can significantly increase the TM in the
5-6µs range (El Mkami et al, 2014). This was demonstrated by Banham et al, 2006, in
the study of a von Willebrand factor domain, where deuteration of the solvent matrix
(60% D2O, 40% deuterated glycerol), doubled the TM, compared to the protonated
sample, extending the dipolar evolution time to 6µs, allowing distances in the 6.8nm
range.
It is quoted throughout the literature that the upper distance limit for measuring using
EPR spectroscopy is 8nm (Gunnar Jeschke, 2012). However, full deuteration of not
only the sample, but the protein itself (if expressed in deuterated conditions) has the
potential to increase TMs, therefore allowing access to longer distances. This was
demonstrated beautifully by Bowman et al, 2014 in their work on the histone chaperone
proteins Vps75 and NapI.
Using entirely deuterated samples, a distance of 10.2nm was obtained, a record for