ISSN Online: 2164-2753 ISSN Print: 2164-2745
DOI: 10.4236/jasmi.2019.93005 Sep. 5, 2019 43 Journal of Analytical Sciences, Methods and Instrumentation
Quantitative Measurement of the Exposure
Response of Digital Cameras
Caitlin R. Kunchur
Dutch Fork High School, Irmo, SC, USA
Abstract
Digital cameras span a large range in price and performance. Consumers of-ten focus mainly on the resolution in pixels when shopping for a camera. Of equal importance is the quality of the optics and the exposure response. Digi-tal cameras generally have a linear exposure response, but the amount of noise and the dynamic range vary. It is difficult to obtain quantitative infor-mation on these parameters to make an informed assessment. This work ex-plores and demonstrates first-principles methods to measure the exposure response to make meaningful comparisons between different camera models. It also shows how to make the most of a particular camera by measuring its noise level and dynamic range, to understand the limits of its useable ISO amplification. The methods only require a computer and free software to download images and extract their RGB pixel values. The analysis, based on the RGB values, uses standard spreadsheet software. The procedures are therefore accessible to anyone with a digital camera and computer, and will help to reduce speculation in comparing cameras, and help consumers make an informed decision.
Keywords
Photography, Image, Imaging
1. Introduction and Background
1.1. Photographic Parameters
A picture represents a scene by recording the different levels of luminance LV (scene brightness) and colors at different locations. Light from the scene is con-verged with a lens onto an electronic sensor (in an analog camera, the film is the “sensor”). The aperture (hole) in the lens through which the light goes controls the illuminance, EV (image brightness expressed by power per unit area). The ra-How to cite this paper: Kunchur, C.R.
(2019) Quantitative Measurement of the Exposure Response of Digital Cameras. Journal of Analytical Sciences, Methods and Instrumentation, 9, 43-50.
https://doi.org/10.4236/jasmi.2019.93005
Received: August 13, 2019 Accepted: September 2, 2019 Published: September 5, 2019
Copyright © 2019 by author(s) and Scientific Research Publishing Inc. This work is licensed under the Creative Commons Attribution International License (CC BY 4.0).
http://creativecommons.org/licenses/by/4.0/
DOI: 10.4236/jasmi.2019.93005 44 Journal of Analytical Sciences, Methods and Instrumentation tio of the focal length to the aperture diameter is called the aperture valueAV (also called f-number or f-stop). The relationship between EV and AV is given by:
2 1
V V
E ∝ A (1) A camera’s shutter opens to let in light for a controlled period called the time valueTV (also called the exposure time or shutter speed). LV, AV, and TV together control the light energy falling on the sensor per area called the radiant exposure H (also called the luminous exposure or photometric exposure):
2
V V V V
H T E= × ∝T A (2)
The radiant exposure should remain constant for different AV and TV values as long as the ratio 2
V V
T A is kept constant. This is called the reciprocity prin-ciple. The camera amplifies H by a factor proportional to the ISO setting, and stores it as a binary number, the camera exposureC, for each pixel. Thus we ex-pect:
C H∝ (3) and
ISO
C∝ (4) For the 8-bit jpeg images used in this work, C can have values between 0 and (28 − 1) = 255. Further background on photographic parameters can be found in [1] [2] [3] and [4].
1.2. Digital Imaging
Digital cameras achieve imaging by having a mosaic of pixels, each of which contains a photo circuit that produces a voltage representing the light energy re-ceived by that pixel. We will concentrate here on the CMOS (complementary metal oxide semiconductor) type of sensor, which is currently the most common type and has replaced the CCD (charge-coupled device) in most consumer cam-eras. Figure 1 shows an example of a simplified functional diagram for what happens in a single pixel’s photo circuit leading to its camera exposure value be-ing stored in the camera’s memory.
[image:2.595.218.530.572.693.2]Before exposure, the upper switch (which is also a transistor) closes momen-tarily to charge the gate electrode of a MOSFET (metal oxide semiconductor
DOI: 10.4236/jasmi.2019.93005 45 Journal of Analytical Sciences, Methods and Instrumentation field effect transistor), which behaves like one plate of a capacitor. The reverse biased photodiode is almost non-conductive when no light shines on it, so that the charge sits on the MOSFET gate until exposure begins. Then, photoelectrons are excited and make the diode conductive causing charge to leak away, reducing the gate voltage. The total charge that leaks away and the lowering of the gate voltage is proportional to the light energy that falls on the pixel. Before the ex-posure, the gate at full voltage pinches off the MOSFET cutting off the current through it. As the gate voltage VG falls with exposure, the MOSFET begins to conduct and the current through the resistor and its voltage VR increase. Thus
VR is proportional to the light energy collected by the pixel. This is now ampli-fied (ISO amplification), digitized, and stored along with the values for the other pixels that make up the image.
For determining color, each pixel has sub-pixels for each of the three primary colors: red (R), green (G), and blue (B), resulting in a set of three camera expo-sure values CR, CG, and CB for each pixel. Ideally, C H∝ , but there is an upper limit Hmax above which C stops increasing. This happens when all the charge stored on the MOSFET’s gate (Figure 1) leaks away. Then VG drops to its min-imum value and VR saturates to its maximum value. There is also a minimum value Hmin below which noise and dark current leakage through the photodiode start to cover up differences in H. The usable range Hmin to Hmax expressed as a ratio is the dynamic range (DR):
max min
DR=H H (5)
DR may be represented in terms of stops n, where Hmax/Hmin = 2n. Within their DR, digital cameras are fairly linear, i.e., C H∝ . The sensitivity of the camera and ability to image in low light using high ISO is limited by its noise. Thus the DR and noise represent two important parameters of a digital camera. Further background on photographic sensors can be found in [5] and [6].
2. Methods
Two DSLR (digital single lens reflex) cameras were used in these experiments: a Canon Rebel XSi12-mega-pixel consumer level DSLR (with a 55 mm lens) and a Canon 6D20-mega-pixel professional DSLR (with an 85 mm lens). The cameras were mounted on a tripod pointing straight at a white piece of paper illuminated by a uniform source of incandescent lighting. The camera lens was focused at in-finity to blur the image and further even out the illuminance over the entire view. At the beginning, an image of the paper was taken and this was set as the custom white balance. For the starting point of some experiments, the meter in the camera was used to determine the “correct” exposure, which appears to be near the middle of the DR with a camera exposure value of C ≈ 255/2.
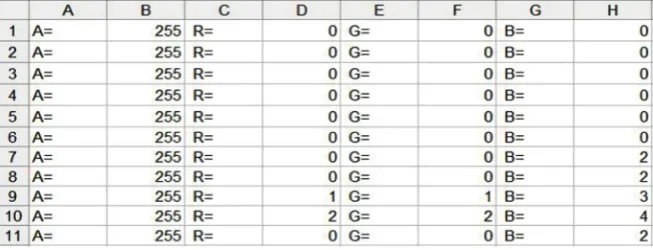
DOI: 10.4236/jasmi.2019.93005 46 Journal of Analytical Sciences, Methods and Instrumentation indicated the average camera exposure and the standard deviation indicated the noise. An example of the first few rows for a sample spreadsheet is shown in Figure 2.
Four experiments were conducted on both cameras as explained below.
2.1. Reciprocity
For testing reciprocity, the ISO was set to 100 and the time value was set to 1/8 s, which is in the middle of the 18 stops of TV available on both cameras. Using this time value, a picture was taken at the aperture value that resulted in a correct exposure as indicated by the camera’s meter. Keeping the ISO fixed, pictures were taken at different combinations of aperture and time values while keeping the exposure correct as indicated by the camera (which tries to satisfy Equation (2)). The actual camera exposure values obtained from the images were then compared to see if they were in fact constant for all the exposures.
2.2. Camera Exposure Dependency on ISO
For testing how the camera exposure depends on ISO, the ISO was set to 100, the aperture value was set to the largest setting (smallest hole) and the time value to 2.5 stops below the correct exposure to allow room for growth and to be able to see a larger range of camera exposures achieved by changes in ISO. Pictures were taken while increasing the ISO from 100 to 1600. The measured camera expo-sures were then plotted versus ISO to see how linearly the ISO amplifier works (Equation (4)).
2.3. Exposure Response Curve
[image:4.595.212.539.558.683.2]The exposure-response curves were measured at the highest ISO value of 1600 (common to both cameras) where noise becomes more apparent. TV was first set to the middle value of 1/8 s and AV was adjusted so that a correct exposure was indicated by the camera’s meter. Now the AV and ISO were kept fixed and pic-tures were taken at every TV stop (1/4000, 1/2000, 1/1000, 1/500, 1/250, 1/125, 1/60, 1/30, 1/15, 1/8, 1/4, 1/2, 1, 2, 4, 8, 15, 30 s). The measured camera exposures C
DOI: 10.4236/jasmi.2019.93005 47 Journal of Analytical Sciences, Methods and Instrumentation were then plotted versus TV, which is proportional to the radiant exposure (Equ-ation (2)) to see the exposure response curve (Equ(Equ-ation (3)).
2.4. Dark Exposure and Noise
If the same amount of light energy falls on two pixels (i.e. they receive the same radiant exposure H) then the camera should record the same camera exposure C
for these pixels. However, the presence of noise will cause C to depend irregu-larly on H. This noise was measured by taking the standard deviation in C for all pixels, which have received the same H. The noise will be most noticeable if H = 0, i.e. for a dark exposure. These dark exposures were taken in a dark room, with the lens cap on, while keeping AV at its highest setting (AV = 38 for the Rebel and
AV = 22 for the 6D), so that no light energy reached the sensor. The standard deviation in C for each color was calculated to determine the level of noise.
3. Data and Analysis
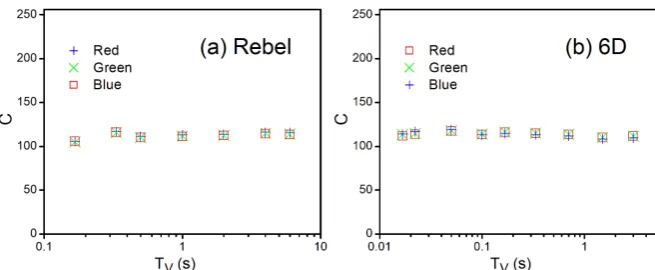
Figure 3 shows results of the reciprocity test as per the procedure described above. Both cameras have an excellent reciprocity (constant camera exposure for a variety of AV and TV combinations that satisfy 2
V V
T A ≈ constant). Notice that the white balance is well maintained as well (no separation of R, G, and B data points). In this respect, the professional 6D camera shows no advantage over the Rebel.
Figure 4 shows results of the dependence of the camera exposure on ISO. Here the radiant exposure (energy captured) is kept constant by keeping TV and
[image:5.595.211.539.504.639.2]AV fixed. The ISO setting changes the gain after the sensor. As can be seen, there is an almost linear relationship and the two cameras have similar performances. The tops of the graphs start to saturate as they approach 255, which is the max-imum value that C can have.
Figure 5 shows the complete exposure response (dependence of the camera
Figure 3. Reciprocity behavior. Camera exposure (C) is plotted against the time value (TV). (a) Canon RebelXSi (ISO = 100). The settings for the data points (left to right) are the following: TV = 1/6, 1/3, 1/2, 1, 2, 4, 6 s and AV = 5.6, 8, 11, 16, 22, 32, 38. (b) Canon 6D (ISO = 100). The settings for the data points (left to right) are the following: TV = 1/60, 1/45, 1/20, 1/10, 1/6, 1/3, 7/10, 1.5, 3s and AV = 1.8, 2, 2.8, 4, 5.6, 8, 11, 16, 22. The
TV and AV combinations satisfy 2
V V
DOI: 10.4236/jasmi.2019.93005 48 Journal of Analytical Sciences, Methods and Instrumentation Figure 4. ISO response. Camera exposure (C) is plotted against the ISO value while TV = 1/30 s and AV = 5.6 are kept constant. (a) Canon Rebel XSi. (b) Canon 6D.
Figure 5. Exposure response: camera exposure versus time value for the (a) Canon Re-belXSi (set at ISO = 1600 and AV = 19) and (b) Canon 6D (set at ISO = 1600 and AV = 22). The two horizontal lines represent saturation (C = 255) and noise. The vertical lines represent the corresponding minimum and maximum of the TV range. The ratios of these
TV values give dynamic range (DR) values of 7.8 and 9.4 for the two cameras respectively.
exposure on the radiant exposure) for both cameras at a fixed ISO = 1600. Here
H was varied as per Equation (2) by changing TV while keeping AV constant. The responses have a large central linear portion. The curves saturate at the top when all the gate charge on the MOSFET (Figure 1) has been drained by the photodi-ode. This corresponds to the maximum value of C = (28 − 1) = 255 as discussed earlier. The lowest value would have been C = 0 if there had been no noise. In-stead, the responses saturate to constant values (C = 1.8 for the Rebel and C = 0.5 for the 6D) corresponding to their noise levels. The issue of noise and its de-termination is discussed in more detail below. The intersections of the slanted line (linear fit to the 5 middle datapoints) with the upper horizontal line (drawn at the maximum possible value of C = 255) and lower horizontal line (drawn at the noise level whose measurement is described below) are used to define the usable dynamic range. The much lower noise level of the 6D gives it a more ex-panded DR = 9.4 compared to the Rebel’s DR = 7.8. Thus the 6D will be partic-ularly superior when shooting in low light because of its low noise level and when shooting scenes that have a large luminance (scene brightness) range.
DOI: 10.4236/jasmi.2019.93005 49 Journal of Analytical Sciences, Methods and Instrumentation Figure 6. Dark exposures and noise: the graphs show the noise (standard deviations in camera exposure values for pixels when no light reached the sensor) plotted against the time value of the exposures for the (a) Canon Rebel and (b) Canon 6D.
methods section, these are dark exposures so that no light energy fell on the sensor. However, even without light, the photodiode conducts because of ther-mal energy. This is referred to as the dark current and it leads to a camera expo-sure that is proportional to the time value. Two other sources of noise are read noise in the sensor and the circuit noise that comes after the ISO amplifier. These will lead to randomness in the C values between different pixels. Quanti-tatively, the noise was taken to be the standard deviation σC in camera exposure values for different pixels. Of these three components of noise, the dark current and read noise coming before the ISO amplifier will appear to increase with ISO. Of those two, only the dark current component will depend sensitively on time value and it will have a smaller contribution at short time values. There can also be a few defective “hot pixels” that have fixed positions and will be part of the pre-ISO noise. A general discussion of noise can be found in [8] and [9]. The plotted σC was the average of the σC values for the three colors.
From the graphs, it appears that the Canon 6D has very little sensor read noise (almost no dependence on ISO at short time values) and the noise level is a fac-tor of 5 lower than the Canon Rebel. At ISO = 100, dark current noise starts to increase beyond TV ≈ 100 s for both cameras. Circuit noise after the ISO am-plifier (dominant at low ISO and TV) is about twice as much in the Rebel as in the 6D. Thus the two cameras should perform similarly for pictures taken at low ISO, short TV < 30 s, and for bright scenes. The advantage of the more advanced 6D camera will become apparent for pictures taken at high ISO in low light.
4. Summary and Conclusion
re-DOI: 10.4236/jasmi.2019.93005 50 Journal of Analytical Sciences, Methods and Instrumentation quire no special equipment and use free or readily available softwares, allowing any consumer to quantitatively compare digital cameras, and find the best com-bination of settings of AV, TV, and ISO for a particular camera and photographic situation. It was not possible to find comparable information on these or other cameras published in the literature or the internet, including Canon’s own
https://www.usa.canon.com/ website. This work, therefore, provides new
infor-mation and an objective approach to evaluate other digital cameras. An inter-esting future experiment would be to measure the noise at various temperatures. The dark current increases with temperature; hence a more advanced DSLR might be needed if shooting is mostly done in a warmer climate, especially at high values of ISO and TV.
Acknowledgements
I would like to acknowledge M. N. Kunchur, A. Jurgens, and the anonymous re-feree.
Conflicts of Interest
The authors declare no conflicts of interest regarding the publication of this pa-per.
References
[1] Long, B. (2018) Complete Digital Photography. 9th Edition. CDP Press, Boston. [2] Birnbaum, H. C. (1998) Existing-Light Photography (Kodak Workshop Series, Book
17). Silver Pixel.
[3] Allen, E. and Triantaphillidou, S. (2010) The Manual of Photography, Tenth Edi-tion. Focal Press, Waltham.
[4] How to Understand Camera Exposure.
https://www.wikihow.com/Understand-Camera-Exposure
[5] Golowczynski, M. (2016) Digital Camera Sensors Explained.
https://www.whatdigitalcamera.com/technical-guides/technology-guides/sensors-ex plained-11457
[6] Digital Camera Sensors.
https://www.cambridgeincolour.com/tutorials/camera-sensors.htm
[7] Johnson, Z. (2009) GetRGB software developed by The Beckman Institute Imaging Technology Group at the University of Illinois at Urbana-Champaign.
http://www.itg.uiuc.edu/technology_development/software_development/get_rgb/d ownloads/Get_RGB_v1.0_code.txt
[8] Digital Camera Image Noise, Part 1.
https://www.cambridgeincolour.com/tutorials/image-noise.htm
[9] Digital Camera Image Noise, Part 2.