ISSN Online: 2162-2086 ISSN Print: 2162-2078
DOI: 10.4236/tel.2019.94037 Mar. 18, 2019 531 Theoretical Economics Letters
Effects of Regional Trade Agreements on
Strategic Agricultural Trade in Africa and Its
Implications to Food Security: Evidence from
Gravity Model Estimation
Fredu Nega Tegebu
*, Edris Hussein Seid
The Horn Economic and Social Policy Institute (HESPI), Addis Ababa, Ethiopia
Abstract
The problems of African agricultural development have been at the forefront of the debate on Africa’s development since the Lagos Plan of Action in 1963. During the 2004 AU meeting in Sirte, Libya and subsequently in the 2006 AU/NEPAD Summit on Food Security in Africa, concrete steps have been taken to work towards Common African Market on 12 selected strategic ag-ricultural products. Eight regional trade agreements which are to form the building blocks of the African Economic Community are engaged in trade liberalization and regional integration process on the selected strategic agri-cultural products with the ultimate goal being the formation of Common Markets for Agricultural products. However, the recent proliferation of re-gional trade agreements (RTAs) has intensified the debate on their merits es-pecially the merits of south-south trade agreements. This study contributes to this debate by analysing trade creation and trade diversion effects of African RTAs on trade in nine of the twelve strategic agricultural products. An ex-tended gravity model is estimated. We address econometrically the endoge-neity of RTAs using a panel approach. Results indicate that African RTAs have mixed effect on trade creation and trade diversion. Net trade creation is positive in three of the eight RTA and it is negative in two. Although a lot remains to be done, RTAs in Africa are an attractive means to speed up the move towards common market for agricultural products in the continent. This will have positive implication for food security and sustainable agricul-tural development in the continent.
Keywords
Regional Trade Agreements, Food Security, Gravity Model, Africa
How to cite this paper: Tegebu, F.N. and Seid, E.H. (2019) Effects of Regional Trade Agreements on Strategic Agricultural Trade in Africa and Its Implications to Food Se-curity: Evidence from Gravity Model Esti-mation. Theoretical Economics Letters, 9, 531-554.
https://doi.org/10.4236/tel.2019.94037 Received: January 24, 2019
Accepted: March 15, 2019 Published: March 18, 2019
Copyright © 2019 by author(s) and Scientific Research Publishing Inc. This work is licensed under the Creative Commons Attribution International License (CC BY 4.0).
http://creativecommons.org/licenses/by/4.0/
DOI: 10.4236/tel.2019.94037 532 Theoretical Economics Letters
1. Introduction
Food security is recognised as being one of the major development challenges facing the African continent. According to [1], the prevalence of undernourish-ment in Africa was 20.3 and for SSA, it was 23.8 percent, the highest proportion of all developing regions. Africa is not achieving its potential in food trade, in-creasing the risk of widespread hunger and malnutrition. Trade in agricultural products amongst the African countries remains at a relatively low level. Imports of agricultural products to the continent have been rising faster than exports since the 1970s and Africa as a whole has been a net agricultural importing re-gion since 1980 [2]. Furthermore, it is increasingly being recognised that African food and agricultural markets are extremely fragmented along sub-region, na-tional and even sub-nana-tional levels, resulting in segmented markets of sub-optimal size which hinder the profitability of sizeable private investment in the different stages of the commodity chain. These segmented gaps between regional/national production and regional demand are increasingly being filled by imports of non-African origin [in some cases through the use of unfair trade practices], even in case where tradable surpluses exists [2].
These problems and how to overcome them have been at the forefront of the debate on Africa’s development since the Lagos Plan of Action in 1963 and the Abuja Treaty of 1991. One way to enhance food security in Africa is to facilitate trade within the continent. Regional integration is a strategy that has been rec-ommended to, and embraced by African countries as the key to improved trade performance and economic development. The current process of regional inte-gration on the continent dates back to the Lagos Plan of Action of 1980. It is based on eight Regional Economic Communities (RECs) which are to form the building blocks of the African Economic Community as set out in the June 1991 Treaty Establishing the African Economic Community (called Abuja Treaty). Each of these RECs is already engaged in a trade liberalization and regional in-tegration process, with the ultimate goal being the formation of a common mar-ket and an African Monetary Union. However, the slow progress at overall inte-gration and the worsening food security situation in the continent led African leaders to single out the agricultural sector for fast track creation of an African Common Market for agricultural products without prejudice to the objectives of the Abuja Treaty [2].
DOI: 10.4236/tel.2019.94037 533 Theoretical Economics Letters is need to move market integration beyond the current pace of reform to create a free trade zone at the continental level.
The strategic commodities would be those commodities that:
Represent an important weight in the African food basket
Weigh significantly in the trade balance in the region through their contribu-tion to foreign exchange earnings or imported in large quantities to make up the gap Africa’s production and demand; and
Have considerable unexploited production potential in Africa, owing mainly to internal supply-side constraints as well as external impediments such as agricultural subsidies and support measures used by Africa’s trading part-ners.
Accordingly, twelve commodities—beef, poultry, dairy products, legumes, maize and maize products, rice, sorghum, groundnut, oil palm, sugar, cotton and cassava—were selected by the African Union.
However, rigorous analysis on how RTAs in Africa is faring in trade in the se-lected strategic agricultural products has not yet been made. The objective of this study is to analyse the effects of RTAs in Africa on trade in nine of the twelve se-lected agricultural products, and its implication to food security and sustainable agricultural development. To assess the effects of RTAs in Africa on trade in ag-ricultural products, our investigation relies on a gravity model and disaggregated data. A panel approach is used to address econometrically the endogeneity of RTAs.
The rest of the paper is divided into four sections. Section two reviews the relevant literature, followed by section three which introduces the gravity model and describes the dataset. Results and discussion are presented in section four and finally section five concludes.
2. Literature Review
Due to the rapid spread of regional trade agreements (RTAs) in the global trad-ing system in recent years and slow progress in multilateralism, regionalism has emerged as a powerful alternative to multilateralism. African governments and policy makers are convinced more than any time before that regional integration is the key strategy that will enable them to accelerate the transformation of their fragmented small scale economies, expand their markets, widen the region’s economic space, and reap the benefits of economies of scale for production and trade, thereby maximizing the welfare of their nations. They consider it as an important path to broad based development and a continental economic com-munity, in accordance with the Treaty Establishing the African Economic Com-munity (1991) and the Constitutive Act of The African Union (2000).
DOI: 10.4236/tel.2019.94037 534 Theoretical Economics Letters are active in the promotion of peace and security within their regions.
The large number of regional trade blocs in Africa suggests that policy makers on the continent believe that trade blocs present opportunities for promoting re-gional trade, boosting growth and engendering development. However, the ef-fects of RTAs especially south-south agreements on multilateral trade is debat-able. A growing literature addresses the debate based on the welfare effects of RTAs and their likely impacts on the multilateral trading system. Several studies advanced pessimistic conclusions about the impact of RTAs on Africa. A World Bank research project on regionalism concluded that South-South regional blocs are problematic in several respects [4]. According to the World Bank study, apart from doubtful non-economic benefits, South-South RTAs between two or more poor countries is very likely to generate trade diversion, especially when external tariffs are high [4]. Similarly, [5] looked at detailed trade data from Sub-Saharan Africa and concluded that, judged by the variance in their trade patterns from what current comparative advantage would predict, intra-regional trade has potential adverse effects on members and on third countries. He con-cludes that preferences for African intra-trade do not appear to have the poten-tial to make an important impact on these countries’ trade… [and] they may have a negative impact on Africa’s industrialization and growth if they divert re-gional imports from low to higher cost sources. Based on a homogenous goods assumption, the same conclusion is advanced by [6] who argues that any RTA between small developing countries will most likely induce a replacement of cheaper imports from the rest of the world with more expensive intra-RTA products from less efficient suppliers. Arguing from a rather different perspec-tive, [7] states that “the smaller the intra-regional shares in total trade... the more likely the trading blocs would become trade diverting”. Given the lower in-tra-trade shares of South-South RTAs (especially African RTAs) compared to North-North or North-South RTAs, the suggestion is once again that South- South RTAs are potentially more trade diverting than other RTAs. Negative im-pacts of South-South RTAs were found or predicted not only in Africa but also in Latin America.
An equal amount of dissenting opinions are put forward by other studies. For instance, [8] notes that “economic integration [in Africa] could generate the threshold scales necessary to trigger the much-needed strategic complementari-ties…within the region”. Other scholars used CGE analysis and found that trade creation is prevalent in the case of certain South-South RTAs. For instance [9] [10] found positive net effects of regional integration initiatives in Southern Af-rica, while [11] advances similar conclusions about MERCOSUR. [12] found that African trade blocs did have a positive impact on intraregional trade.
lan-DOI: 10.4236/tel.2019.94037 535 Theoretical Economics Letters guages, for common land borders, and for presence or absence of an FTA [13]. The impact of RTAs on trade flows is captured through the use of dummy vari-ables. Early findings on the effects of FTAs and trading blocs on bilateral trade flows were mixed. Recent developments in the empirical literature that deal ef-fectively with two way causality show that trading blocs and free trade agree-ments have large direct effects on aggregate bilateral trade between member countries relative to non-member countries. [13] have shown that estimation of effects of EIAs suffers from endogeneity bias due to self-selection of coun-try-pairs’ government into agreements and further indicate that after accounting for such bias using panel techniques—EIAs had much larger effects on trade flows than revealed in the earler gravity equation literature. The authors indicate that on average a FTA induces approximately a 100% increase in bilateral trade between members relative to non-member countries within ten years from their inception. Similarly, using panel data sets and controlling for endogeneity, [14] found the first evidence of the differential partial effects of various types of EIAs on intensive and extensive margins of trade with deeper integration agreements having larger impacts on aggregate trade flows. In the same way, [15] finds that larger FTA gains are associated with larger number of FTA partners and larger increase in volumes of trade caused by FTAs.
The paper contributes to the existing debate on south-south trade agreements in two ways. First, it treats problem of endogeneity of trade liberalization meas-ures by taking into account the most recent developments in gravity literature. Second, it assessed all the major RTA in Africa which have not been dealt in de-tail in previous researches.
2.1. Regional Integration and Food Security
The links between regional trade and food security are complex and multiple. Overall, trade is regarded as stimulant of long-term growth by serving as an im-portant channel for diffusion of technology [16] which in turn contributes to poverty reduction and food security. The focus here is explicitly on trade in agri-food commodities and its impact on food security.
Agricultural trade can promote food security in two ways. First, agricultural trade promotes economic growth which in turn improves access to food by im-proving income. Growth in agriculture contributes more to poverty reduction in developing countries than similar growth in other sectors [17]. This is due to the fact that most households in developing countries depend on agriculture for their living. Moreover, growth in agriculture enhances growth in the rest of the economy as agriculture is the main source of raw materials for the manufactur-ing sector. Second, agricultural trade increases food availability which in turn reduces food prices and food supply variability leading to increasing food secu-rity [18].
in-DOI: 10.4236/tel.2019.94037 536 Theoretical Economics Letters ternational trade. In the light of this paper, it is assumed governments adopt a self-reliance strategy to achieve food security, as this is superior to self-sufficiency in two ways. First, self-sufficiency fails to acknowledge potential gains of trade that are created by international differences in endowment of production factors and technology. Second, a crucial element of food security is a person’s access to food, not the extent to which food commodities are produced in a country or re-gion.
Studies on regional trade agreements mainly deal with trade in manufacturing good. Rigorous analysis of effects of RTAs on agricultural trade are scanty. Most studies that focus on effects of RTAs on agricultural trade use descriptive statis-tical methods, which may not be robust to identify trade effects of RTAs. Econometric techniques have seldom been used to study the effect of RTAs on trade in agricultural products. [19] used extended gravity model on six agrifood products for the North American Free Trade Agreement (NAFTA). While their study does not generate specific information regarding the extent of trade crea-tion and trade diversion for the six commodities attributable to NAFTA, the re-sults do suggest the presence of significant trade creation and diversion effects. Similarly, [20] used an extended gravity model to estimate the magnitude of trade creating and trade diversion across 9 individual agricultural commodities and for 8 RTAs. Results suggest that a majority of regional trade agreements are effective avenues to promote multilateral free trade. Furthermore, with only a few commodity specific exceptions, the authors find that regional trade agree-ments have increased trade with non-members even as the members have in-creased trade among themselves to a great extent. Nonetheless, it is important to note that the above empirical evidences did not control for endogeneity of the trade policy variables and hence obtained coefficients might be biased.
Recent studies that deal with issues of endogeneity of trading agreements highlight the importance of trading agreements on agricultural production. By using panel techniques and first differences to deal with endogeneity problems that are inherent to trade policy variables, [21] found that trade preferences granted to Morocco by the EU have a positive and significant effect on Moroc-can monthly exports of Fruits and Vegetables. Similarly, [22] explain the impor-tance of trade openness on Total Factor Productivity (TFP) growth in Tunisia indicating the fact that enhanced agricultural trade agreements are beneficial to the agricultural sector as a whole.
The above empirical evidences either do not talk about RTAs in Africa or consider all RTA in Africa as one. Empirical evidences on effect of each RTA in Africa on trade in agricultural products are scanty. This paper fills the evidence gap on effect of South-South RTAs on agricultural products by analysing effects of RTAs in Africa on trade in selected strategic agricultural products.
2.2. Regional Integration in Africa
DOI: 10.4236/tel.2019.94037 537 Theoretical Economics Letters was formed among Botswana, Lesotho, South Africa and Swaziland. The East African customs union followed suit in 1917 between Kenya and Uganda; and later in 1927 Tanganyika joined the union. Since then large number of economic communities has been formed. At present the African continent has around 14 overlapping regional economic communities [23]. Every country in the conti-nent is at least a member of one REC. Of all the African countries, 25 countries belong to two RECs, 17 are member of three RECs, 6 are members of four RECs. Out of the 14 regional economic communities, 8 are recognized by the African Union Commission (AUC) as building blocks of the African Economic Com-munity which at regional level will start up a process of coordination and har-monization of tariff and non-tariff measures in order to create a continental customs union and eventually an economic and monetary union. Table 1 below lists member countries, year of establishment and status of each of these eight RECs.
[image:7.595.58.539.374.741.2]Despite the fact that there exist many regional economic communities with overlapping membership in the continent and interests and political commit-ment of African leaders and policy makers towards regional integration, in-tra-regional trade in goods and services lags behind other developing regions of
Table 1. African free trade areas and customs union.
Regional Economic
Communities (RECs) Member States Status Establishment Year of
Arab Maghreb Union
(AMU) Algeria, Libya, Mauritania, Morocco, Tunisia
In progress to eliminate tariffs & non-tariff barriers.
Not yet set date for FTA 17 Feb 1989
Community of Sahel-Saharan States
(CEN-SAD)
Benin, Burkina Faso, Chad, Cote d’Ivoire, Djibouti, Egypt, Eritrea, Gambia, Ghana, Guinea-Bissau, Kenya, Liberia, Libya, Mali, Morocco, Nigeria, Niger, Senegal, Sierra Leone, Somalia, Sudan, Togo, Tunisia
At the stage of coordinating and harmonizing activities
among member states 4 February 1998
Common Market for Eastern and Southern Africa (COMESA)
Burundi, Comoros, D.R. Congo, Djibouti, Egypt, Eritrea, Ethiopia, Kenya, Libya, Seychelles,
Madagascar, Malawi, Mauritius, Rwanda, Sudan, Swaziland, Uganda, Zambia, Zimbabwe
Custom Union though there are member states who has not yet
signed even the FRT protocol 8 December 1994
East African Community
(EAC) Burundi, Kenya, Rwanda, Tanzania, Uganda Customs Union 7July 2000 Economic Community
of Central African States (ECCAS)
Angola, Burundi, Cameroon, Central African Republic, Congo, Rep., D.R. Congo, Chad, Gabon,
Equatorial Guinea, Sao Tome and Principe, Rwanda Free Trade Area 1 July 2007 Economic Community
of West African States (ECOWAS)
Benin, Burkina Faso, Cape Verde, Cote d’Ivoire, Gambia, Ghana, Guinea, Guinea-Bissau, Liberia, Mali, Niger, Nigeria, Senegal, Sierra Leone, Togo
Free Trade Area and it was envisioned to create the
Customs Union by 2015 28May 1975 Inter-Governmental
Authority on Development (IGAD)
Djibouti, Eritrea, Ethiopia, Kenya, Somalia, South Sudan, Sudan, Uganda
In progress to eliminate tariff and non-tariff barriers.
Not yet set date for FTA 25 November 1996 Southern African
Development Community (SADC)
Angola, Botswana, D.R. Congo, Lesotho, Madagascar, Malawi, Mauritius, Mozambique, Namibia, Seychelles,
DOI: 10.4236/tel.2019.94037 538 Theoretical Economics Letters Asia and Latin America [23]. The low level of intra-regional trade in merchan-dise goods is observed in agricultural commodities in which most African coun-tries heavily rely on for foreign exchange earnings and employment. These Afri-can RECs, as shown below in Table 2, traded less among themselves compared to other RECs (such as ASEAN, NAFTA and EU). In 2012, COMESA and SADC recorded the highest intra-regional trade in agricultural commodities with 20.7 and 23.3 percent respectively. While the intra-regional trade in EU and NAFTA was well above 70 and 40 percent respectively.
3. Empirical Analysis
3.1. The Gravity Model
The gravity model has been used widely as a baseline model for estimating the impact of economic integration upon the volume and direction of international trade flows. It has performed remarkably well as an empirical framework for measuring the impact of regional integration arrangements [24] [25].
Typically, in the case of gravity model of trade, bilateral trade flows are de-pendent upon the size of the two economies and the distance between them:
(
, ,)
t t t
ij i j ij
X = f Y Y D (1)
where t ij
X are exports from country i to country j at time t, t i
Y and t j
Y are the GDPs at time t of countries i and j respectively. D is the distance between the capital cities of the two countries.
[image:8.595.210.539.507.713.2]The rationale behind the gravity model is that trade is associated with eco-nomic size, measured as GDP, and is inhibited by distance (which increases transportation costs, as well as other transaction costs). Specifically, a high level of income in the exporting country indicates a high level of production, which increases the availability of products from export while a high level of income in
Table 2. Intra-regional trade (exports) among selected RECs in agricultural goods.
2001 2002 2003 2004 2005 2006 2007 2008 2009 2010 2011 2012 CEN-SAD 13.1 12.0 11.2 10.5 11.3 11.7 12.1 13.5 13.8 14.7 15.1 15.5 COMESA 12.2 13.2 10.8 12.3 12.5 16.1 16.9 17.3 16.7 20.0 18.5 20.7 EAC 6.2 5.9 7.6 8.3 8.0 8.5 11.0 10.7 11.7 12.9 14.2 15.9 ECCAS 8.2 8.4 8.9 8.2 7.7 11.8 11.3 11.1 9.6 10.2 10.9 12.9 ECOWAS 11.1 9.9 10.0 10.8 10.4 10.7 11.1 12.5 12.2 11.3 12.2 11.8 IGAD 8.7 8.7 8.3 7.8 8.6 10.3 10.5 11.9 13.0 15.1 14.1 15.0 SADC 19.2 23.3 22.9 23.5 20.6 21.3 21.6 23.4 25.0 24.0 24.0 23.6 UMA 6.9 8.6 7.8 6.1 7.4 7.7 7.8 7.9 7.7 8.1 13.3 12.2 ASEAN 20.0 19.8 19.7 19.5 19.5 19.2 19.6 18.9 19.7 21.6 21.7 22.5 EU 75.2 75.5 76.4 77.2 77.3 76.9 77.3 77.1 77.7 75.8 74.8 73.7 NAFTA 42.8 44.8 43.9 45.5 47.0 47.3 43.6 40.5 41.6 40.8 40.9 40.5
DOI: 10.4236/tel.2019.94037 539 Theoretical Economics Letters the importing country suggests higher demand and therefore, higher imports. Therefore both t
i
Y and t j
Y should be positively correlated with the level of bi-lateral exports. Since distance increases transport costs, its coefficient is expected to be negative.
For estimation purposes, the basic gravity model is most often used in its log-linear form:
( )
0 1( )
2( )
3( )
ln t ln t log t ln
ij i j ij ijt
X =β +β Y +β Y +β D +ε (2)
where
ε
ijt is the log normally-distributed error term.We are interested in a model that captures the trade flow effects of regional trade agreements. Researchers typically experiment by including proxies for trade costs such as the distance between partners, and indicators for common language and contiguity (when countries share land borders). For example, two countries that share a common border or speak a common language may trade more with each other based on relative proximity and cultural similarity. Or, countries with access to sea port may have a comparative advantage in trade relative to neighbours who are landlocked. Controlling for these factors gives us more confidence that our regional block dummies are picking up structural in-creases in trade following the signing of an RTA.
Thus, the most commonly used version of the expanded gravity model as-sessing the impact of RTAs is the following:
( )
0 1( )
2( )
3 45 6 7 8
8
9 10
1 8
1
ln ln ln ln ln
ln ln
t t
j
t t t i
ij i j t t
i j
ij ij ij
t
i j h ijh
h
t t
h ijl ij
l
Y Y
X Y Y
N N
D linder cont commlang
landlck landlck TradeC
TradeD TimeDummies
β β β β β
β β β β
β β α
γ ε = = = + + + + + + + + + + + + + +
∑
∑
(3)where contij, commlangij and landlckij are dummy variables equal to one if
exporter (i) and importer (j) share a common land border, speak a common language or are landlocked countries and zero otherwise, and the variable linder calculated as per capita difference between two trading partners shows differ-ences in tastes.
The dummy variables t
ijh
TradeC and t
ijl
TradeD are designed to capture
trade creation or trade diversion effects respectively in agricultural products trade for eight RTAs (h=1,2, ,8 ). The dummy variable t
ijh
TradeC equals one
if countries i and j belong to a particular RTA and the year (t) is greater than or equal to the year the agreement was signed. The sign and magnitude of the coef-ficient indicates whether the creation of a particular RTA has stimulated or de-pressed intra-regional agricultural trade.
The trade diversion dummy variable ( t ijl
TradeD ) is designed to estimate how
DOI: 10.4236/tel.2019.94037 540 Theoretical Economics Letters This variable takes the value one when the importer is an RTA member and the exporter a non-member and the year (t) is greater than or equal to the year the agreement was signed, and zero otherwise. Thus, the coefficient will capture the average increase (decrease) in trade diversion from non-member sources after the agreement came into force.
To obtain econometrically sound estimates of the parameters of interest from Equation (3) above, we address the presence of endogeneity of free trade agree-ments and unobservable multilateral resistance terms.
Following the developments in the empirical gravity literature, we use time-varying directional (source and destination), country-specific dummies to control for the multilateral resistances. To account for RTA endogeneity, we use the panel data estimation techniques described in [26] and first applied to a similar setting by [13] who employ aggregate data to show that direct FTA ef-fects on bilateral trade flows can be consistently isolated in a theoretically-founded gravity model by using country-pair fixed effects. Similar methodology has been used by few other studies (see for e.g. [14] [15]).
Taking the above considerations into account, we estimate the following econometric specification for each class of commodities in our sample:
8 8
0 1 1
ln t exp t t t t t
ij i j ij h ijh h ijl ij
X =
β η θ
+ + +γ
+ = RTAC + = RTAC +
∑
∑
where ln t ij
X is bilateral trade (in logarithmic form) between partners i and j at time t. t
ijh
RTAC and t
ijl
RTAC are dummy variables designed to capture trade creation or trade diversion effects respectively for each of the eight RTAs. The
dummy variable t
ijh
RTAC equals 1 if countries i and j belong to a particular RTA and the year (t) is greater than or equal to the year the agreement was signed. The trade diversion dummy variable t
ijl
RTAC is designed to estimate how much of the increase (if any) in trade creation came as a result of trade diversion from non-member sources. t
i
η denotes the time-varying source-country dummies,
which control for the (log of) outward multilateral resistances and total shipments.
t j
θ
encompasses the time varying destination country dummy variables that ac-count for the (log of) inward multilateral resistances and total expenditure. γijcaptures the country-pair fixed effects used to address FTA endogeneity.
3.2. Data
Data was obtained from different sources. Table 3 presents the data source and description of variables used.
4. Estimated Results and Discussion
DOI: 10.4236/tel.2019.94037 541 Theoretical Economics Letters Table 3. Variable description and data source.
Variable Description Data Sources
GDP Nominal GDP as measure of economic mass (taken in log form) World Development Indicators (WDI)
GDP per capita World Development Indicators (WDI)
Linder It is the absolute value of the difference in GDP per Capita income included to measure income difference using the GDP per capita variable Authors computation
Bilateral Trade data commodities for the period 1998 to 2010 for all African Panel bilateral trade data for the 9 strategic agricultural
countries and selected Industrial and Emerging Economies CEPII Gravity Database
Area Area in square km CEPII GeoDist Database
Landlocked 1 if landlocked, 0 otherwise CEPII GeoDist Database
Bilateral Distance is computed based on latitude and longitude of the capital cities. Distance between the trading partners as developed by [27] CEPII GeoDist Database
Contiguity 1 if share common border, =0 otherwise CEPII GeoDist Database Language 1 if have common official or primary language CEPII GeoDist Database Colony 1 if had common colonizer, =0 otherwise CEPII GeoDist Database Population Population size of the trading partners taken in log World Development Indicators (WDI)
𝑇𝑇𝑇𝑇𝑇𝑇𝑇𝑇𝑇𝑇𝐶𝐶𝑖𝑖𝑖𝑖 ℎ𝑡𝑡 1 if countries i & j belong to a particular RTA and the year (t) is greater than or equal to the year the agreement was signed, 0 otherwise Authors’ compilation from different sources
𝑇𝑇𝑇𝑇𝑇𝑇𝑇𝑇𝑇𝑇𝐷𝐷𝑖𝑖𝑖𝑖𝑖𝑖𝑡𝑡
1 if the importer is an RTA member & the exporter a non-member and the year (t) is greater than or equal to the year the agreement
was signed, 0 otherwise Authors’ compilation from different sources
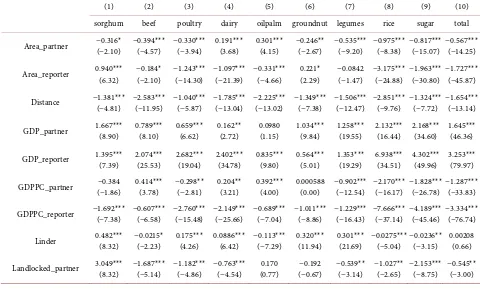
Table 4. Gravity model regression results for standard gravity variables.
(1) (2) (3) (4) (5) (6) (7) (8) (9) (10) sorghum beef poultry dairy oilpalm groundnut legumes rice sugar total
Area_partner −0.316* (−2.10) −0.394*** (−4.57) −0.330*** (−3.94) 0.191*** (3.68) 0.301*** (4.15) −0.246** (−2.67) −0.535*** (−9.20) −0.975*** (−8.38) −0.817*** (−15.07) −0.567*** (−14.25)
Area_reporter 0.940*** (6.32) −0.184* (−2.10) −1.243*** (−14.30) −1.097*** (−21.39) −0.331*** (−4.66) 0.221* (2.29) −0.0842 (−1.47) −3.175*** (−24.88) −1.963*** (−30.80) −1.727*** (−45.87)
Distance −1.381*** (−4.81) −2.583*** (−11.95) −1.040*** (−5.87) −1.785*** (−13.04) −2.225*** (−13.02) −1.349*** (−7.38) −1.506*** (−12.47) −2.851*** (−9.76) −1.324*** (−7.72) −1.654*** (−13.14)
GDP_partner 1.667*** (8.90) 0.789*** (8.10) 0.659*** (6.62) 0.162** (2.72) 0.0980 (1.15) 1.034*** (9.84) 1.258*** (19.55) 2.132*** (16.44) 2.168*** (34.60) 1.645*** (46.36)
GDP_reporter 1.395*** (7.39) 2.074*** (25.53) 2.682*** (19.04) 2.402*** (34.78) 0.835*** (9.80) 0.564*** (5.01) 1.353*** (19.29) 6.938*** (34.51) 4.302*** (49.96) 3.253*** (79.97)
GDPPC_partner (−1.86) −0.384 0.414*** (3.78) −0.298** (−2.81) 0.204** (3.21) 0.392*** (4.00) 0.000588 (0.00) −0.902*** (−12.54) −2.170*** (−16.17) −1.828*** (−26.78) −1.287*** (−33.83)
GDPPC_reporter −1.692*** (−7.38) −0.607*** (−6.58) −2.760*** (−15.48) −2.149*** (−25.66) −0.689*** (−7.04) −1.011*** (−8.86) −1.229*** (−16.43) −7.666*** (−37.14) −4.189*** (−45.46) −3.334*** (−76.74)
Linder 0.482*** (8.32) −0.0215* (−2.23) 0.175*** (4.26) 0.0886*** (6.42) −0.113*** (−7.29) 0.320*** (11.94) 0.301*** (21.69) −0.0275*** (−5.04) −0.0236** (−3.15) 0.00208 (0.66)
[image:11.595.58.538.441.734.2]DOI: 10.4236/tel.2019.94037 542 Theoretical Economics Letters
Continued
Landlocked_reporter −1.973*** (−3.99) 2.744*** (10.32) −1.454*** (−5.32) −1.984*** (−11.53) −2.914*** (−11.37) −2.153*** (−7.04) 0.0298 (0.18) (−1.26) −0.529 1.302*** (6.19) (−1.18) −0.183
Contiguity 3.447*** (4.50) 2.570*** (5.77) 2.535*** (5.71) 2.308*** (7.06) (1.84) 0.823 2.980*** (6.83) 1.744*** (5.00) 2.308** (2.94) 1.786*** (3.67) 2.735*** (8.36)
Common language_off 0.894* (2.31) 0.717** (3.08) (0.87) 0.190 −0.0508 (−0.32) 0.545** (2.71) (1.65) 0.411 (1.73) 0.262 (0.96) 0.335 −0.0229 (−0.11) (1.73) 0.272
Colony 0.0491 (0.07) 1.031* (2.10) 1.993*** (4.82) 0.970** (2.73) (1.12) 0.486 1.733*** (3.65) 1.691*** (5.10) 0.0580 (0.09) 1.959*** (4.42) 0.878** (2.58)
Constant −69.68*** (−17.42) −43.49*** (−22.16) −33.62*** (−15.80) −22.14*** (−14.89) (−0.64) −1.159 −25.89*** (−13.86) −30.91*** (−23.71) −71.42*** (−26.33) −62.75*** (−32.44) −38.10*** (−32.93)
lnalpha _cons 2.814*** (32.17) 2.525*** (48.68) 2.399*** (40.28) 2.157*** (52.24) 2.641*** (52.05) 2.629*** (46.19) 2.143*** (50.89) 3.018*** (62.31) 2.712*** (79.88) 2.220*** (80.53)
N 42256 42256 42256 42256 42256 42256 42256 42256 42256 42256
[image:12.595.58.544.321.713.2]t statistics in parentheses; for brevity time dummy variable are not reported; *p < 0.05, **p < 0.01, ***p < 0.001.
Table 5. Trade creation for the RECs (at commodity level).
(1)
Sorghum Sugar (2) Rice (3) Poultry (4) Oil palm (5) Legumes (6) Dairy (7) Beef (8) Ground Nut (9) Total (10) AMU 0.0457 0.543 0.323 −1.256*** 0.0796 0.481 0.493 0.125 −0.285 0.216 (0.85) (1.71) (1.13) (−5.67) (0.38) (1.41) (1.59) (0.70) (−1.06) (0.53) CEN-SAD −1.323*** −3.662*** −2.417*** −0.211 −1.121 −4.587*** −5.242*** 0.049 −1.927** −3.556**
(−4.64) (−3.67) (−3.37) (−0.31) (−1.75) (−4.94) (−5.99) −0.08 (−2.83) (−3.10) COMESA 0.0878 0.455 −0.0275 0.469 0.316 0.596 0.55 1.104** 0.442 1.168*
(0.58) (1.25) (−0.11) (1.54) (1.17) (1.29) (1.53) (2.59) (1.34) (2.40) EAC 0.231 1.903* 1.802* 0.624 1.424* 0.251 0.692 1.132 0.595 2.370**
(0.41) (2.18) (2.35) (1.42) (2.29) (0.27) (1.24) (1.70) (1.08) (3.20) ECCAS 0.0531 −1.378** −0.0462 −1.799*** −0.0007 0.397 −0.943* 0.0298 −0.337 −2.549***
−0.85 (−3.12) (−0.10) (−5.03) (−0.00) (1.02) (−2.14) (0.12) (−1.06) (−4.62) ECOWAS 0.0169 −0.441 −0.207 −0.313 −0.0235 0.127 −0.533 −0.0186 −0.0042 −0.109 (0.31) (−1.09) (−0.48) (−1.07) (−0.11) (0.36) (−1.10) (−0.08) (−0.01) (−0.23) IGAD 4.536*** 6.776*** 4.780*** −0.113 3.971*** 4.314*** 3.457*** 0.531 1.811** 6.746*** (15.13) (9.61) (8.26) (−0.22) (8.46) (5.46) (4.91) (0.91) (3.02) (7.67) SADC 0.149 0.842 0.383 0.428 −0.167 −0.301 −0.0706 −0.0405 0.0443 0.611 (1.00) (1.47) (1.27) (1.66) (−0.44) (−0.99) (−0.20) (−0.19) (0.23) (0.97) Country pair FE Yes Yes Yes Yes Yes Yes Yes Yes Yes Yes
Reporter FE Yes Yes Yes Yes Yes Yes Yes Yes Yes Yes Partner FE Yes Yes Yes Yes Yes Yes Yes Yes Yes Yes _cons 1.255*** 4.936*** 2.490*** 1.879*** 1.121* 4.238*** 6.020*** −0.219 2.191*** 5.950***
(4.80) (6.21) (5.30) (3.86) (2.15) (6.47) (9.62) (−0.41) (4.77) (6.74) N 13924 13924 13924 13924 13924 13924 13924 13924 13924 13924
DOI: 10.4236/tel.2019.94037 543 Theoretical Economics Letters Table 6. Trade Diversion for the RECs (at commodity level).
(1)
Sorghum Sugar (2) Rice (3) Poultry (4) Oil Palm (5) Legumes (6) Dairy (7) Beef (8) Ground Nut (9) Total (10) AMU 0.102 −0.418 0.0858 −0.654 0.0778 0.664 −0.827 0.251 −0.252 −0.423
(0.81) (−1.05) (0.19) (−1.85) (0.29) (1.68) (−1.92) (0.95) (−0.80) (−0.85) CEN−SAD −1.413*** −4.726*** −2.507*** −1.382* −1.132 −4.661*** −5.674*** −0.16 −2.069** −5.723***
(−5.10) (−4.86) (−3.58) (−2.15) (−1.79) (−5.08) (−6.68) (−0.28) (−3.11) (−5.11) COMESA 0.18 0.349 0.0708 0.456 0.248 0.804 0.624 1.157** 0.548 1.086*
(1.16) (0.99) (0.29) (1.45) (0.92) (1.77) (1.72) (2.71) (1.63) (2.42) EAC −0.111 −0.102 −0.246 −0.0143 −0.0989 −0.461 −0.455 −0.0965 0.136 −0.423 (−0.91) (−0.31) (−0.99) (−0.08) (−0.50) (−1.93) (−1.78) (−0.56) (0.46) (−1.13) ECCAS 0.126 −0.417 0.0859 −0.643* −0.0415 0.489 −0.598 0.122 −0.333 −0.329 (1.17) (−0.98) (0.19) (−2.02) (−0.16) (1.28) (−1.40) (0.48) (−1.08) (−0.64) ECOWAS 0.0481 −0.432 −0.145 −0.432 −0.131 0.459 −0.615 0.155 −0.414 −0.4
(0.84) (−1.20) (−0.35) (−1.51) (−0.57) (1.28) (−1.56) (0.70) (−1.37) (−0.87) IGAD −1.371*** −3.359*** −2.427*** −0.371 −1.434** −4.440*** −5.578*** −1.053*** −2.961*** −4.512***
(−5.33) (−5.33) (−6.27) (−1.32) (−3.07) (−12.58) (−13.06) (−4.09) (−8.15) (−6.29) SADC 0.188 0.355 0.283 0.275 0.242 −0.266 −0.0697 −0.113 0.0835 0.485
(1.10) (0.83) (1.02) (1.23) (0.85) (−0.91) (−0.19) (−0.49) (0.47) (1.00) Country pair FE Yes Yes Yes Yes Yes Yes Yes Yes Yes Yes
Reporter FE Yes Yes Yes Yes Yes Yes Yes Yes Yes Yes Partner FE Yes Yes Yes Yes Yes Yes Yes Yes Yes Yes _cons 1.255*** 4.936*** 2.490*** 1.879*** 1.121* 4.238*** 6.020*** −0.219 2.191*** 5.950***
(4.80) (6.21) (5.30) (3.86) (2.15) (6.47) (9.62) (−0.41) (4.77) (6.74) N 13924 13924 13924 13924 13924 13924 13924 13924 13924 13924
t statistics in parentheses. *p < 0.05, **p < 0.01, ***p < 0.001.
We begin our discussion with the standard gravity variables. Table 4 shows that the estimated GDP coefficients have the expected sign and significance in all the 10 regressions. The parameter estimates of population size also are positive and significant in most cases especially the population size for the reporter countries, i.e., the importer countries. This implies that the higher the popula-tion of a country the higher the demand for imported goods all else constant.
How-DOI: 10.4236/tel.2019.94037 544 Theoretical Economics Letters ever, it should be noted that transportation cost will not always increase mono-tonically with distance because transaction costs associated with many opera-tions such as loading, storage, and local distribution, are large compared to the marginal cost per kilometre of distance travelled [28].
The negative and significant effect of distance on agrifood products is in con-formity with similar findings by [19] [20]. The other standard gravity variables such as being landlocked, common language, colonial history and contiguity all have the expected sign and are significant in most cases.
4.1. Trade Creation
Empirical results on Table 5 suggest that there is mixed effect of the regional in-tegrations in Africa. Among the eight RTAs considered, IGAD, EAC and COMESA have shown positive and significant trade creation effect in the overall agrifood commodities. IGAD shows positive and significant trade creation effect in seven of the nine selected agricultural products followed by EAC which showed positive and significant effect on three products, and finally COMESA and ECOWAS showed positive and significant effect in one product each.
In the next group of RTAs namely AMU, ECOWAS and SADC the trade crea-tion effect for overall agrifood commodities, although positive, is statistically in-significant. This indicates the fact that the three trade agreements have not re-sulted in creation of trade in the selected agricultural products.
In the third group of RTAs, CENSAD and ECCAS, trade decreased after the formation of the agreements in seven out of nine, and in three out of nine agri-food commodities respectively. Moreover, trade in all agriagri-food commodities has decreased following the formation of the agreement in CENSAD and ECCAS over the period 1998-2010.
4.2. Trade Diversion
Observing the level of changes in each of the eight RECS, the diversion dummy, can give insight into the presence of trade diversion effects. This will tell us whether there are reductions in the level of imports by each of the RECs member states from non-members relative to the level of exports by the REC members to non-members overtime. The relevant results are reported on Table 6.
ob-DOI: 10.4236/tel.2019.94037 545 Theoretical Economics Letters served in trade diversion over the period 1998-2010 as a result of the formation of trade agreements among the member states.
4.3. Net Effect
We now turn to look into the net effect of the trade creation and trade diversion effects for each of the eight RECs on the nine selected agrifood commodities. But for simplicity, we limit the net effect analysis to the total agrifood products.
Comparing the trade creation and trade diversion coefficients, the sum of the two coefficients gives the net creation effect of trade agreements. Table 7 indi-cates that among the eight RTAs considered, CENSAD and ECCAS recorded a net diversion effect, while three RTAs—COMESA, EAC and IGAD show a net creation effect. In the case of AMU, ECOWAS and SADC neither net creation nor net diversion effect was recorded.
In summary, results suggest that the African RTAs have a mixed effect. The net effect for total agrifood commodities is positive and significant in three of the eight trading blocs in Africa and it is negative or insignificant in the remain-ing five RTAs. In two of these three tradremain-ing blocs with net trade creation ef-fects—COMESA and EAC, trade among member states has increased signifi-cantly while either increasing their openness to the rest of the world or without changing the level of openness to the rest of the world. These trading blocs are good indications that trading blocs in Africa are favourable to both regional in-tegration and formation of a common African market that transcends national and sub-regional borders as envisaged by the African Union. However, a lot re-mains to be done to have a full benefit of regional integration in all the trading blocs in Africa.
4.4. Implications to Food Security
[image:15.595.210.538.570.730.2]The analysis in previous sections demonstrates that regional integration of the selected agrifood markets in Africa ispartial. For some of the selected agrifood commodities, trade creation effect is positive and significant and for others not. Similarly, trade diversion is negative and significant for some commodities and
Table 7. Net trade creation effect.
Trade Creation Trade diversion Net effect
AMU 0.216 −0.423 0
CENSAD −3.556** −5.723*** −9.279
COMESA 1.168* 1.086* 2.254
ECCAS −2.549*** −0.329 −2.549
ECOWAS −0.109 −0.4 0
EAC 2.370** −0.423 2.370
IGAD 6.746*** −4.512*** 2.234
DOI: 10.4236/tel.2019.94037 546 Theoretical Economics Letters for others it is positive and statistically significant implying higher level of openness of the African trading blocs to outside members. Looking at the net ef-fect for the total agrifood commodities, net trade creation has been seen in three trading blocs and net trade diversion in two trading blocs. In three trading blocs, the net trade creation is zero.
What does this mean for regional food security and sustainable agricultural development? This implies that the regional integration has not led to substan-tial allocation effects and the expected decrease in food prices caused by effi-ciency gains. Hence, the direct effect of African RTAs on food security, although different among trading blocs, seems to have been small. Although accumulation effects can have a potentially much larger and positive effect on improving food security by stimulating agricultural development and poverty reduction due to its dynamic nature, taking into account that allocation effects have been small, it seems likely accumulation effects have also been limited.
This does not mean that more and better regional integration does not offer important opportunities to improve food security in Africa for two reasons. First, along many borders in Africa, there are large informal flows of food grains that are not subject to tariffs and trade restrictions whose effects could not be accounted in our model. Numerous studies have shown that informal cross bor-der trade especially in traditional food grains such as maize, rice and beans and live animals is substantial [29]. In some instance, the volume of informal cross border trade among many African countries is estimated to be much larger than the official cross border trade [30]. In Uganda, for example, informal exports flowing to its five neighbouring countries were estimated to account for USD 231.7 million in 2006, corresponding to around 86% of Uganda’s official export flows to these countries. Similarly, informal imports were estimated at USD 80.6 million, corresponding to approximately 19% of official import flows from these countries [31]. When formal trade is increasingly liberalized and strong restric-tions are placed on the informal trade overtime, the effects of RTAs in enhanc-ing food security in Africa would undoubtedly rise up. Secondly, the fact that in-tra-regional agriculture and food trade in Africa is relatively low in comparison with intra-regional agricultural trade in other regions (see Table 2) means that there is sufficient scope for expansion. In the sub-section that follows, we show the potential implication of regional integration in Africa to food security by comparing regional production instability index with individual countries insta-bility index.
Production Variability and Intraregional Trade Potential
DOI: 10.4236/tel.2019.94037 547 Theoretical Economics Letters Instability is measured with the Cuddy Della Valle Instability index [35]. The index is a modification of CV to accommodate for trend, which is commonly present in time series economic data. It is based on the coefficient of variation corrected by the fitness of a trend function. Thus,
2 CV 1
I= −R
where CV is the coefficient of variation and R2 is the adjusted coefficient of determination of an arithmetic linear or log-linear trend function. Formulated by [35], this index provides a cardinal measure of the instability of time series data relative to their respective trends. The instability of domestic production series indicates the food security circumstances that would prevail in countries under autarky.
Instability indexes (I), which are corrected coefficients of variation, have been calculated for ten of the twelve strategic agricultural products identified by the African Union on the basis of data from 1991-2012 for each of the eight RECs member countries1. Table 8 presents the instability index of individual countries
and the corresponding regions instability index. Thus one can see the relation-ship between the regions instability index and those of the individual countries.
One general observation from the individual countries instability index is that production of the strategic agricultural products is highly volatile almost in all African countries whose production data is available. For all countries where production data is available, production fluctuations are more than 10%. Some of the strategic products particularly oil palm and to some extent groundnut are produced in a few of the RECs. Production of oil palm is reported only for ECCAS and ECOWAS.
Table 8 reveals that there are wide differences in individual countries instabil-ity index when compared to their region’s instabilinstabil-ity index. For some products, regional instability index exceeds individual country’s instability index. ECOWAS is the region with high volatility of production at regional level than at country level. For eight of the ten strategic agricultural products considered, regional in-stability index is higher than some member states inin-stability index. This means that the countries with lower instability index than the regional index would not gain if integration is enhanced. This indicates that national incentives to cooper-ate regionally can vary widely. Next to ECOWAS, CENSAD reveals higher re-gional instability index than individual countries instability index for five strate-gic agricultural products namely legumes, maize, rice, sorghum and sugar. IGAD comes in third place with regional instability index exceeding some members’ instability index in three products. For the remaining RECs, regional instability index exceeds some member states instability index for either two products (in the case of EAC, ECCAS and SADC) or only one product (in the case of AMU).
1Data for period 1991-2012 was obtained from FAOSTAT, 2015. For a significantly large number of
DOI: 10.4236/tel.2019.94037 548 Theoretical Economics Letters Table 8. Instability of strategic agricultural products production in Africa by REC, 1991-2012.
REC Country Strategic Agricultural Products
Beef Dairy Groundnut Legumes Maize Oil Palm Poultry Rice Sorghum Sugar AMU
Algeria 19.1 22.9 - 42.8 238.6 - 18.4 148.4 - -
Mauritania - - - - 144.6 - - - - -
Morocco 20.2 17.4 - 32.6 50.4 - 22.7 56.6 - 14.3
Tunisia - 11.4 - 44.3 - - 16.8 - - 73.3
AMU 9.7 10.2 - 25.3 49.9 - 12.6 55.6 - 15 CENSAD
Benin - - - 177.8 168 -
Burkina Faso - - 42.2 36.5 31.2 - - 73.4 31.8 -
Chad 108.2 - - - 121.4 119.8 -
Comoros - - - -
Cote D’voire 21 23.5 23.1 41.7 13.7 - 26.6 60.6 102.9 19.4 Egypt 26.4 21.7 36 20.6 12.2 - 27.1 20 17.5 32.9 Eritrea - 29 76.4 66.6 55.4 - 41.4 - 77.9 - Ghana 49.4 - 35.5 - 16.9 - 43.8 25.1 31.9 - Guinea 19.4 20.4 32 - 19.9 - 33.9 45.4 33.4 - Guinea-Bissau 109.2 119.6 - - 85 - 108.4 43.1 36.8 - Gambia 19.1 - 24.3 - 35.1 - 23.4 65.9 39 - Kenya 22.4 28.8 41.6 34.7 16.5 - 24.1 82.4 44.2 22.2
Mali 39.8 51.6 47.7 37.6 53.5 - 39.2 51.4 53.6 - Morocco 20.2 17.4 16.9 32.6 51.6 - 22.7 56.6 37.7 14.3
Niger - - 76.5 59.3 68.6 - - 48.8 66.6 15.4 Nigeria 45.1 36.1 36.8 57.8 47.3 - 40.8 51.6 52.1 - Senegal - 29.7 41.8 61 55.1 - 57.8 61.3 50.1 20.4
Sudan - 34.5 57.9 33.4 77.4 - 45.4 58 85.9 71.2
Tunisia - 11.4 - 44.3 - - - 73.3
Togo - - 32 60.6 20.8 - 16.8 41 36.6 -
CENSAD 13.7 7.3 14.9 34.8 24.4 - 13.3 23.2 32.3 19.1 COMESA
Burundi 28.6 45 - 27.1 28 - 43.5 40.4 33 -
Comoros - - - -
Egypt 26.4 21.7 36 20.6 24.6 - 27.1 20 17.5 32.9 Eritrea - 29 76.4 66.6 74.2 - 41.4 - 77.9 - Ethiopia - 42.6 103.1 57.3 44.1 - - 115.8 50.5 28.8
DOI: 10.4236/tel.2019.94037 549 Theoretical Economics Letters
Continued
Madagascar 37.3 - 30.8 23.1 40.8 - 24.7 31.7 - 97.5 Malawi 44.4 - 38.6 45.1 54.6 - - 49.7 48.4 -
Mauritius - 48 93.5 34 - - - 85.6
Rwanda 44.4 27.3 40.3 42 97.3 - 46.3 51.9 27.4 56.9 Sudan - 34.5 57.9 33.4 81.5 - 57.8 58 85.9 71.2
Zambia - - - 104.1 -
Zimbabwe - - - 230.2 -
COMESA 19.9 9.5 30.7 14.7 14 - 20.2 13.6 43.9 33.3 EAC
Burundi 28.6 45 - 27.1 28 - 43.5 40.4 33 - Kenya 22.4 28.8 41.6 34.7 28.6 - 24.1 82.4 44.2 22.2 Rwanda 25.8 27.3 40.3 42 41.9 - 46.3 51.9 27.4 56.9 Tanzania - 24.8 37.7 49 40.5 - - - 43.1 -
EAC 19.9 25.2 30.7 21.2 21.5 - 18.8 27.1 32.4 21.7 ECCAS
Angola - - - 222.9 252.8 -
Burundi 28.6 45 - 27.1 28 - 43.5 40.4 33 - Cameroon - 39 39.8 23.1 35.6 40.8 39.8 47.7 31.9 - Congo 52 - 29.1 29.9 28.9 40.1 28.5 212.1 - 32.8 Rwanda 34 27.3 40.3 42 97.3 - 46.3 51.9 27.4 56.9
Chad 108.2 - - - 121.4 119.8 -
ECCAS 49.2 13.4 22.4 15.1 24.8 37.7 27.5 36.7 31.5 31.9 ECOWAS
Benin - - - 177.8 168 -
Burkina Faso - - 42.2 36.5 54.6 - - 73.4 31.8 - Cote D’voire 21 23.5 23.1 41.7 19.4 44.1 26.6 60.6 102.9 19.4
Cape Verde 26.6 42.5 - 212.8 69.5 - 40.1 - - - Ghana 49.4 - 35.5 - 31.9 18.4 43.8 25.1 31.9 - Gambia 19.1 - 24.3 - 47.5 21 23.4 65.9 39 - Guinea 19.7 20.4 32 - 22.7 24.9 33.9 45.4 33.4 - Guinea-Bissau 109.2 - - - 88.2 109.5 108.4 43.1 36.8 -
Madagascar - - 30.8 - - 0 0 0 0 0
Mali 39.8 51.6 47.7 37.6 78.2 - 39.2 51.4 53.6 - Niger - - 76.5 - 95.2 - - 48.8 66.6 15.4 Nigeria 45.1 36.1 36.8 57.8 52.3 - 40.8 51.6 52.1 - Senegal - 29.7 41.8 60.1 68.1 - - 61.3 50.1 20.4
Togo - - 32 60.6 35.9 - 45.4 41 36.6 -
DOI: 10.4236/tel.2019.94037 550 Theoretical Economics Letters
Continued
IGAD
Eritrea - 29 76.4 66.6 74.2 - 41.4 - 77.9 - Ethiopia - 42.6 103.1 57.3 44.1 - - 115.8 50.5 28.8
Kenya - 28.8 41.6 34.7 28.6 - 24.1 82.4 44.2 22.2 Sudan - 34.5 57.9 33.4 81.5 - 57.8 58 85.9 71.2 IGAD - 12.8 51.5 27.2 24.3 - 49.5 43.1 53.8 26.5
SADC
Angola - - - 222.9 252.8 -
Botswana - 41.3 - - 98.7 - - - 74.5 -
Congo 52 - - - -
Lesotho - - - -
Madagascar 37.3 - - 23.1 40.8 - 24.7 31.7 - 97.5 Malawi 41.4 - 38.6 45.1 54.6 - - 49.7 48.4 -
Mauritius - 48 93.5 34 - - - 85.6
Mozambique 42 19.4 33.4 - 58 - 32.6 72.9 60.4 47.5
Namibia - 39.6 - - 62.1 - 41.3 - 59.6 -
South Africa 35.6 22.3 34.8 18.1 30 - 27.9 - 37.5 17.6 Tanzania - 24.8 37.7 49 40.5 - - - 43.1 -
Zambia - - - 104.1 -
Zimbabwe - - - 230.2 -
SADC 26.5 18.5 15.9 19.8 15.9 - 23.8 27.5 30.1 45.3
To sum up, instability index at regional level is much lower than individual countries instability index for most strategic agricultural products in many of the RECs. This implies the fact that regional integration in Africa can enhance sta-bility of production of the strategic agricultural products significantly which in turn can improve food availability and hence food security.
5. Conclusions
com-DOI: 10.4236/tel.2019.94037 551 Theoretical Economics Letters modity chain.
The problems of food security and sustainable agricultural development have been at the forefront of the debate on Africa’s development since the Lagos plan of Action in 1963 and the Abuja Treaty of 1991. In the December 2006 AU/ NEPAD summit on Food Security in Africa, a practical solution to this problem evolved. Few strategic commodities, that represent important weight in African food basket, weigh significantly in the trade balance in the region and have con-siderable unexploited production potential, were identified and decided to move market integration beyond the current pace of reform to create a free trade zone at the continent level.
The objective of this research is to evaluate the trade creation effects on the selected agricultural products. It addressed the fundamental question of what ef-fect RTAs in Africa have had on trade in the selected agricultural products, and what is the implication of this on food security. To answer this question, we de-veloped an extended gravity model to estimate the magnitude of trade creation and trade diversion across 9 individual agrifood commodities and for 8 RTAs.
Although the welfare effects are ambiguous when trade creation and trade di-version effects occur, comparison of trade creation and trade didi-version for total agricultural commodities reveal that in three of the eight African RTAs, trade creation far outweighs trade diversion leading to net trade creation effects and hence welfare gain. But in two RTAs, trade diversion exceeds trade creation leading to a net trade diversion and hence welfare loss. For the remaining three RTAs, trade creation is similar to trade diversion and hence difficult to tell the welfare effect.
Are regional trade agreements in Africa building blocks or stumbling blocks in the market integration of agricultural products in Africa? What is the implica-tion of this on food security and sustainable agricultural development?
Our extended gravity model results suggest that some of Africa’s regional trade agreements are effective avenues to promote common market for agricul-tural products. Furthermore, for a few individual agrifood commodities, regional trade agreements in Africa have increased openness to non-members’ trade while increasing trade among themselves to some extent. Thus, RTAs in Africa are an attractive means to speed up the move towards common market for agri-cultural products in the continent. This will have positive implications for food security and sustainable agricultural development on the continent. Further-more, production instability index is smaller at regional level than at individual country level despite some exceptions. This indicates the potential to stabilize production of the strategic agricultural commodities which in turn can enhance food security if integration process in Africa RTAs is enhanced.
Conflicts of Interest
DOI: 10.4236/tel.2019.94037 552 Theoretical Economics Letters
References
[1] FAO (2014) The State of Food Insecurity in the World 2014. Strengthening the Enabling Environment for Food Security and Nutrition. Food and Agriculture Or-ganization of the United Nations, Rome.
[2] FAO (2008) Towards an African Common Market for Agricultural Products. Food and Agriculture Organisation of the United Nations, Rome.
[3] UNCTAD (2009) Economic Development in Africa Report 2009: Strengthening Re-gional Economic Integration for Africa Development, New York and Geneva. [4] World Bank (2000) Trade Blocks, Policy Research Report. Oxford University Press,
Ney York.
[5] Yeats, A. (1998) What Can Be Expected from African Regional Trade Arrange-ments? Some Empirical Evidence, World Bank, Mimeo.
[6] Schiff, M. (1997) Small Is Beautiful: Preferential Trade Agreements and the Impact of Country Size, Market Share, and Smuggling. Journal of Economic Integration,
12, 359-387. https://doi.org/10.11130/jei.1997.12.3.359
[7] Park, J.H. (1995) The New Regionalism and Third World Development. Journal of Developing Societies, 11, 21-35.
[8] Elbadawi, I. (1997) The Impact of Regional Trade and Monetary Schemes on Intra Sub-Saharan Africa trade. In: Ademola O., Elbadawi, I. and Collier, P., Eds., Re-gional Integration and Trade Liberalization in Sub-Saharan Africa, Macmillan, Houndmills, Basinstoke, London.
[9] Evans, D. (1998) Options for Regional Integration in Southern Africa. IDS Working Paper 94, Institute of Development Studies, Sussex.
[10] Lewis, J.D., Robinson, S. and Thierfelder, K. (1999) After the Negotiations: Assess-ing the Impact of Free Trade Agreements in Southern Africa. TMD Discussion Pa-per, International Food Policy Research Institute, Washington DC.
[11] Flores Jr., R. (1997) The Gains from MERCOSUL: A General Equilibrium, Imper-fect Competition Evaluation. Journal of Policy Modeling, 19, 1-18.
https://doi.org/10.1016/0161-8938(95)00139-5
[12] Cernet, L. (2001) Assessing Regional Trade Arrangements: Are South South RTAs More Trade Diverting? Policy Issues in International Trade and Commodities Study Series No. 16, United Nations, New York.
[13] Baier, S.L. and Bergstrand, J.H. (2007) Do Free Trade Agreements Actually Increase Members’ International Trade? Journal of International Economics, 71, 72-95.
https://doi.org/10.1016/j.jinteco.2006.02.005
[14] Baier, S.L., Bergstrand, J.H. and Feng, M. (2014) Economic Integration Agreements and the Margins of International Trade. Journal of International Economics, 93, 339-350. https://doi.org/10.1016/j.jinteco.2014.03.005
[15] Anderson, J.E. (2011) The Gravity Model. Annual Review of Economics, 3, 133-160.
https://doi.org/10.1146/annurev-economics-111809-125114
[16] Dijk, M.V. (2011) African Regional Integration: Implications for Food Security.
http://ssrn.com/abstract=1788157
[17] Cervantes-Godoy, D. and Dewbre, J. (2010) Economic Importance of Agriculture for Poverty Reduction. OECD Food, Agriculture and Fisheries Working Paper No. 23.
DOI: 10.4236/tel.2019.94037 553 Theoretical Economics Letters
[19] Jayasinghe, S. and Sarker, R. (2007) Effects of Regional Trade Agreements on Trade in Agrifood Products: Evidence from Gravity Modelling Using Disaggregated Data.
Review of Agricultural Economics, 30, 61-81.
https://doi.org/10.1111/j.1467-9353.2007.00392.x
[20] Grant, J.H. and Lambert, D.M. (2005) Regionalism in World Agricultural Trade: Lessons from Gravity Model Estimation. The American Agricultural Economics Association Annual Meeting, Providence, 24-27 July 2005.
[21] Márquez-Ramos, L. and Martinez-Gomez, V. (2015) Revisiting the Effect of Trade Preferences Granted to Morocco in the Light of an Export-Orientated Approach for Food Security. In: Paciello, M.C., Ed., Building Sustainable Agriculture for Food Security in the Euro-Mediterranean Area: Challenges and Policy Options, Istituto Affari Internazinali (IAI), Edizioni Nuova Cultura, Roma, 207-224.
[22] Dhehibi, B., Frija, A., Telleria, R. and Aw-Hassan, A. (2015) The Effect of Trade Liberalization on the Sustainability of Agricultural Sectors in Egypt and Tunisia: A New Framework Based TFP Growth Structure. In: Paciello, M.C., Ed., Building Sustainable Agriculture for Food Security in the Euro-Mediterranean Area: Chal-lenges and Policy Options, Istituto Affari Internazinali (IAI), Edizioni Nuova Cul-tura, Roma, 179-201.
[23] UNCTAD (2013) UNCTADstat. http://unctad.org/en/pages/Statistics.aspx [24] Frankel, J., Stein, E. and Wei, S.J. (1995) Trading Blocs and the Americas: The
Natural, the Unnatural, and the Super Natural. Journal of Development Economics, 47, 61-95. https://doi.org/10.1016/0304-3878(95)00005-4
[25] Frankel, J. and Wei, S.J. (1998) Regionalization of World Trade and Currencies: Economics and Politics. In: Frankel, J., Ed., The Regionalization of the World Economy, National Bureau of Economic Research, University of Chicago Press, Chicago.
[26] Wooldridge, J.M. (2002) Econometric Analysis of Cross-Section and Panel Data. MIT Press, Cambridge.
[27] Mayer, T. and Zignago, S. (2011) Notes on CEPII’s Distances Measures: The Geo-Dist Database. CEPII Working Paper.
[28] Frankel, J. (1997) Regional Trading Blocs in the World Economic System. Institute for International Economics, Washington DC.
[29] Afrika, J.G. and Ajumbo, G. (2012) Informal Cross-Border Trade in Africa: Impli-cations and Policy Recommendations. Africa Economic Brief, 3, 1-15.
[30] Golub, S. (2015) Informal Cross-Border Trade and Smuggling in Africa. In: Mor-rissey, O., López, R.A. and Aharma, K., Eds., Handbook on Trade and Develop-ment, Edward Elgar Publishing, Cheltenham, UK Northampton, 179-209.
https://doi.org/10.4337/9781781005316.00016
[31] Lesser, C. and Moisé-Leeman, E. (2009) Informal Cross-Border Trade and Trade Facilitation Reform in Sub-Saharan Africa. OECD Trade Policy Working Paper No. 86.
[32] Koester, U. (1986) Regional Cooperation to Improve Food Security in Southern and Eastern African Countries. Research Report 53, International Food Policy Research Institute, Washington DC.
[33] Badiane, O. (1991) Regional Agricultural Markets and Development Strategies in West Africa. Quarterly Journal of International Agriculture, 30, 37-50.
Re-DOI: 10.4236/tel.2019.94037 554 Theoretical Economics Letters
search Institute, Washington DC.
[35] Cuddy, J.D.A. and Della Valle, P.A. (1978) Measuring the Instability of Time Series Data. Oxford Bulletin of Economics and Statistics, 40, 79-85.