Study on Evaluation Method of Aluminum Alloy
Pulse MIG Welding Stability Based on Arc Voltage
Probability Density
Jing Nie1, Xiao-Feng Meng1, Yu Shi2
1
School of Instrumentation Science & Optoelectronics Engineering, Beihang University, Beijing, China; 2Key Laboratory of Non- Ferrous Metal Alloys and Processing of Ministry of Education, Lanzhou University of Technology, Lanzhou, China.
Email: [email protected]
Received February 24th, 2011; revised April 16th, 2011; accepted April 25th, 2011.
ABSTRACT
Bring forward a new analytical method in order to evaluate the stability of the process of aluminum alloy pulsed MIG welding. The ratio of the first and the second peak in arc voltage signal probability density was selected to evaluate aluminum alloy pulse MIG welding stability. By calculating the arc voltage signal probability density from 80 sets of welding experiments, the ratio of the two peaks in arc voltage probability in every set was captured. And the evaluation system of aluminum alloy pulse MIG welding stability was established. The smaller the ratio of peaks in arc voltage signal probability density is, the better the stability of the welding will be; the bigger the ratio of peaks in arc voltage signal probability density is, the poorer the stability of the welding will be.
Keywords:Aluminum Alloy, Pulse MIG, Welding Stability, Probability-Density, Arc Voltage
1. Introduction
The process of aluminum alloy pulse MIG welding is characterized by its non-linearity, strong time-varying, strong coupling between the parameters, and so forth [1]. The reason why its process is unstable has not been well explained until now. Because of the lack of the parameter matched stability evaluation indicators, the control of the aluminum alloy pulse MIG welding by changing the welding parameters is very difficult. The fail of matching the parameter will probably lead to the instability in the welding process or even worse. In recent years, many scholars at home and abroad have studied the stability in the welding process: reference [2] put forward an on-line evaluation model of the process stability by use of the statistical analysis and partial least-squares regression. Reference [3] and [4] found that the approximate entropy of the arc signal varied with the change of the parameter. Reference [5] and [6] analyzed the probability density of the corresponding welding current and voltage and fi-nally evaluated the welding stability.
This paper analyzed the probability density distribu-tion of the 80 sets of voltage signal under different weld-ing speed, wire-feeder speed and duty cycle matched pa-rameters.
2. Experimental System
The experiment applied DELEX VIRIO MIG-400L welding machine to pure Ar gas shield bead-on-plate welding. The designation of the welding wire was 5356, diameter 1.2 mm. The material of the workpiece was aluminum50581-H321 with the thick of 6mm. The torch was fixed during welding. And its distance between the workpiece was unchanging. The workpiece moved on the worktable. The initial wire extension was 15 mm. Data acquisition card PCL812PG was applied to the welding and its frequency was 1 kHz. The current sensor was CSM400FA/100 mA. The time between the arc igniting and ending was not less than 45 s. Video acquisition captured the condition of the arc and molten pool to judge the stability of the welding. Figure 1 was the ex-perimental system.
Because of the finding that the duty cycle of the pulse current, the wire-feeder speed and welding speed impact the welding stability greatly, the experiment combined the duty cycle, the wire-feeder speed and the welding speed to weld. The base value of the welding current was 25 A, the peak value 180 A, pulse frequency 40 Hz, welding voltage 18 V, and shielding airflow 18 L/min.
Figure 1. Experimental system.
very strict to its parameter matching, the welding pa-rameters in Table 1 were fixed through the welding ex-periments. These parameters could be combined ran-domly. The maximum and minimum of single parameter was the upper and lower limits of the matching. 5 × 4 × 4 sets of welding experiments were conducted and 80 sets of arc voltage signals were acquired.
3. Voltage Signal Probability Distribution
Analysis
With regard to time array x t
,when amplitude fallson the range
x x, x
, the total time is1 k x i T t
.When observation time tends to infinity, array T TX is
the probability of casexx t
x x
, which can bewritten as t x x limTx T
P x x T
the
prob-ability density function can be defined as:
0
0 0
1
P x x t x x
lim
x
1 1
lim lim lim
T x x k x i
x T x
i x
P
T
t
x T T
(1)Probability density function constantly equals to real-value non-negative function. The data must be standardized before analyze its probability density. Every variable minus the mean and then divided by its standard deviation, supposing the collected good-running data ma-trix is
p xn p
XR , each column corresponds to a variable
Table 1 .Welding parameters.
Welding speed cm/min
Wire feed speed m/min
Duty cycle %
11 6 50
15 6.5 44
20 7 40
25 7.3 37.5
31
riable, S s s1, 2,,sp. Then, normalize the standar-
dized data. Finally, calculate and analyze the probability density.
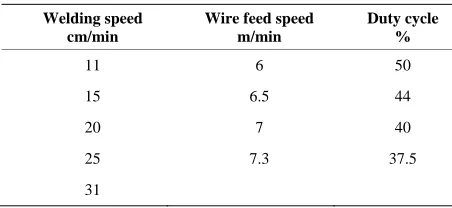
Analyze the probability density of 4 sets of voltage signal selecting from 80 sets of welding experiments arranging from good to bad. Every set of voltage signal cut from the 10th second and 30000 points were captured, namely 30 seconds. The results are shown in Figure 2.
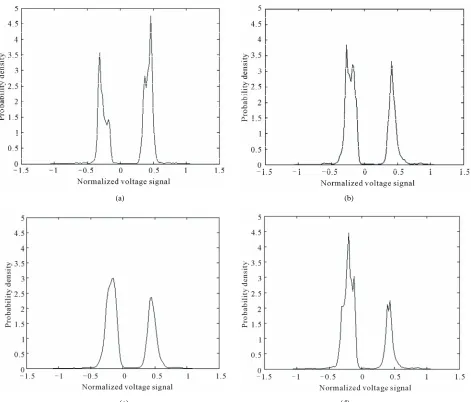
According to Figure 2, two peak values were found in each set of probability density distribution figure and the distance between the two peaks increase. In order to get the accurate variation of the two peaks from 4 sets of experiments, the ratio of the first peak and the second peak was selected to reflect the variation of the distance between the two peaks. The variation of the ratio was shown in Figure 3.
The ratio of the two voltage probability density peaks gradually increase in the four sets of experiments. After comparing the corresponding weld bead, it was found that the ratio of peaks was small when the weld bead shaping was good, and the opposite was big. The second set and the fourth set were shown in Figure 4. Obviously, the weld bead of the second set was better than that of the fourth. And the ratio of peaks of the second set was smaller than that of the fourth. Therefore, the ratio of the two peaks in voltage probability can be applied to evalu-ate the stability of aluminum allay MIG welding.
4. Evaluation System of Welding Stability
[image:2.595.58.284.618.722.2]
(a) (b)
[image:3.595.63.534.93.495.2]
(c) (d)
Figure 2. Probability density of voltage. (a) NO.1; (b) NO.2; (c) NO.3; (d) NO.4.
(a)
(b)
[image:3.595.65.277.528.692.2]Figure 4. The weld of different parameters. (a) NO.1; (b) O.4.
Figure 3. Changes in the ratio of peaks in probability
den-sity. N
[image:3.595.309.536.539.686.2]
(a) (b)
[image:4.595.71.525.96.373.2]
(c) (d)
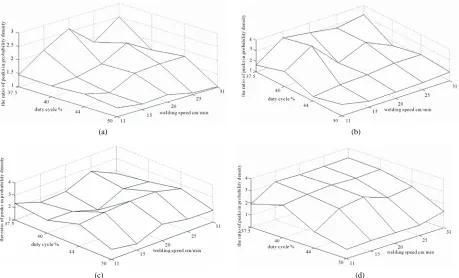
Figure 5. The match of welding and wire feed speeds on different duty cycle. (a) duty cycle 50%, (b) duty cycle 44%, (c) duty cycle 40%, (d) duty cycle 37.5%.
(a) (b)
(c) (d)
[image:4.595.68.527.414.692.2]
(a) (b)
[image:5.595.63.534.95.380.2]
(c) (d)
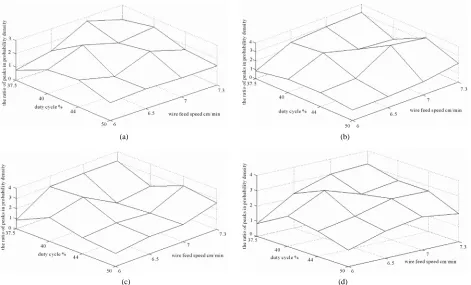
[image:5.595.57.540.436.624.2]Figure 7. The match of wire feed speeds and duty cycle on different welding speeds.(a) welding speed 11 cm/min; (b) welding speed 15 cm/min;(c) welding speed 20 cm/min; (d) welding speed 25 cm/min.
Table 2. The ratio of peaks in voltage probability density and weld forming under different welding parameters.
Number Wire feed speed m/min Duty cycle % Welding speed cm/min
Ratio of peaks in
probability density Stability Welding forming
1 6 50 11 1.3333 Stable Good
2 6 44 15 1.24 Stable Good
3 6 37.5 20 2.6111 Unstable Bad
4 6.5 44 25 2.1 Unstable Bad
5 6.5 40 15 4 Unstable Bad
6 6.5 37.5 20 3.0625 Unstable Bad
7 7 44 11 2.7778 Unstable Bad
8 7 40 25 2.35 Unstable Bad
9 7.3 50 20 0.8649 Stable Good
of the welding will be. The opposite is the instability of the welding.
Table 2 shows the ratio of peaks in voltage probability density and weld forming under different welding pa-rameters, through which the ratio of peaks in arc voltage signal probability density and the welding stability can be compared more objectively.
5. Conclusions
This paper is supported by the National Natural Science Foundation of China under Grant No.50675093 and Na-tional Natural Science Foundation of InternaNa-tional Co-operation under Grant No.50710105060. Thanks for help from Key Laboratory of Non-ferrous Metal Alloys and Processing of Ministry of Education, Lanzhou University of Technology.
REFERENCES
[1] S. Yamada and K. Masubuchi, “Advanced Welding Technology Keeps Japan’s High-Speed Trains on Trac,”
[4] B. Cao, X. Q. Lv, M. Zeng and S. S. Huang, “Analysis of Welding Conditions in Short-Circuiting Transition Base on Approximate Entropy,” Chinese Journal of Mechanical Engineering, Vol. 43, No. 10, October 2007, pp. 50-54. doi:10.3901/JME.2007.10.050
[5] Y. Zhang, X. Xu and Y. Cai, “Collection and Analysis System of Welding Parameters Based on LabView,”
Transactions of the China Welding Institution, Vol. 24, No. 4, August 2003, pp. 43-46.