“My Curiosity was Satisfied, but not in a Good Way”:
Predicting User Ratings for Online Recipes
Can Liu, Chun Guo, Daniel Dakota , Sridhar Rajagopalan, Wen Li, Sandra K¨ubler Indiana University
{liucan, chunguo, ddakota, srrajago, wl9, skuebler}@indiana.edu Ning Yu
University of Kentucky ning.yu@uky.edu
Abstract
In this paper, we develop an approach to automatically predict user ratings for recipes at Epicuri-ous.com, based on the recipes’ reviews. We investigate two distributional methods for feature se-lection, Information Gain and Bi-Normal Separation; we also compare distributionally selected features to linguistically motivated features and two types of frameworks: a one-layer system where we aggregate all reviews and predict the rating vs. a two-layer system where ratings of individual reviews are predicted and then aggregated. We obtain our best results by using the two-layer architecture, in combination with 5 000 features selected by Information Gain. This setup reaches an overall accuracy of 65.60%, given an upper bound of 82.57%.
1 Introduction
Exchanging recipes over the internet has become popular over the last decade. There are numerous sites that allow us to upload our own recipes, to search for and to download others, as well as to rate and review recipes. Such sites aggregate invaluable information. This raises the question how such sites can select good recipes to present to users. Thus, we need to automatically predict their ratings.
Previous work (Yu et al., 2013) has shown that the reviews are the best rating predictors, in comparison to ingredients, preparation steps, and metadata. In this paper, we follow their approach and investigate how to use the information contained in the reviews to its fullest potential. Given that the rating classes are discrete and that the distances between adjacent classes are not necessarily equivalent, we frame this task as a classification problem, in which the class distribution is highly skewed, posing the question of how to improve precision and recall especially for the minority classes to achieve higher overall accuracy. One approach is to identifyn-gram features of the highest discriminating power among ratings, from a large number of features, many of which are equally distributed over ratings. An alternative strategy is to select less surface-oriented, but rather linguistically motivated features. Our second question concerns the rating predictor architecture. One possibility is to aggregate all reviews for a recipe, utilizing rich textual information at one step (one-layer architecture). The other possibility is to rate individual reviews first, using shorter but more precise language clues, and then aggregate them (two-layer). The latter approach avoids the problem of contradictory reviews for a given review, but it raises the question on how to aggregate over individual ratings. We will investigate all these approaches.
The remainder of the paper is structured as follows: First, we review related work in section 2. Then, in section 3, we motivate our research questions in more detail. Section 4 describes the experimental setup, including the data preparation, feature extraction, classifier, and evaluation. In section 5, we present the results for the one-layer experiments, and in section 6 for the two-layer experiments. Section 7 investigates a more realistic gold standard. We then conclude in section 8.
2 Related Work
This section provides a brief survey for sentiment analysis on online reviews.
This work is licenced under a Creative Commons Attribution 4.0 International License. Page numbers and proceedings footer are added by the organizers. License details:http://creativecommons.org/licenses/by/4.0/
During the last decade or more, there has been significant body of sentiment analysis studies on online reviews. Two major approaches exist: lexicon-based and machine learning. A lexicon-based approach requires prior knowledge of important sentiment features to build a list of sentiment-bearing words (or phrases), which are often domain independent. Examples of such lexicons include the Multi-Perspective Question Answering (MPQA) subjectivity lexicon (Wilson et al., 2005) and the Linguistic Inquiry and Word Count (LIWC) dictionary (Pennebaker et al., 2014). The sentiment of a review is determined by various ways of aggregating information about the sentiment-bearing words (phrases), such as their frequency and sentiment scores. The machine learning approach dominantly adopts supervised learning algorithms, which treat sentiment analysis as a text classification task. In this case, sentiment features are generated from a pre-labeled corpus. Given the lack of annotated data, semi-supervised learning is adopted (Yu, 2014; Yu and K¨ubler, 2011). For this study, we focus on a specific language domain of online recipe reviews, which has user ratings, thus we choose supervised learning. We also adopt one existing linguistic lexicon to provide extra features for our classification models.
The earliest sentiment analysis on online reviews was done by Pang et al. (2002); they applied several supervised learning algorithms to classify online movie reviews into a positive and a negative class. This study found that machine learning methods outperformed human annotators. It also found that bigrams did not improve the classification performance, whether used alone or with unigrams, which has been confirmed by many following studies. However, Cui et al. (2006) later conjectured that when the training corpus is large enough, adding bigrams to unigrams improved the accuracy of binary product review classification. A great number of diverse features were proven to be beneficial to capture subtle sentiments across studies and a “kitchen sink” approach is often adopted for sentiment analysis (Yang et al., 2008). However, when features are noisy and redundant, researcher have found it beneficial to identify the most telling ones (Gamon, 2004; Ng et al., 2006).
While it is useful to differentiate positive and negative reviews, a finer level of distinction can help users better compare online reviews. As a matter of fact, even extra half star ratings can have dramatic economic impact (Anderson and Magruder, 2012). To predict multi-level ratings, either multiclass clas-sification or regression methods can be applied (Koppel and Schler, 2006; Yu et al., 2013). Pang and Lee (2005) have also proposed an alternative meta-algorithm based on metric labeling for predicting three or four sentiment classes for movie reviews. In their experiments, the meta-algorithm outperformed SVMs in either one-versus-all or regression mode. In order to adopt this meta-algorithm, however, one needs to determine an effective review similarity measure, which is not always straightforward.
If an item receives multiple reviews and/or comes from multiple sources, an overall rating needs to be generated for this item. Yu et al. (2013) generated this overall rating by treating all the reviews from one recipe as one long review. In this study, we are going to investigate how to integrate review-level rating predictions to generate a recipe-level prediction. Rating aggregation has been studied intensively for collaborative filtering, where the user/rater’s bias is adjusted (e.g., the trustworthy user’s rating has more influence than others (McGlohon et al., 2010)). Since our current study does not take raters’ information into consideration, we are going to stay with the sample aggregation method. A study by Garcin et al. (2009) suggests that among mean, median, and mode, the median is often a better choice as it is not as sensitive to outliers as the mean.
3 Research Questions
3.1 Feature Selection
Our primary feature set is based on word and POSn-grams. This results in an extremely large feature set of 449 144 features, many of which do not serve any discriminatory function. A common first step to trimming the feature set is to delete stop words. However, in the cooking domain, it is unclear whether stop words would help. Feature selection is used to identifyn-grams tightly associated with individual ratings. Additionally, a extremely high dimensional feature representation makes model training and testing more time consuming, and is likely to suffer from overfitting - given a large number of parameters needed to describe the model. Due to the exponential computation time required by wrapper approaches for feature selection, we use filtering approaches which are based on statistics about the distribution of features. Previous research (Liu et al., 2014) indicates that Bi-Normal Separation (BNS) (Forman, 2003) and Information Gain (IG) yield best results for this task. Information Gain is defined as follows:
IG=H(S)−H(S|f) = X f∈{0,1}
X
S∈{0,1}
P(f, S)logPP(f(f, S)P(S))
whereS is the positive class,f a feature, and P(f, S)the joint probability of the feature f occurring with classS. Bi-Normal Separation finds the separation of the probability of a feature occurring in the positive class vs. the negative class, normalized by F−1, which is the inverse function of the standard
normal cumulative probability distribution. Bi-Normal Separation is defined as follows:
BNS =|F−1(DDSf S )−F
−1(DSf
DS )|
where DS is the number of documents in class S,DS the number of documents in classS, DSf the number of documents in class S where featuref occurs, andDS,f the number of documents in class S where featuref occurs. TheF−1 function exaggerates an input more dramatically when the input is
close to0or1, which means that BNS prefers rare words.
Since both metrics are defined for binary classification, the features are chosen in terms of a separation of the recipes into “bad” ratings (1-fork and 2-fork) versus “good” ratings (3-fork and 4-fork), on the assumption that the selected features will be predictive for the more specific classes as well. For review-based experiments, the features are chosen with regard to “good” and “bad” individual reviews.
3.2 Linguistically Motivated Features
Linguistic features In order to examine whether linguistic information can improve prediction accu-racy, linguistically motivated features were extracted from the data. We selected seven features based on the assumption that they reveal a sense of involvedness or distance of the reviewer, i.e., that authors distance themselves from a recipe to indicate negative sentiment and show more involvedness to indicate positive sentiment. These seven features are:
1. The percentage of personal pronouns per sentence. 2. The number of words per sentence.
3. The total number of words in the review. 4. The percentage of passive sentences per review. 5. The number of punctuation marks per sentence. 6. The number of capitalized characters per sentence. 7. The type/token ratio per review.
Our hypothesis is that the longer the review, the more likely it indicates a negative sentiment as the review may go at lengths to indicate why something was negative.
Similarly, using the passive voice can be viewed as distancing oneself from the review indicating a sense of impartial judgement, most likely associated with negativity, as one tends to actively like some-thing (i.e. “We liked it” versus “It wasn’t well seasoned.”). Since some reviews with strong emotions are written in all capital letters as well as contain many punctuation marks (particularly “!”), these features are also collected as possible indicators of sentiment.
Lexicon-based features In addition, we used an existing lexicon, the Linguistic Inquiry and Word Count (LIWC) dictionary (Pennebaker et al., 2014), to analyze several emotional and cognitive dimen-sions in the recipe reviews. This lexicon is chosen over other sentiment lexicons because it covers a broad range of categories beyond simply positive and negative emotions. Briefly, it contains general descriptor categories (e.g., percentage of words captured by the dictionary), standard linguistic dimensions (e.g., percentage of words in the text that are pronouns), word categories tapping psychological constructs (e.g., biological processes), personal concern categories (e.g., work), spoken language dimensions (e.g., accent), and punctuation categories. Details of these dimensions can be found in the LIWC 2007 manual. For our study, we first extracted all the features from a review set independent from our training/test set. We then selected the LIWC features with highest power to differentiate four rating classes based on Information Gain. Below are the 15 selected features. Note that the linguistic features here are document-level features, not sentence-level features, as proposed above.
• Linguistic Processes
– Negations(e.g., never, no): 57 words
– 1st person plural(e.g., we, us): 12 words
– Exclamation mark • Psychological Processes
– Affective process: this high level category contains 915 positive/negative emotions, anxiety, anger and sadness related terms.
– Positive emotion(e.g., love, nice, sweet): 406 words
– Negative emotion(e.g., hurt, ugly, nasty): 499 words
– Sadness(e.g., crying, grief): 101 words
– Exclusive(e.g., but, exclude): 17 words
– Tentative(e.g., maybe, perhaps, guess): 155 words
– Causation(e.g., because, hence): 108 words
– Discrepancy(e.g., should, would, could) : 76 words
– Certainty(e.g., always, never): 83 words
– Sexual(e.g., love): 96 words
– Feel(e.g., feel, touch): 75 words • Personal Concerns
– Leisure(e.g, cook, chat, movie): 229 words
1 fork 108 2 fork 787 3 fork 5 648 4 fork 3 546
Table 1: The distribution of ratings in the Epicurious data.
include: Thesexualfeatures are positively correlated with high ratings, which is mainly due to the word “love” in its non-sexual meaning. People tend to use more words from the perception processes category
feelwhen they complain about a recipe.
3.3 One-Layer Prediction Versus Two-Layer Prediction
The one-layer or recipe-based approach consider all reviews per recipe as a single document. This approach has rich textual information, especially when a large number of reviews exist for a recipe. However, the concern with this approach is that the reviews in themselves may be varied. There are recipes whose reviews range from the lowest to the highest rating. Given such a range of individual ratings, we can assume that the recipe-based approach will be faced with a contradictory feature set for certain recipes. For this reason, we also investigate a two-layer or review-based approach. Here, every individual review is rated automatically. In a second step, we aggregate over all reviews per recipe. Aggregation can either take the form of majority voting, average, or of a second classifier which takes the aggregated ratings as features to make a final decision. However, this approach will suffer from often very short reviews, which do not allow the extraction of sufficient features as well as from the inequality in the number of reviews per recipe.
4 Experimental Setup
4.1 Data Set
We scraped user reviews for 10 089 recipes, published on the Epicurious website1before and on April 02,
2013. Typically, a recipe contains three parts: ingredients, cooking instructions, and user reviews. In our experiments, we focus exclusively on the reviews. Each user review has a rating for this recipe, ranging from 1 fork to 4 forks. There is also an overall rating per recipe, which is the average of all reviews ratings as well as ratings submitted without reviews. Half forks are possible for recipe rating but not for review ratings. These recipes were pre-processed to remove reviews with zero ratings. Recipes that had no reviews were then subsequently removed. In order to counter the effect of the wide variance in the number of reviews per recipe, we randomly sampled 10 reviews from recipes with more than 10 reviews. We had performed initial experiments with all reviews, which resulted in only minor differences. At the review level, rare words (unigrams occurring less than four times) were removed for two reasons: 1) Extremely rare words are likely to be noise rather than sentiment-bearing clues; 2) the feature selection method BNS is biased towards rare words; 3) such words do not generalize well. The recipes were then tagged using the Stanford POS Tagger (Toutanova et al., 2003).
The data set is severely skewed with regard to the number of recipes per fork: Users seem to be more willing to review good recipes. To lessen the effect of imbalance in the rating classifier, all half fork reviews were added to their corresponding full star reviews (i.e., 1.5 fork was added to the 1 fork data). This resulted in the data split of 10 089 recipes shown in table 1. Even after collapsing the half stars, there is still a very large skewing of the data towards the higher ratings. This means, feature selection is important to mitigate the imbalance to a certain degree.
4.2 Features
In addition to the linguistic features described in section 3.2, we also extracted n-gram features: word unigrams, bigrams, and trigrams as well as POS tag unigrams, bigrams, and trigrams. Since the data
Method 750 900 1 000 1 500 3 000 6 000
BNS – – 31.33 – 42.00 50.67
[image:6.595.164.435.62.106.2]IG 62.00 62.00 62.33 62.33 61.00 58.67
Table 2: Results for feature selection based on Bi-Normal Separation (BNS) and Information Gain (IG).
includes tokens particular to the web, modifications were made to the data to help with the processing of these types of tokens. URLs were replaced with a single URL token and tagged with a unique “URL” tag. Emoticons were defined as either positive or negative and subsequently replaced by EMOP or EMON respectively. Since it is unclear for this task whether more frequent feature should receive a larger weight, we normalized features values to a range of [0,1].
4.3 Classifiers
Preliminary experiments were run to determine the best classifier for the task. We decided on Support Vector Machines in the implementation of SVM multi-class V1.01 (Crammer and Singer, 2002) for both review-level and recipe-level rating prediction. Initial experiments showed that SVM multi-class V1.01 reaches higher results on our skewed data set than the current V2.20. For this reason, all experiments reported in this paper are based on V1.01 with its default settings, i.e., using a linear kernel.
To aggregate review-level ratings into a recipe-level prediction, we experimented with both the max-imum entropy classifier in the implementation of the Stanford Classifier (Manning and Klein, 2003) and the SVM multi-class classifier. We included Maxent Classifier because given the small number of features it is no longer clear whether SVM is advantageous.
4.4 Baseline
The baseline was established following Yu et al. (2013) as selecting the label of majority class (3-fork) to tag all recipes, producing an accuracy of 56.00% for both one-layer and two-layer systems.
4.5 Evaluation
Evaluation was performed using 3-fold cross validation. Since the data is skewed, we report Precision (P), Recall (R), and F-Scores (F) for all classes across each experiment, along with standard accuracy.
5 Results for One-Layer Prediction
5.1 Feature Selection
We first investigated the effect of feature selection, varying the number of included features from 750 to 6 000. Results for the two methods and different feature thresholds are shown in table 2. Since previous work (Liu et al., 2014) showed that BNS has a tendency to select infrequent n-grams and would need a larger number of features than IG to achieve good performance, we tested the higher ranges of 1 000, 3 000, 6 000 features. None of these experiments yields an accuracy higher than the baseline of 56.00%. On the other hand, the performance of Information Gain peaks at 1 000 and 1 500 features, and we reach an absolute increase in accuracy of 6.33%. Given these experiments, for all following experiments, we use the combination of Information Gain and 1 000n-gram features.
5.2 Linguistically Motivated Features
Here, we test the contribution of the linguistically motivated features introduced in section 3.2. To allow a comparison to previous experiments, we report the baseline and the results for using Information Gain. For the two sets of linguistically motivated features, we used the following combination of features:
1. Lexicon-based features (Lex) combined with linguistic features (Ling) (22 features).
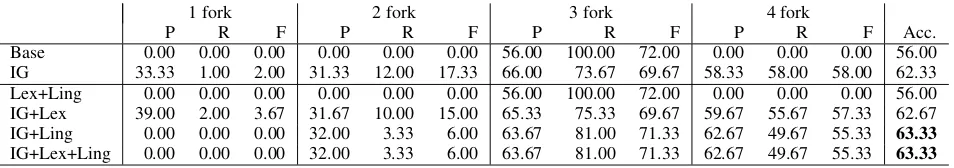
1 fork 2 fork 3 fork 4 fork
P R F P R F P R F P R F Acc.
[image:7.595.65.549.57.255.2]Base 0.00 0.00 0.00 0.00 0.00 0.00 56.00 100.00 72.00 0.00 0.00 0.00 56.00 IG 33.33 1.00 2.00 31.33 12.00 17.33 66.00 73.67 69.67 58.33 58.00 58.00 62.33 Lex+Ling 0.00 0.00 0.00 0.00 0.00 0.00 56.00 100.00 72.00 0.00 0.00 0.00 56.00 IG+Lex 39.00 2.00 3.67 31.67 10.00 15.00 65.33 75.33 69.67 59.67 55.67 57.33 62.67 IG+Ling 0.00 0.00 0.00 32.00 3.33 6.00 63.67 81.00 71.33 62.67 49.67 55.33 63.33 IG+Lex+Ling 0.00 0.00 0.00 32.00 3.33 6.00 63.67 81.00 71.33 62.67 49.67 55.33 63.33
Table 3: Results for manually selected features.
1 fork 2 fork 3 fork 4 fork
no. feat. P R F P R F P R F P R F Acc.
1000 61.57 58.11 59.79 53.70 37.42 44.11 63.04 42.14 50.51 71.30 89.08 79.20 67.80 2000 61.65 58.27 59.91 52.96 39.40 45.18 63.37 43.19 51.37 71.86 88.70 79.40 68.11 3000 62.50 58.51 60.44 52.98 40.88 46.15 62.90 44.49 52.12 72.45 88.10 79.51 68.34 4000 62.45 58.45 60.38 52.38 41.05 46.03 62.99 45.54 52.86 72.83 87.70 79.58 68.46 5000 62.32 57.00 59.54 51.66 41.17 45.82 62.21 46.15 52.99 73.05 87.24 79.52 68.31
Table 4: Results on individual reviews for the two-layer experiments.
3. Linguistic features (Ling) combined with the 1 000 features selected by Information Gain (IG) (1007 features).
4. A combination of all three sets of features (IG+Lex+Ling) (1022 features).
The results for these experiments are reported in table 3. These results show that a combination of the two sets of linguistically motivated features does not increase accuracy over the baseline. In fact, the classification is identical to the baseline, i.e., all recipes are grouped into the majority class of 3-fork. We assume that the linguistically motivated features are too rare to be useful. If we add the lexicon-based features to the ones selected by Information Gain, we reach a minimal improvement over only the IG features: accuracy increases from 62.33% to 62.67%. This increase is mostly due to a better performance on the minority class of 1 fork. If we add the 7 linguistic features to the IG features, we reach the highest accuracy of 63.33%. However, this is due to a more pronounced preference for selecting the majority class. Adding the lexicon-based features to this feature set does not give any further improvements.
6 Results for Two-Layer Prediction
In this section, we investigate the two-layer or review-based prediction. For these experiments, we per-formed feature selection on the individual reviews using IG. Adding the linguistically motivated features considerably decreased performance. We assume that these features do not generalize well on the shorter reviews.
Note that the task approached here is a difficult task since the recipe rating on Epicurious is not the average over all the ratings associated to the individual reviews but also includes ratings by user who did not write a review. If we average over all the sampled gold standard review ratings per recipe, we reach an accuracy of 82.57%. This is the upper bound that we can reach in these experiments.
6.1 Classifying Individual Reviews
[image:7.595.73.550.61.145.2]1 fork 2 fork 3 fork 4 fork
no. f. sys. P R F P R F P R F P R F Acc.
[image:8.595.73.560.62.234.2]1000 avg 44.64 36.98 40.45 60.00 23.03 33.28 75.72 51.91 61.59 52.38 86.01 65.11 61.48 maxent 43.87 33.33 37.88 58.30 19.73 29.48 73.90 58.77 65.47 55.03 81.40 65.67 63.41 svm 62.21 62.21 62.21 56.18 16.03 24.94 72.24 58.14 64.43 53.92 80.82 68.68 62.21 2000 avg 44.61 38.83 41.52 61.45 24.29 34.82 76.12 53.96 63.15 53.45 85.53 65.79 62.58 maxent 43.17 34.27 38.21 61.47 21.23 31.56 74.43 60.93 67.01 56.27 80.93 66.38 64.58 svm 63.29 63.29 63.29 56.53 16.79 25.89 72.65 60.32 65.91 55.14 80.26 65.37 63.29 3000 avg 42.71 38.86 40.69 61.08 26.57 37.03 75.62 54.33 63.23 53.71 84.60 65.71 62.64 maxent 42.40 35.20 38.47 61.90 23.40 33.96 74.00 61.90 67.41 56.83 79.73 66.36 64.84 svm 63.53 63.53 63.53 54.09 17.41 26.34 72.14 61.45 66.37 55.80 79.02 65.41 63.53 4000 avg 38.64 34.22 36.30 61.09 24.89 35.37 75.23 55.91 64.15 54.34 83.81 65.93 63.07 maxent 38.37 31.47 34.58 60.67 22.47 32.79 73.80 63.03 67.99 57.47 79.00 66.54 65.16 svm 64.03 64.03 64.03 52.92 17.53 26.33 72.24 62.85 67.22 56.51 78.17 65.60 64.03 5000 avg 39.23 37.05 38.11 59.20 24.89 35.05 75.38 56.25 64.42 54.54 83.64 66.03 63.23 maxent 38.03 33.40 35.56 58.37 22.00 31.96 73.97 64.17 68.72 58.13 78.57 66.82 65.60 svm 64.68 64.68 64.68 50.19 17.40 25.84 72.52 64.18 68.10 57.45 77.95 66.15 64.68
Table 5: Results on aggregating reviews for the two-layer experiments.
for the non-majority classes are considerably higher than in the recipe-based setting. Thus, we expect to obtain more balanced results across classes in the aggregation as well.
6.2 Predicting Recipe Ratings by Aggregating Reviews
When aggregating review predictions to recipe rating, we use three methods: 1) Taking the average of the review ratings from the previous step; 2) using SVM; and 3) using a maximum entropy classifier (Maxent), the Stanford Classifier. When calculating the average over review rating predictions, the final average is rounded up. The results are reported in table 5. When using SVM and the maximum entropy classifier, we use four features, corresponding to the four ratings. The feature values are calculated as the percentage of reviews from the target recipe that were assigned to this fork rating by our review-level classifier.
Overall, the maximum entropy classifier yields the best performance, independent of the number of features used for the review-level classifier. The highest performance we reach by using 5 000 features and the maximum entropy classifier. Calculating the average results in the worst performance. Although Epicurious calculates the average user ratings based on review ratings and singular ratings, keep in mind that we use at most 10 reviews per recipe, hence only capture part of the image. This may explain why simply calculating the average does not work well. When looking at the F-scores for each fork in table 5, however, the maximum entropy classifier produces lower performance than average and SVM classifier for the 1 fork and 2 fork classes. For 1 fork, SVM has the highest F-scores for different numbers of features, followed by the averaging approach while for 2 fork, the average approach produced the highest F-scores. One possible explanation is that recipes with lower ratings have relatively small numbers of reviews and thus may be less impacted by our sampling.
7 Towards a More Realistic Gold Standard
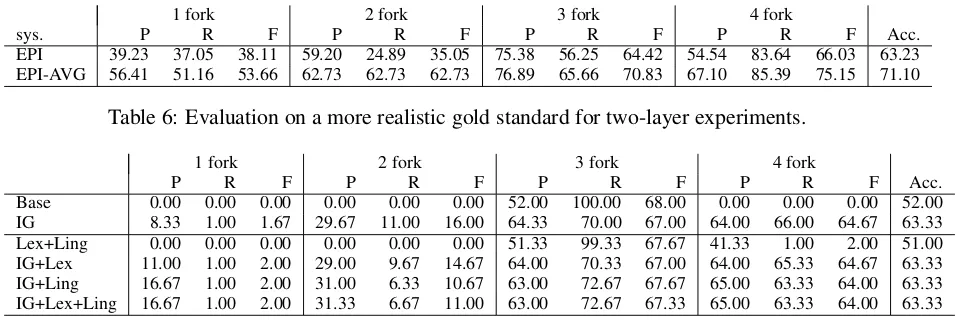
1 fork 2 fork 3 fork 4 fork
sys. P R F P R F P R F P R F Acc.
[image:9.595.70.550.60.220.2]EPI 39.23 37.05 38.11 59.20 24.89 35.05 75.38 56.25 64.42 54.54 83.64 66.03 63.23 EPI-AVG 56.41 51.16 53.66 62.73 62.73 62.73 76.89 65.66 70.83 67.10 85.39 75.15 71.10
Table 6: Evaluation on a more realistic gold standard for two-layer experiments.
1 fork 2 fork 3 fork 4 fork
P R F P R F P R F P R F Acc.
Base 0.00 0.00 0.00 0.00 0.00 0.00 52.00 100.00 68.00 0.00 0.00 0.00 52.00 IG 8.33 1.00 1.67 29.67 11.00 16.00 64.33 70.00 67.00 64.00 66.00 64.67 63.33 Lex+Ling 0.00 0.00 0.00 0.00 0.00 0.00 51.33 99.33 67.67 41.33 1.00 2.00 51.00 IG+Lex 11.00 1.00 2.00 29.00 9.67 14.67 64.00 70.33 67.00 64.00 65.33 64.67 63.33 IG+Ling 16.67 1.00 2.00 31.00 6.33 10.67 63.00 72.67 67.67 65.00 63.33 64.00 63.33 IG+Lex+Ling 16.67 1.00 2.00 31.33 6.67 11.00 63.00 72.67 67.33 65.00 63.33 64.00 63.33
Table 7: Evaluation on a more realistic gold standard for one-layer experiments.
Epicurious (EPI) and based on the new gold standard (EPI-AVG). These results show that based on this more realistic gold standard, averaging over the individual reviews results in an accuracy of 71.10%, however with an upper bound of 100% instead of 82.57%. The results for the on-layer experiments are not as sensitive to this new gold standard. The baseline, which loses 4%, shows that now, the task is more difficult. All combinations involving IG selected features reach an accuracy of 63.33%, the same as for the Epicurious gold standard (see table 3).
8 Conclusion and Future Work
In this study, we have explored various strategies for predicting recipe ratings based on user reviews. This is a difficult task due to systemic reasons, user bias, as well as exogenous factors: 1) There are user ratings that do not come with reviews, which means that they constitute hidden information for our classifiers (so that we have an upper bound of 82.57% in overall accuracy). 2) Ratings are not entirely supported by text, i.e., some ratings seem to be independent from the review text, due to user behavior (e.g., people tend to give higher ratings in good weather than in bad weather (Bakhshi et al., 2014)).
Our experiments suggest that a two-layer approach, which predicts review-level ratings and aggregates them for the recipe-level rating, reaches a higher accuracy than the one-layer approach that aggregates all reviews and predicts on the recipe level directly, with a 3.6% absolute improvement in accuracy. If we evaluate the two-layer results on a more realistic gold standard, we achieve an even higher increase of 12.3%.
Our experiments also suggest that with feature selection, automatically generatedn-gram features can produce reasonable results without manually generated linguistic cues and lexicons, although the latter does show a slight improvement, especially for minority classes.
A few directions can be taken for our future study: 1) Handling short reviews with better methods for dealing with sparse features. 2) The feature selection is conducted within a binary classification scenario (1- and 2-forks vs. 3- and 4-forks). It is worth exploring the effect of feature selection within four 1 vs. all scenarios (i.e., 1-fork against the rest, etc.). 3) We will explore aspect-level sentiment classification to provide a finer-grained summary of the recipes.
References
Michael Anderson and Jeremy Magruder. 2012. Learning from the crowd: Regression discontinuity estimates of the effects of an online review database.The Economic Journal, 122:957–989.
Saeideh Bakhshi, Partha Kanuparthy, and Eric Gilbert. 2014. Demographics, weather and online reviews: A study of restaurant recommendations. InProceedings of the WWW conference, Seoul, Korea.
Hang Cui, Vibhu Mittal, and Mayur Datar. 2006. Comparative experiments on sentiment classification for online product reviews. InProceedings of the 21st National Conference on Artificial Intelligence, AAAI’06, pages 1265–1270, Boston, Massachusetts.
George Forman. 2003. An extensive empirical study of feature selection metrics for text classification.Journal of Machine Learning Research, 3:1289–1305.
Michael Gamon. 2004. Sentiment classification on customer feedback data: Noisy data, large feature vectors, and the role of linguistic analysis. InProceedings of the 20th International Conference on Computational Linguistics (COLING), pages 841–847, Geneva, Switzerland.
Florent Garcin, Boi Faltings, Radu Jurca, and Nadine Joswig. 2009. Rating aggregation in collaborative filtering systems. InProceedings of the Third ACM Conference on Recommender Systems, pages 349–352, New York, NY.
Moshe Koppel and Jonathan Schler. 2006. The importance of neutral examples in learning sentiment. Computa-tional Intelligence Journal, 22:100–109. Special Issue on Sentiment Analysis.
Can Liu, Sandra K¨ubler, and Ning Yu. 2014. Feature selection for highly skewed sentiment analysis tasks. In
Proceedings of the Second Workshop on Natural Language Processing for Social Media (SocialNLP), Dublin, Ireland.
Christopher Manning and Dan Klein. 2003. Optimization, maxent models, and conditional estimation without magic. Tutorial at HLT-NAACL 2003 and ACL 2003.
Mary McGlohon, Natalie Glance, and Zach Reiter. 2010. Star quality: Aggregating reviews to rank products and merchants. InProceedings of Fourth International Conference on Weblogs and Social Media (ICWSM), pages 114–121, Washington, DC.
Vincent Ng, Sajib Dasgupta, and S. M. Niaz Arifin. 2006. Examining the role of linguistic knowledge sources in the automatic identification and classification of reviews. InProceedings of COLING/ACL, pages 611–618, Sydney, Australia.
Bo Pang and Lillian Lee. 2005. Seeing stars: Exploiting class relationships for sentiment categorization with re-spect to rating scales. InProceedings of the 43rd Annual Meeting on Association for Computational Linguistics, ACL, pages 115–124, Ann Arbor, MI.
Bo Pang, Lillian Lee, and Shivakumar Vaithyanathan. 2002. Thumbs up?: Sentiment classification using machine learning techniques. InProceedings of the Conference on Empirical Methods in Natural Language Processing, EMNLP, pages 79–86, Philadelphia, PA.
James Pennebaker, Roger Booth, and Martha Francis, 2014. Linguistic inqury and word count: LIWC 2007 operator’s manual. http://homepage.psy.utexas.edu/HomePage/Faculty/Pennebaker/
Reprints/LIWC2007_OperatorManual.pdf.
Kristina Toutanova, Dan Klein, Christopher Manning, and Yoram Singer. 2003. Feature-rich part-of-speech tagging with a cyclic dependency network. InProceedings of HLT-NAACL 2003, pages 252–259, Edmonton, Canada.
Theresa Wilson, Janyce Wiebe, and Paul Hoffmann. 2005. Recognizing contextual polarity in phrase-level senti-ment analysis. InProceedings of the Conference on Empirical Methods in Natural Language Processing, pages 347–354, Vancouver, Canada.
Kiduk Yang, Ning Yu, and Hui Zhang. 2008. WIDIT in TREC2007 blog track: Combining lexicon-based methods to detect opinionated blogs. InProceedings of the 16th Text Retrieval Conference, Gaithersburg, MD.
Ning Yu and Sandra K¨ubler. 2011. Filling the gap: Semi-supervised learning for opinion detection across domains. InProceedings of the Fifteenth Conference on Computational Natural Language Learning, CoNLL, pages 200– 209, Portland, OR.
Ning Yu, Desislava Zhekova, Can Liu, and Sandra K¨ubler. 2013. Do good recipes need butter? Predicting user ratings of online recipes. InProceedings of the IJCAI Workshop on Cooking with Computers, Beijing, China. Ning Yu. 2014. Exploring co-training strategies for opinion detection. Journal of the Association for Information