soft spheres
J. Winkelmann,1 B. Haffner,1 D. Weaire,1 A. Mughal,2 and S. Hutzler1
1School of Physics, Trinity College Dublin, The University of Dublin, Ireland 2Institute of Mathematics, Physics and Computer Science,
Aberystwyth University, Penglais, Aberystwyth, Ceredigion, Wales, SY23 (Dated: July 12, 2017)
We present the computed phase diagram of columnar structures of soft spheres under pressure, of which the main feature is the appearance and disappearance of line slips, the shearing of adjacent spirals, as pressure is increased. A comparable experimental observation is made on a column of bubbles under forced drainage, clearly exhibiting the expected line slip.
I. INTRODUCTION
Columnar structures are ubiquitous throughout biol-ogy: examples range from viruses, flagella, microtubules, microfillaments, as well as certain rod shaped bacteria [1–5]. However, they are also increasingly recognised in the physical sciences, particularly in nano-physics [6–8] in the form of nanotubes and nanowires. Other notable examples include the helical self-assembly of dusty plas-mas [9], asymmetric colloidal dumbbells [10] and particles trapped in channels [11]. More recently such columnar arrangements have also been found as components of ex-otic crystal structures [12,13].
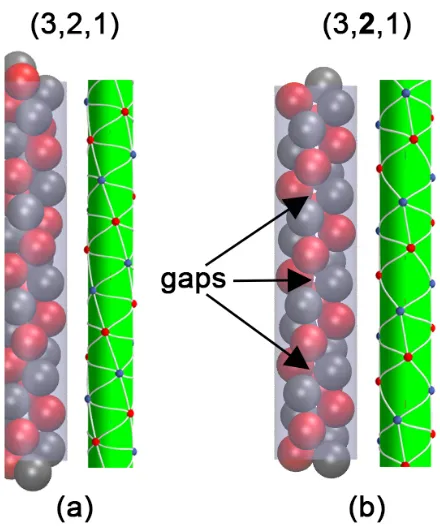
Such columnar structures arise in their most elemen-tary form when we seek the densest packing of hard spheres inside (or on the surface) of a circular cylinder [14–20]. A wide range of structures have been identified and tabulated [16], depending on the ratio of cylinder diameter D to sphere diameter d. For each of a set of discrete values ofD/d, a uniform structure is found, and may be labelled with the traditional phyllotactic indices (l, m, n) - see [14,16]. Between these values, the structure is best accommodated by the introduction of aline slip, which shears two adjacent spirals with a loss of contacts, as shown in Fig (1). These features were first identified by Pickett et. al. [21], but not termed “line slip”.
We have become accustomed to thinking of line slips as being a property of hard spheres, and therefore of limited relevance to real physical systems. That point of view is reconsidered here: we experimentally demon-strate the existence of line-slip arrangements in wet foams (as described below). These observations constitute the first conclusive experimental evidence of such structures (discounting the trivial case of packing ball-bearings in tubes [16]). Furthermore, our experiments with foams demonstrate that line-slip structures can be stable insoft
systems, a hitherto unexpected outcome. The results presented below improve on our previous attempts with small bubbles in capillaries under gravity, which proved difficult and in which line slips were not clearly seen [22]. Our work is stimulated in part by the observation of line slips (albeit rather indistinctly) in some simulations, which use points interacting by (the relatively complex) Lennard-Jones type potentials [12,23]. Here we
numeri-FIG. 1: Examples of a columnar hard sphere structures. For each pair of images the first shows the arrangement of hard spheres inside a tube, while the second shows a skeleton diagram in which sphere centres are represented by points and contacts between spheres are indicated by a line joining the sphere centres. The structures shown are (a) a uniform arrangement (3,2,1); and, (b) a related line-slip structure (3,2,1). The gaps in (b) correspond to a loss of contact compared to (a) - the loss of contacts can also be seen clearly in
the skeleton diagrams.
cally investigate the stability of structures formed by soft (elastic) repelling spheres in cylindrical channels subject to an applied pressure. It has often been noted that the attractive tail of a pair potential acts rather like an ap-plied pressure, so our simple model should have some generality in qualitative terms and could be compared fruitfully with these earlier simulations.
Our approach enables us to partially map out a rich phase diagram, consisting of a sequence of continuous and discontinuous transitions between uniform structures and
[image:1.612.327.547.216.479.2]see note in caption∗
2.00 2.05 2.10 2.15 2.20
diameter ratioD/d
0.000 0.005 0.010 0.015 0.020
pressure
p
(3,2,1) line slip (3,3,0) uniform
(3,2,1) uniform
(4,2,2) uniform
(4,3,1) uniform
(3,3,0) line slip
(3,2,1) line slip (2,2,0)
line slip
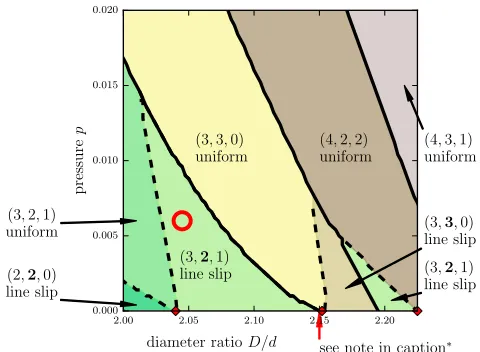
FIG. 2: The form of the phase diagram for the range 2.00 ≤ D/d≤2.22 and pressuresp≤0.02. Seven different structures are in the plotted range. With increasing pressure the widths of the line slips decrease and end in triple points. Discontinuous transi-tions are displayed as solid black lines and continuous transitransi-tions are represented as dashed lines. The diamond symbols atp= 0 cor-respond to the hard sphere symmetric structures (3,2,1), (3,3,0) and (4,2,2) [16]. A rough estimate of the experimentally observed line-slip structure is indicated by a circle on this phase diagram. ∗Note that there is also a very small (3,2,1) line slip region just
belowD/d= 2.15 [16], not resolved in the present simulation.
line-slip arrangements. We show that in such soft systems line slips gradually vanish with an increasing pressure, while at high pressures only uniform structures remain stable. While it may seem obvious that line slips must disappear at higher pressures, the true scenario is com-plex, as we shall see.
The paper is organised as follows. In section II we describe our numerical model and present the computed phase diagram. This is compared with our experimen-tal results in section III (for further experimenexperimen-tal details see the appendix). The discussion of these results is in section IV, followed by a brief concluding paragraph in section V.
II. NUMERICAL MODEL AND RESULTS
We begin by describing the model system. We adopt an elementary approach that has proved useful for the description of foams and emulsions [24]. It consists of spheres of diameter d, whose overlapδij leads to an in-crease in energy according to
EijS = 1 2δ
2
ij. (1)
[image:2.612.56.296.54.230.2]Here the overlap between two spheres i and j is de-fined as δij = |ri−rj| −d, where ri = (ri, θi, zi) and
TABLE I:Hard Sphere Packings
Range Notation Description D/d= 2.039 (3,2,1) uniform
2.039≤D/d≤2.1413 (3,2,1) line slip
2.1413≤D/d <2.1545 (3,2,1) line slip
D/d= 2.1547 (3,3,0) uniform
2.1547< D/d≤2.1949 (3,3,0) line slip
2.1949≤D/d≤2.2247 (3,2,1) line slip
D/d= 2.2247 (4,2,2) uniform
Partial sequence of densest uniform hard sphere packings, together with the line-slip structure, into which they may be transformed
(i.e.p= 0), adapted from Table I of [16].
rj = (rj, θj, zj) are the centers of two contacting spheres in cylindrical polar coordinates. A similar harmonic en-ergy term EB
i = ((D/2−ri)−d/2)2 accounts for the overlap between theith sphere and the cylindrical bound-ary. We conduct simulations using a simulation cell of lengthL and volume V =π(D/2)2L. On both ends of the simulation cell we imposetwisted periodic boundary conditions (see [16] for details).
Stable structures are found by minimizing the enthalpy H=E+pV for a system ofNsoft spheres in the unit cell, where E is the internal energy due to overlaps ES and EB as described before. A part of the resulting phase diagram is shown in Fig 2, where for a given value of the diameter ratio D/d and pressure p the enthalpy is minimized by varying the sphere centres, as well as the twist angle and the volume of the simulations cell. This is done for some values ofN and the structure with the lowest enthalpy is chosen.
For low pressures the minimization was performed with a very general search algorithm (similar to that used pre-viously for the densest packing of hard spheres [16]). We found that the results from these preliminary simulations could be used as an initial guess for a much simpler code (based on conjugate gradient techniques) to map out the higher pressure regions of the phase diagram. Starting with an initial structure (with N = 3,4,5) we steadily increased the pressure and minimized enthalpy. As a further check we also ran the procedure in the orthogo-nal direction - i.e. we start with a seed structure with a high value of D/d, keep the pressure constant while re-ducingD/din discrete steps and minimize the enthalpy at each step. In either case the structure with the lowest enthalpy for a given value ofD/d and pis given in the phase diagram.
2.00 2.05 2.10 2.15 0.0095 0.0096 0.0097 0.0098 0.0099 0.0100 0.0101 0.0102 En thalp y H
(3
,
2
,
1)
uniform
(3
,
2,
1)
line slip
(3
,
3
,
0)
uniform
(4
uniform
,
2
,
2)
2.00 2.05 2.10 2.15
diameter ratioD/d
[image:3.612.58.301.55.279.2]0.00 0.02 0.04 0.06 0.08 0.10 Comp ∆ V /V 0
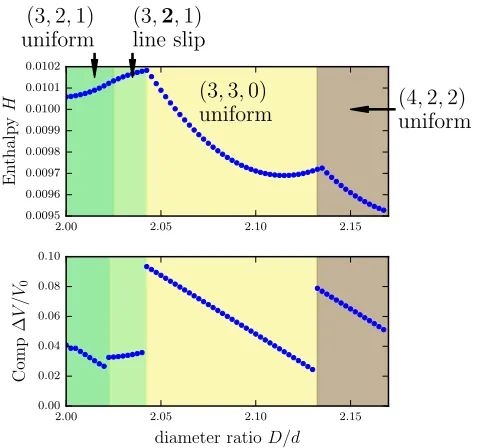
FIG. 3: Top: An example of the enthalpyH= (E+pV) asD/dis varied at a constant pressurep= 0.01. The plot shows a horizontal cut through the phase diagram of Fig 2. Bottom: Compression ratioCof the soft packings as a function of the applied pressure. Only the transition from (3,2,1) to (3,2,1) is continuous and does not involve a change in the slope ofHat the phase boundary.
eliminates the line slips which end up in a triple point and are forced into uniform structures. This transformation equates to a 10 %−15 % compression of the hard sphere packings, in the range shown.
We now discuss the features of the phase diagram in de-tail. Continuous transitions, where the structure changes gradually due to the loss or gain of a contact, are shown in the Fig 2 as dashed lines. Discontinuous transitions, where the structure changes abruptly into another, are indicated with a solid line. Transitions between uniform structures and a corresponding line slip are continuous. This is echoed by the sequence of hard sphere packings (i.e. the structures along the horizontal axis) as listed in Table I. An explanation for the connections between a symmetric structures and a line slip for the hard sphere packing can be found in Fig 10 and 12 of [16].
A typical example of a discontinuous transition is given by the solid line separating the (3,3,0) and (3,2,1) line-slip regions. We find in the case of soft spheres that with increasing pressure the (3,2,1) line slip is first to disappear at a triple point followed by the (3,3,0) line slip at a slightly higher pressure. At still higher pressures only the (3,3,0) and (4,2,2) uniform structures remain stable, separated by a discontinuous phase transition.
On first glance on our phase diagram, the case (3,2,1)→(3,3,0) seems to be exceptional, in that only a single line slip, the (3,2,1) line slip, is visible. From Ta-bleIwe would also have expected to see two line slips sep-arating the uniform structures (as in the previous case).
0.000 0.005 0.010 0.015 0.020 0.000 0.005 0.010 0.015 0.020 En thalp y H
(3
,
2,
1)
line slip
(3
,
3
,
0)
uniform
(4
,
2
,
2)
uniform
0.000 0.005 0.010 0.015 0.020
[image:3.612.321.560.55.277.2]pressurep 0.00 0.02 0.04 0.06 0.08 0.10 0.12 Comp ∆ V /V 0
FIG. 4: An example of the enthalpyH= (E+pV) asP is varied at a constantD/d= 2.1. The plot shows a vertical cut through the phase diagram of Fig2. Bottom: Compression ratioCof the soft packings as a function of the applied pressure. All the transitions shown are discontinuous, however the change in the slope at the phase boundaries can only be detected by numerically computing
the derivative.
However, the line-slip structure of the (3,2,1) exists only in the narrow range 2.1413≤D/d≤2.1545 for the hard spheres (see TableI) and is not resolved in Fig2.
The distinction between continuous and discontinuous transitions can be illustrated directly via the enthalpyH. An example ofH in terms of D/d at constant pressure p= 0.01 is given in Fig3. Continuous transitions, such as (3,2,1) uniform (indicated in purple) to (3,2,1) line slip (indicated in blue), are not apparent in the variation of H. However, discontinuous transitions such as the (3,2,1) line slip to (3,3,0) uniform (green) show a change in slope ofH at the transition.
Also shown for comparison in Fig3is the compression of the packing subject to the applied pressure. We define the compression asC= (V0−V(p, D))/V0, whereV(p, D) is the volume of the unit cell of the soft sphere packing (for the chosen pressure and diameter ratio) andV0is the volume of the corresponding hard sphere structure. In the case of uniform structures the volume of the unit cell in the hard sphere case has a unique value [17]. However, for the line-slip structures this is not the case (since the length of the unit cell depends onD/d) and instead we compare against the smallest volume of the unit cell for a given hard sphere arrangement of this type [17].
pres-sure. The corresponding compression ratio is also shown. The trajectory passes through a transition from (3,2,1) to (3,3,0) and then from (3,3,0) to (4,2,2) - both of these are discontinuous transitions; while the change in the slope cannot be determined by inspection from Fig
4 it nevertheless can be clearly observed by taking the derivative ofH with respect to palong the trajectory.
III. EXPERIMENTS
We now describe our experimental procedure and re-sults (for further details of the set-up - see the appendix). For a convenient experimental counterpart, we choose to observe structures of columns of bubbles under forced drainage that is, a steady input of liquid from above [25– 27]. In the past this has been extensively studied for columns of bulk foam whereD/dwas very large. It was found to undergo convective instability for flow rates that gave rise to higher liquid fractions, confining experiment to relatively dry foam [28]. The corresponding theory was therefore developed using approximations appropri-ate in the dry limit, that is, in terms of flow in a network of narrow Plateau borders.
The present work leads us to consider columns of wet foams, that is, with the drainage rate high enough to produce near-spherical bubbles. We find no such insta-bility in the case of the confined columnar structures of large bubbles considered here; hence the wet limit can be reached at a certain flow rate. Below that point, the liq-uid fraction can be varied, producing ordered columnar structures closely analogous to those described above.
For the experimental set-up [25, 29], monodisperse bubbles are produced by using a bubbling needle in a commercial surfactant Fairy Liquid. The surfactant so-lution contains 50% of glycerol in mass to increase the viscosity, smooth the transition between structures and to allow us observe more easily unstable bubble arrange-ments. Tuning the flow rate (q0∼1ml/min) allows us to produce monodisperse bubbles (d∼2.5mm). The diam-eter of the bubbles is measured afterwards by squeezing a small amount of a monolayer foam between two plates separated by a controlled gap. The size of each bubble is determined from a photograph of the top plate (see appendix).
The bubbles are observed to self-organise into ordered structures in the vertical glass tube for which the di-ameter is 5mm and the length is 1.5m. The resulting foam column is put under forced drainage by feeding it with surfactant solution from the top (flow rateQup to ∼10ml/min). We estimate the capillary pressure for the bubbles to be of the order of approximately 10P a, which is an order of magnitude smaller than the hydrostatic pressure - thus the bubbles are in the regime whereby they can easily be deformed and the foam can be treated as a packing of relatively soft objects - see appendix.
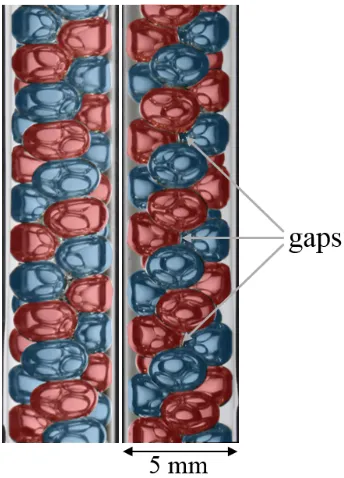
We show in Fig 5 an example of the observation of the (3,2,1) line-slip structure in accord with
expecta-FIG. 5: Observation of columnar structures of bubbles under forced drainage, showing about forty bubbles. Left: (3,2,1) uni-form structure occurring at a relatively low flow rate. Right: Bub-bles adopt the (3,2,1) line-slip structure at a relatively high flow rate. It is similar to the line-slip structure of Fig (1b). The color-ing highlights the two interlocked spirals of the (3,2,1) and (3,2,1) structures. The circle marked on Fig2corresponds roughly to its
estimated position on the phase diagram.
tions based on the soft sphere model, described above. Note that the bubbles are distorted into smooth ellip-soids by the flow. The extent of the loss of contact in the observed line-slip structure is roughly equal to that of the simulated structure at the position marked with a circle in the phase diagram. This is also consistent with our estimates of equivalent pressurep and equiva-lentD/d. Where, the equivalent pressure is determined from the local hydrostatic pressure, the capillary pres-sure and the bubble diameter. Similarly, the equivalent diameter is also estimated but is not yet clear on account of the oblate shape of the bubbles.
The shape distortion due to flow, together with that due to the forces between bubbles, and hence the equi-librium structure itself, will be analysed in a subsequent paper, together with a wide range of observations. Those forces are only very crudely modelled in the present pa-per. The necessary theory of drainage of stable structures of wet foam has not previously been formulated.
IV. DISCUSSION
[image:4.612.353.525.50.289.2]struc-tures described above would only be of importance close to the incompressible athermal limit. Recently, however, these original findings have been found to be relevant in theself-assembly of hard spheres in cylindrical channels [30]. Remarkably, it is found that at finite temperature and pressure both uniform and line-slip arrangements can be observed: a steadily increasing pressure can induce transitions between structures, while at a high compres-sion rate some arrangements are found to be dynamically inaccessible [30], these results are illustrated in terms of a phase diagram that bears a resemblance to the results presented here. This is due to the fact that the thermally agitated hard spheres have an effective radius that scales with the mean free path, this leads to an effective inter-action reminiscent of a soft potential. These results only indirectly hint at the manner in which the hard sphere results are modified in the presence of soft interactions. The present results have the advantage of directly ad-dressing the stability of line-slip arrangements in softly interacting systems.
These results may also be fruitfully compared with previous studies employing the Lennard-Jones potential, where both uniform structures and line-slip arrangements are observed [23]. On the other hand, in the case of very soft potentials, such as the Yukawa interaction, line-slips have not been either predicted to exist [31] or indeed ob-served in experiments [32]. Determining the robustness of the phase diagram presented in Fig2as a function of the hardness/softness of the interaction potential remains an open question
Another related study is that of Rivier and Boltenhagen [33] who observed structural transitions in cylindricaldry foam under pressure, well outside of the range of our investigation.
V. CONCLUSIONS
In conclusion, questioning the relevance of hard-sphere properties to physical systems, consisting ofsoft spheres has led us into a new territory, not previously explored. We have shown that line-slip arrangements are a feature of soft systems (even in the absence of thermal agitation), thus extending their usefulness to encompass a range of commonly encountered substances including dusty plas-mas, foams, emulsions and colloids. It is of direct rele-vance to some physical systems (foams, emulsions) and offers qualitative interpretation in others. It extends into another dimension (that of pressure) the elaborate table of hard-sphere structures previously found.
These results are strictly only relevant to a micro-scopic system which is in thermal equilibrium. For some systems, such as those currently under investiga-tion [9–11,30–32,34–36], many observed structures will be metastable (i.e. not structures of lowest enthalphy). We therefore are engaging in complementing the work of this paper by exploring the wider context of metastable structures and transitions between them. This will
es-tablish a full comparison with various experiments (also on the way). We will furthermore in due course also use the methods developed here to investigate the phase dia-gram for higherD/dup toD/d≤2.7379, beyond which the nature of the hard sphere packings changes [16, 20], and to higher pressure.
Finally, it is worth noting that there is considerable current interest in columnar crystals, of the type de-scribed here. Applications include various helical bio-logical microstructures, such as viruses [1] and bacteria [5]. In addition, there are a range of problems involv-ing the self assembly (or packinvolv-ing) of spheres and parti-cles in tubes [30–32, 34–36]. The context of this work is further expanded by the recently demonstrated anal-ogy between line-slip structures and dislocations in the crystalline phase on a cylinder [37].
ACKNOWLEDGMENTS
A. M. acknowledges support from the Aberystwyth University Research Fund. This research was supported in part by a research grant from Science Foundation Ire-land (SFI) under grant number 13/IA/1926 and from an Irish Research Council Postgraduate Scholarship (project ID GOIPG/2015/1998). We also acknowledge the sup-port of the MPNS COST Actions MP1106 ‘Smart and green interfaces’ and MP1305 ‘Flowing matter’ and the European Space Agency ESA MAP Metalfoam (AO-99-075) and Soft Matter Dynamics (contract: 4000115113).
APPENDIX
Here we briefly discuss the experimental set-up used to produce the columnar arrangement of bubbles. We be-gin by describing a method for generating monodisperse foams in a column. We then discuss how the liquid frac-tion of the foam can be controlled and its effect on the morphology of the foam.
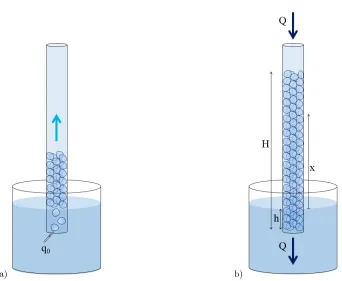
As shown in Fig (6a), a steady stream of monodisperse bubbles is produced by a bubbling needle dipped in a sur-factant solution. Tuning the flow rate (q0 ∼1ml/min) allows us to produce monodisperse bubbles. The bub-bles are approximately of diameter d ∼ 2.5mm with a standard deviation ofσ= 0.03mm. The diameter of the bubbles is measured by squeezing a small amount of a monolayer foam between two plates separated by a con-trolled gap. The size of each bubble is determined from a photograph of the top plate.
The bubbles are collected in a cylindrical tube and form a columnar foam. For a bubble in our experiments the capillary pressure is
Pcap=γ/r,
whereγ= 0.03N m−1 is the surface tension andr=d/2 is the radius of the bubble. The hydrostatic pressure,
for a given bubble depends on the heightxof the bubble in the column, as measured from the liquid/air interface (see Fig (6b), as well as the density of the surfactant ρ and gravity g. A simple calculation suggests that the hydrostatic pressure balances the capillary pressure for x≈1mm, while the column used for experiments is ap-proximately 1.5m. Thus, we can safely assume that the hydrostatic pressure dominates in the experiments and the foam can be regarded assoft packing of bubbles.
The resulting foam column is put under forced drainage by feeding it with surfactant solution from the top with a flow rateQup toQ∼10ml/min. As shown in Fig (6b), the relevant experimental parameters are the height of the foam H, the height of the dipped foam h andxthe position in the foam (which is taken from the liquid/air interface). By Archimedes’ principle the liquid fraction of the foam is given by φ=h/H, i.e. the frac-tion of the dipped foam compared with the entire body of the foam.
Besidesφ, the local liquid fractionsφloc is determined from the photographs of the structure (see Figure7). The diameter of the tube D, the diameter of the bubbles d and the thickness of the tube sliceT (where by thickness we meanT = ∆x, i.e. the length of a considered section of the tube). Hence, we have
φloc= N πd3
6
×
4
πD2T
, (2)
whereN is the number of bubbles observed in considered section of the tube.
We find that the type of structure observed in the col-umn depends strongly on both the liquid fraction and the position xin the column. A partial list of observed structures as a function of liquid fraction and height x are tabulated below. Varying the liquid fraction can pro-duce foams that are either dry or wet, such variations in the liquid fraction may also lead to transitions between structures, see Fig (7a). On the other hand, the local hydrostatic pressure acting on the foam depends on the height, i.e. the position x in the column. Consequen-tially, we find that foams with identical liquid fractions can have different structures depending on the value ofx as shown in Fig (7b).
a) b)
FIG. 6: Set-up for producing the columnar structures. a) Bubbling at a constant flow rateq0into a cylindrical column b) Forced drainage of the foam at a constant flow rateQ, hereH is the height of the entire foam column,his the height of the submerged foam andxis an
arbitrary point in the foam as measured by height from the liquid/air interface.
a) b)
FIG. 7: The structure highly depends on bothφand thex. a) These photographs show two foams at the same height (x= 15cm) but for different liquid fractions: φ∼0.03 [left, (3,2,1)] andφ∼0.50 [right, (2,2,0)]. b) These photographs show two foams at the same liquid fractionφ∼0.48 but for different heights: x= 15cm[left, (2,2,0)] andx= 30cm[right, (3,2,1)]. Bubble sized∼2.5mm. For more
[image:7.612.141.474.498.625.2][1] R.O. Erickson, Science181, 705 (1973).
[2] R. Hull, Advances in virus research20, 1 (1976). [3] W.B. Brinkley, Journal of structural biology 118, 84
(1997).
[4] J. Bryan, Bioscience24, 701 (1974).
[5] A. Amir and D.R. Nelson, Proceedings of the National Academy of Sciences109, 9833 (2012).
[6] R.E. Smalley, M.S. Dresselhaus, G. Dresselhaus, and P. Avouris,Carbon nanotubes: synthesis, structure, prop-erties, and applications, volume 80 (Springer Science & Business Media, 2003).
[7] N.G. Chopra, R. Luyken, K. Cherrey, V.H. Crespi,et al., Science269, 966 (1995).
[8] A. Brisson and P. Unwin, The Journal of cell biology99, 1202 (1984).
[9] V. Tsytovich, G. Morfill, V. Fortov, N. Gusein-Zade, B. Klumov, and S. Vladimirov, New Journal of Physics
9, 263 (2007).
[10] D. Zerrouki, J. Baudry, D. Pine, P. Chaikin, and J. Bi-bette, Nature 455, 380 (2008).
[11] Y. Yin and Y. Xia, Journal of the American Chemical Society 125, 2048 (2003).
[12] I. Douglass, H. Mayger, T. Hudson, and P. Harrowell, Soft Matter (2017).
[13] K. Wang, S.M. Jin, J. Xu, R. Liang, K. Shezad, Z. Xue, X. Xie, E. Lee, and J. Zhu, ACS nano10, 4954 (2016). [14] A. Mughal, H.K. Chan, and D. Weaire, Physical review
letters106, 115704 (2011).
[15] H.K. Chan, Physical Review E84, 050302 (2011). [16] A. Mughal, H. Chan, D. Weaire, and S. Hutzler, Physical
Review E85, 051305 (2012).
[17] A. Mughal, Philosophical Magazine93, 4070 (2013). [18] A. Mughal and D. Weaire, Physical Review E89, 042307
(2014).
[19] M.Z. Yamchi and R.K. Bowles, Physical review letters
115, 025702 (2015).
[20] L. Fu, W. Steinhardt, H. Zhao, J.E. Socolar, and P. Char-bonneau, Soft matter12, 2505 (2016).
[21] G.T. Pickett, M. Gross, and H. Okuyama, Phys. Rev. Lett.85, 3652 (2000).
[22] A. Meagher, F. Garc´ıa-Moreno, J. Banhart, A. Mughal, and S. Hutzler, Colloids and Surfaces A: Physicochemical and Engineering Aspects473, 55 (2015).
[23] D. Wood, C. Santangelo, and A. Dinsmore, Soft Matter
9, 10016 (2013).
[24] D. Durian, Physical review letters75, 4780 (1995). [25] D. Weaire, N. Pittet, S. Hutzler, and D. Pardal, Physical
review letters71, 2670 (1993).
[26] D. Weaire, S. Hutzler, G. Verbist, and E. Peters, Ad-vances in Chemical Physics, Volume 102 315–374 (1997). [27] S.A. Koehler, S. Hilgenfeldt, and H.A. Stone, Langmuir
16, 6327 (2000).
[28] S. Hutzler, D. Weaire, and R. Crawford, EPL (Euro-physics Letters)41, 461 (1998).
[29] S. Hutzler, D. Weaire, and R. Crawford, Philosophical Magazine B75, 845 (1997).
[30] L. Fu, C. Bian, C.W. Shields IV, D.F. Cruz, G.P. L´opez, and P. Charbonneau, Soft Matter13, 3296 (2017). [31] E. C. Oguz, R. Messina and H. Lowen, EPL (Europhysics
Letters)94, 28005 (2011).
[32] G. Wu, H. Cho, D.A. Wood, A.D. Dinsmore, S. Yang, J. Am. Chem. Soc. (2017).
[33] N. Pittet, P. Boltenhagen, N. Rivier, and D. Weaire, EPL (Europhysics Letters)35, 547 (1996).
[34] W. Mickelson et al., Science,300, 467 (2003).
[35] F. Li, X. Badel, J. Linnros and J.B. Wiley, J. Am. Chem. Soc.,127, 3268 (2005).
[36] M.A. Lohr et al, Phys. Rev. E,81, 040401 (2010). [37] D.A. Beller, D.R. Nelson, Phys. Rev. E, 94, 033004