Journal of Chromatography A, 870 (2000) 53–68
www.elsevier.com / locate / chroma
Profiling of impurities in illicit methamphetamine by
high-performance liquid chromatography and
capillary electrochromatography
a ,
*
b b aIra S. Lurie
, Christopher G. Bailey , Deon S. Anex , M. Jason Bethea ,
a a
Timothy D. McKibben , John F. Casale
aUS Drug Enforcement Administration, Special Testing and Research Laboratory, 7704 Old Springhouse Road,
McLean, VA 22102, USA
b
Chemical and Radiation Detection Laboratory, Sandia National Laboratories, P.O. Box 969, Mail Stop 9671,
Livermore, CA 94551, USA
Abstract
High performance liquid chromatography (HPLC) with photodiode array (PDA) UV and fluorescence (FL) detection, and capillary electrochromatography (CEC) with laser-induced fluorescence (LIF) detection were investigated for the analysis of acidic extracts derived from illicit methamphetamine. These compounds include major impurities from the hydriodic acid / red phosphorous reduction method, i.e., 1,3-dimethyl-2-phenylnaphthalene and 1-benzyl-3-methylnaphthalene, and other trace-level, structurally related impurities. For certain of these solutes, HPLC with conventional FL detection gave at least a 603 increase in sensitivity over UV detection. In addition, other highly fluorescent impurities were detected in methamphetamine produced via four other synthetic routes. The use of a rapid scanning FL detector (with acquisition of ‘‘on the fly’’ excitation or emission) provided structural information and gave ‘‘optimum’’ excitation and emission detection wavelengths. CEC with LIF detection using UV laser excitation provided greatly improved chromatography over HPLC, with good detection limits in the low ng / ml range. Both methodologies provide good run-to-run repeatability, and have the capability to distinguish between samples. 2000 Published by Elsevier Science B.V.
Keywords: Forensic analysis; Methamphetamine
1. Introduction the determination of synthetic origin. Tactical in-telligence involves the determination of whether two Impurity profiling of illicit drugs such as metham- or more exhibits (whether of common geographical phetamine is important for deriving strategic or or synthetic origin) came from an identical source, tactical intelligence [1]. For ‘‘natural’’ drugs (e.g., i.e., same batch from the same laboratory. Virtually cocaine or morphine), strategic intelligence involves all illicitly produced drugs contain both organic and the determination of geographical origin, whereas for inorganic impurities. The analysis of the organic synthetic drugs [e.g., methamphetamine or impurities, which are complex mixtures of solutes phencylidine (PCP)], strategic intelligence involves often present at trace levels, require techniques which offer a high degree of resolution, specificity and sensitivity.
*Corresponding author. Tel.: 11-703-2852-583; fax: 1
1-703-2852-198. Methamphetamine is usually synthesized using
54 I.S. Lurie et al. / J. Chromatogr. A 870 (2000) 53 –68 either an achiral precursor [e.g., phenyl-2-propanone 2. Experimental (P2P)] [2] or via a direct stereospecific reduction of
one of its corresponding enantiomeric a-hydroxy- 2.1. Reagents and analytes phenethylamine precursors [3,4] (i.e., ephedrine or
pseudoephedrine). In the USA, the currently most Tris(hydroxymethyl)aminomethane (Tris) and so-prevalent synthetic method is the hydriodic acid / red dium dodecyl sulfate (SDS) were obtained from phosphorus (HI / Red P) reduction of ephedrine or Sigma (St. Louis, MO, USA), and Life Technologies pseudoephedrine [5]; however, there are four other (Gaithersburg, MD, USA), respectively. HPLC-grade synthetic routes also in common use, and numerous acetonitrile was purchased from Burdick and Jackson variants of all routes are observed. These latter (Muskegon, MI, USA) and Aldrich (Milwaukee, WI, routes include the so-called ‘‘dry reduction’’ [6] USA). Deionized water was obtained using a Milli-(HI / Red P with very little water), hypophosphorus pore Milli-Q purification system (Bedford, MA, acid reduction [7], and sodium / ammonia reduction USA).
[8] (all of ephedrine or pseudoephedrine), and reduc- Standards of 1,3-dimethyl-2-phenylnaphthalene tion of phenyl-2-propanone by the mercury– (NI 1) and 1-benzyl-3-methylnaphthalene (NI 2) aluminum amalgam reduction. were synthesized as previously reported [19] and Impurity profiling of methamphetamine has been their identities confirmed by a comparison of their previously accomplished using capillary gas chroma- proton nuclear magnetic resonance and / or mass tography (GC) with either flame ionization detection spectra with published data [3,19]. A sample con-(FID) [9–12], combined FID with nitrogen–phos- taining 38% (w / w) NI 1 and 52% (w / w) NI 2 plus phorus detection (NPD) [13] or mass spectrometry related trace impurities (hereafter ‘‘NI’’) was syn-(MS) [9,14] on either basic or weakly acidic ex- thesized from P2P and isolated from a crude mixture tracts. Although high-resolution separations are ob- by alumina column; this was used for optimization tained using capillary GC, the analysis of solutes that studies.
are thermolabile, nonvolatile and highly polar by GC Authentic HI / Red P-produced samples of is problematic. In addition, while relatively sensitive, methamphetamine were seized from clandestine lab-FID and NPD lack specificity. oratories. Samples representing dry reduction, Na / High-performance liquid chromatography (HPLC) ammonia reduction, hypophosphorus acid reduction is also viable for the analysis of methamphetamine and P2P reduction methods for producing metham-impurities, including solutes that can be difficult to phetamine hydrochloride were synthesized in this analyze using GC. However, only moderate res- laboratory via procedures typically utilized in illicit olution separations are obtainable using HPLC. This laboratories.
limitation can be partially compensated for by using The HPLC mobile phases were internally mixed a highly sensitive and selective fluorescence (FL) from solvent reservoirs containing acetonitrile and detection mode. Capillary electrochromatography water. The CEC mobile phase was prepared by (CEC), another liquid phase technique, combines combining 30 parts of 5.0 mM Tris–5 mM SDS, pH capillary electrophoresis (CE) separation efficiency 8.0, with 70 parts acetonitrile.
with HPLC selectivity. The utility of CEC has been
recently demonstrated for cannabinoid profiling [15] 2.2. Analytical solutions and forensic drug screening [16]. When coupled with
a highly sensitive laser-induced fluorescence (LIF) For HPLC and CEC analyses, appropriate aliquots detection method, this high-resolution technique is of a methylene chloride stock solution of NI which well suited for methamphetamine profiling. LIF has contained 0.39 mg / ml NI 1 and 0.54 mg / ml NI 2 been previously used with CE for the profiling of were evaporated to dryness and reconstituted in the illicit heroin [17] and cocaine [18]. mobile phase. This same solution was used for limit
In this paper, HPLC using photodiode array (PDA) of detection and additional experiments.
UV and / or FL detection, and CEC with LIF de- For isocratic HPLC and CEC, acidic extracts tection are presented for impurity profiling of derived from approximately 20 mg equivalents of
I.S. Lurie et al. / J. Chromatogr. A 870 (2000) 53 –68 55 and 100 ml of mobile phase, respectively, while for a photomultiplier tube (PMT). The signal was pro-gradient HPLC analyses, acidic extracts obtained cessed using a lock-in amplifier in conjunction with from approximately 50 mg equivalents of metham- the mechanical chopper, and data were stored and phetamine were used. The acidic extracts were processed using EZChrome Elite chromatography prepared by dissolving an appropriate quantity of software (San Ramon, CA, USA).
sample in 5.0 ml of sulfuric acid and extracting it CEC columns were prepared in the laboratory as three times with 3 ml of methylene chloride. The previously described [20]. For this study, the col-combined extracts were then dried over sodium umns were packed with 1.5 mm nonporous ODS II sulfate and reconstituted with an appropriate amount particles obtained from Micra Scientific (North-of methylene chloride, aliquots (North-of this reconstituted brook, IL, USA). The columns were 32 cm (of which solution were used for all HPLC and CEC analyses. 23.5 cm was packed)375 mm I.D.3365 mm O.D. Detection windows (|2 mm long) were burned into
2.3. Instrumentation the column walls, approximately 2 mm downstream
of the outlet frit, using a Teledyne Kinetics re-A Hewlett-Packard Model 1100 HPLC system sistively heated wire stripper (Solana Beach, CA, (Waldbronn, Germany) equipped with a quaternary USA).
pumping system, a 1100 series PDA–UV detector, a Columns were conditioned with degassed mobile Model 1046A FL detector, and a 1100 series rapid phase using a Unimicro Technologies manual sy-scanning FL detector, was used for all HPLC analy- ringe pump (Pleasanton, CA, USA). After condition-ses. The Model 1046A FL detector only allows for ing, a stable electroosmotic flow was established by single excitation and emission wavelengths at given slowly increasing the voltage across the column up times, and also only allows acquisition of spectral to the running potential. The current was then information in the stop flow mode. In contrast, the monitored by measuring the voltage drop across a 10 1100 rapid scanning FL detector allows for either kV resistor in series with the column.
multiple excitation or emission wavelengths at any given time, and acquisition of spectral information in the continuous flow mode. A 11.0 cm34.7 mm I.D.
HPLC cartridge system (5 mm Partisil ODS 3) 3. Results and discussion operated at ambient temperature was used
(What-man, Clifton, NJ, USA).
The CEC–LIF experiments were performed using 3.1. Impurity profiling by HPLC a laboratory-built system. High voltage was provided
56 I.S. Lurie et al. / J. Chromatogr. A 870 (2000) 53 –68
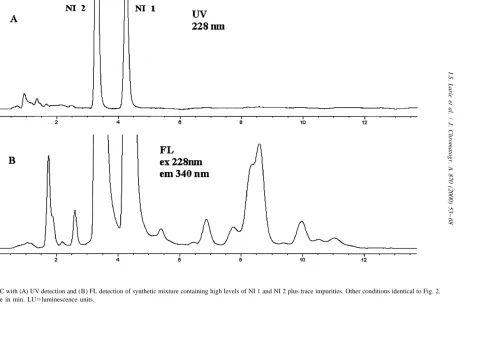
which produces NI 1 and NI 2 in illicit samples (i.e., acid-catalyzed condensation of P2P), they would also be present in seized exhibits. As shown in Fig. 3, there is a significant enhancement of the FL signal over the UV signal, especially for those solutes eluting after NI 1. For several solutes, there is at least a 603 increase in S /N for FL over UV detection. The increased gain of FL over UV for the minor impurities versus NI 1 and NI 2 is probably due to the lack of carry-over peaks in the measured chromatographic region.
Spectral information obtained for the solutes sepa-rated in Fig. 3 strongly indicate that the highly fluorescent, trace-level impurities compounds are (as postulated) structurally similar to NI 1 and NI 2. As shown in Fig. 3A, little or no PDA–UV data is available for most of these solutes; however, contour plots obtained by the rapid scanning detector show Fig. 1. Structures of the two major napthalene-based impurities
that their excitation and emission spectra are similar derived from HI / Red P reduction method.
NI 1 and NI 2 (see Figs. 4 and 5).
3.1.1. FL versus UV detection 3.1.2. Sample analysis
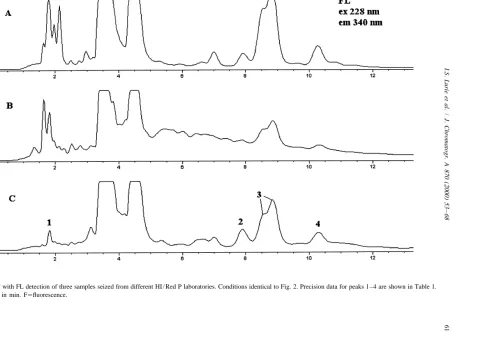
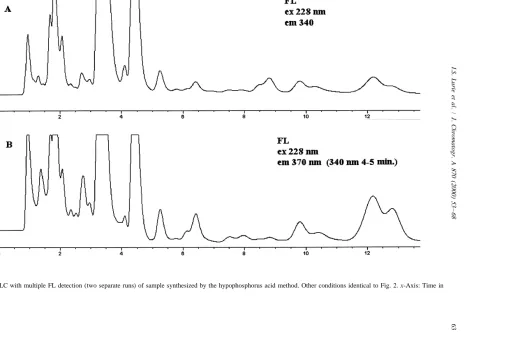
In preliminary studies, stop flow analysis of the The HPLC analyses of samples seized from three eluting peaks using FL detection (Model 1046A different illicit HI / Red P laboratories (see Fig. 6) detector) gave excitation maxima of 229 nm and 228 gave similar but distinct fluorescent profiles. Al-nm and emission maxima of 343 Al-nm and 340 Al-nm, though for the most part the same peaks are present respectively, for NI 1 and NI 2. As shown in Fig. 2, (especially in the region after NI 1), there are similar spectral information was obtained using the differences in the absolute and relative intensities of rapid scanning FL detector. the peaks. Excitation and emission contour plots for For NI 1, the limit of detection via UV was 3.9 these three samples show that most peaks (especially ng / ml (S /N53, UV 228 nm), while for fluorescence in the region after NI 1) have excitation and emis-a limit of detection of 165 pg / ml [S /N53, excitation sion spectra similar to NI 1 and NI 2. Again, due to 229 nm and emission 340 nm (rapid scanning FL the similarities in the fluorescence profiles of the detector)] was obtained. For NI 2, the limit of synthetic mixture and the three samples (cf. Figs. 3 detection via UV was 2.8 ng / ml (S /N53, UV 228 and 6), it is probable that most of the highly nm), while for fluorescence a limit of detection of fluorescent trace impurities in methamphetamine are 460 pg / ml [S /N53, excitation 229 nm and emission also naphthalene-containing compounds, and there-340 nm (rapid scanning FL detector)] was obtained. fore originate from P2P.
For fluorescence, the data represents an apparent Repeatability (RSD, n58) of retention time (t ),R limit of detection; there were small carryover peaks relative retention time (RRT), peak area (Area) and present for NI 1 and NI 2 which represent the relative peak area (RArea) were examined for several apparent noise level. The rapid scanning FL detector peaks from the sample shown in Fig. 6C. As shown gave approximately a 23 lower limit of detection in Table 1, good precision was obtained for peaks than the conventional FL detector. 1–4 for t , RRT, Area and RArea, with RSDs ofR The trace impurities in NI were also analyzed via #0.46, #0.39, #1.83 and #2.69%, respectively. HPLC with UV and FL detection. As previously Improved precision was obtained for RRT versus tR noted, it was believed that since trace impurities using peak 4 as a reference compound.
I.S. Lurie et al. / J. Chromatogr. A 870 (2000) 53 –68 57
Fig. 2. (A) Excitation spectra and (B) emission spectra of NI 1 and NI 2. Conditions: acetonitrile–water (70:30) at a flow-rate of 1.5 ml / min. A Whatman 5mm ODS 3 (11.0 cm34.7 mm I.D.) column was used at ambient temperature with 25ml injections.
[image:5.612.62.487.79.530.2]58
I.S
.
Lurie
et
al
.
/
J.
Chromatogr
.
A
870
(2000
)
5
3
–
[image:6.612.109.656.77.427.2]68
Fig. 3. HPLC with (A) UV detection and (B) FL detection of synthetic mixture containing high levels of NI 1 and NI 2 plus trace impurities. Other conditions identical to Fig. 2.
I.S. Lurie et al. / J. Chromatogr. A 870 (2000) 53 –68 59
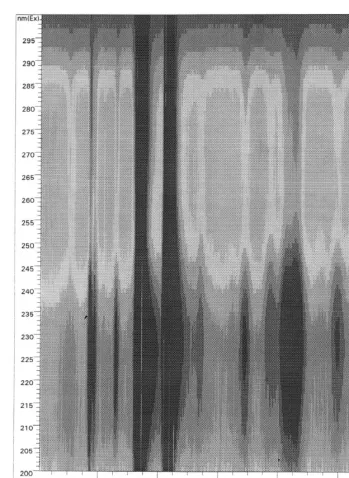
Fig. 4. Contour plot (isoplot) of excitation spectra of peaks contained in Fig. 3.
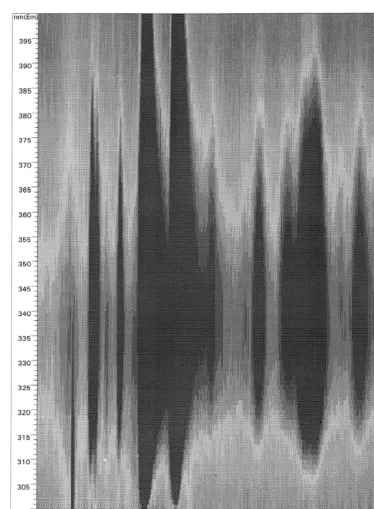
both have a preponderance of compounds with same compounds (i.e., at similar migration times and excitation maxima between 235 and 290 nm and FL spectra) present in the three samples synthesized emission maxima between 358 and 390 nm. For the by the HI / Red P method.
60 I.S. Lurie et al. / J. Chromatogr. A 870 (2000) 53 –68
I.S
.
Lurie
et
al
.
/
J.
Chromatogr
.
A
870
(2000
)
5
3
–
68
[image:9.612.113.660.81.426.2]61
Fig. 6. HPLC with FL detection of three samples seized from different HI / Red P laboratories. Conditions identical to Fig. 2. Precision data for peaks 1–4 are shown in Table 1.
62 I.S. Lurie et al. / J. Chromatogr. A 870 (2000) 53 –68
Table 1 possible approaches. For samples derived from the
HPLC repeatability (RSD, n58) of retention time (t ), relativeR HI / Red P process, lowering the solvent strength (by
retention time (RRT), peak area (Area) and relative peak area
decreasing from 70 to 60% acetonitrile) improved (RArea) for selected peaks (see Experimental for conditions)
resolution of early and mid-eluting compounds, but Peak RSD (%)
had a negligible effect on the resolution of the
tR RRT Area RArea later-eluting solutes. For these same samples, gra-dient elution improved resolution, but again only for
1 0.46 0.39 1.83 1.48
2 0.24 0.06 1.36 2.69 the early eluting solutes (see Fig. 10B). However,
3 0.26 0.06 1.07 1.80 both of these approaches resulted in significant
4 0.27 1.32
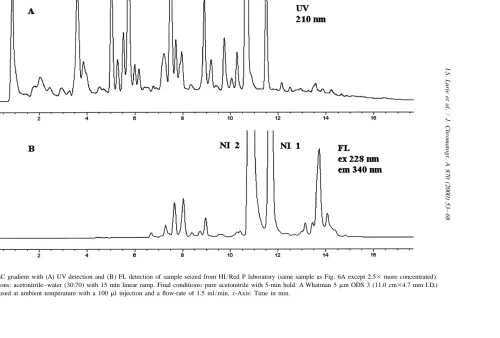
increases in run times (2.5–3.43). In addition, a more concentrated extract and larger injection size was used for gradient analysis than for isocratic analysis. This allowed a peak enriched chromato-acid sample, better overall signal-to-noise for the
various peaks is obtained, with excitation at 228 nm gram using PDA–UV detection at 210 nm (e.g., see and emission at 370 nm, versus excitation at 228 nm Fig. 10A). The UV contour plot revealed that the and emission at 340 nm (cf. Fig. 7A and B). In the complex mixture had a wide diversity of spectral case of the sample synthesized by the dry reduction properties. A discussion of the UV spectra of these method, changing both the excitation and / or emis- methamphetamine impurities is beyond the scope of sion wavelength(s) gives better signal-to-noise for this manuscript; however, Fig. 10A reveals the certain peaks (cf. Fig. 8A–C). Again, the use of potential of PDA–UV detection for impurity profil-excitation and emission contour plots help to obtain ing. Concentrated extracts of all three exhibits de-‘‘optimized’’ conditions. The rapid scanning FL rived from the HI / Red P process had distinctly detector was able to simultaneously acquire the different gradient elution chromatographic profiles. chromatograms depicted in Fig. 8A and B. In fact, For these same samples, there were no defining this detector can simultaneously acquire up to four features of the PDA–UV contour plots (in contrast to corresponding excitation or emission wavelengths for the FL plots). The increased sensitivity and / or a given excitation or emission wavelength. As was increased selectivity that FL detection offers over previously shown (and will be further illustrated), PDA–UV detection is illustrated in Fig. 10.
this feature can be very useful for impurity profiling.
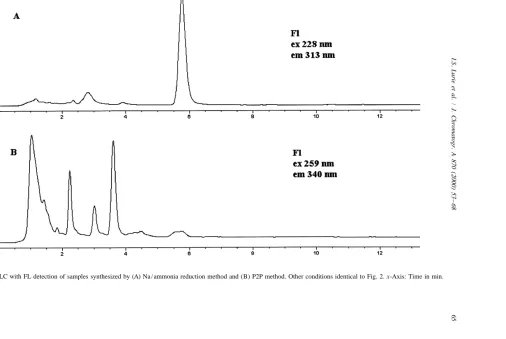
Two methamphetamine exhibits synthesized by 3.2. Impurity profiling by CEC the Na / ammonia reduction method and a P2P
approxi-I.S
.
Lurie
et
al
.
/
J.
Chromatogr
.
A
870
(2000
)
5
3
–
68
[image:11.612.106.661.82.423.2]63
64
I.S
.
Lurie
et
al
.
/
J.
Chromatogr
.
A
870
(2000
)
5
3
–
[image:12.612.111.647.91.431.2]68
I.S
.
Lurie
et
al
.
/
J.
Chromatogr
.
A
870
(2000
)
5
3
–
68
[image:13.612.106.667.91.430.2]65
66
I.S
.
Lurie
et
al
.
/
J.
Chromatogr
.
A
870
(2000
)
5
3
–
[image:14.612.112.650.81.419.2]68
I.S. Lurie et al. / J. Chromatogr. A 870 (2000) 53 –68 67
68 I.S. Lurie et al. / J. Chromatogr. A 870 (2000) 53 –68
mately 200 000 / m (compared to approximately vials. In addition, such a system would also allow increased voltages and reductions in analysis time. 40 000 / m via HPLC). As expected, CEC analysis of
three samples analyzed by HPLC (HI / Red P meth-od) gave distinctly different FL profiles. The
dif-4. Conclusions ferentiation of these samples is facilitated by the
significantly greater number of points of comparison
The utility of HPLC and CEC for impurity which CEC generates.
profiling of illicit methamphetamine was demon-In spite of excitation significantly removed from
strated. For HPLC, FL offered significantly lower the maxima of the naphthalene-like impurities, LIF
limits of detection versus UV. The use of contour detection at 257 nm still gave good limits of
plots obtained by a scanning FL detector was detection: S /N53 for NI 1 and NI 2 were 8.7 and
extremely useful for identification and analysis. CEC 10.8 ng / ml, respectively.
afforded greatly improved chromatography compared Repeatability (RSD, n58) of t , RRT, Area andR
to HPLC with good detection limits using LIF. RArea were examined for several peaks from the
sample shown in Fig. 11B. As shown in Table 2, good precision values were obtained for peaks 1–4
References for tR and RRT, with RSDs of#0.66 and #0.38%,
respectively. By using peak 4 as a reference,
im-[1] B.A. Perillo, R.F.X. Klein, E.S. Franzosa, Forensic Sci. Int. proved precision was obtained for RRT versus t . AsR
69 (1994) 1. also shown in Table 2, poor precision was obtained
[2] B.H. Groof Wassink, J. Chem. Educ. 51 (1974) 671. for Area (RSD$14.6%), however, satisfactory preci- [3] H.F. Skinner, Forensic Sci. Int. 48 (1990) 123. sion was obtained for RArea (RSD#4.63%). The [4] R.A. Ely, D.C. McGrath, J. Forensic Sci. 35 (1990) 720. use of a manual injection system probably contri- [5] R.F.X. Klein, personal communication, 1999.
[6] T.D. McKibben, personal communication, 1985. butes to the poor area precision; however, automated
[7] P. Vallely, J. Clandestine Lab. Invest. Chem. 5 (1995) 14. injection systems for CEC can also give poor results;
[8] Laboratories Amido, French Pat., 2782M (1964).
therefore, the use of corrected areas with an appro- [9] M. Lambrechts, T. Klemetsrud, K.E. Rasmussen, H.J. priate reference compound is desirable. Storesund, J. Chromatogr. 284 (1984) 499.
SDS was added to the mobile phase in order to [10] K. Tanaka, T. Ohmori, T. Inoue, S. Seta, J. Forensic Sci. 39 (1994) 500.
inhibit bubble formation [22]. However, despite
[11] M. Perkal, Y.L. Ng, J.R. Pearson, Forensic Sci. Int. 69 (1994) operating at a relatively low voltage (10 kV) and
77.
using this mobile phase additive with a low con- [12] T. Inoue, K. Tanaka, T. Ohmori, Y. Togawa, S. Seta, centration of a relatively nonconductive buffer (cur- Forensic Sci. Int. 69 (1994) 97.
rent 2mA), there was still a persistent problem with [13] L. Stromberg, H. Bergkvist, E.A.M.K. Edirisinghe, J. Chro-matogr. 258 (1983) 65.
bubble formation. The presence of bubbles, which
[14] J.H. Liu, W.W. Ku, J.T. Tsay, M.P. Fitzgerald, S. Kim, J. lead to reduced flows or column failure, would be
Forensic Sci. 27 (1982) 39.
greatly reduced by pressurizing the inlet and outlet [15] I.S. Lurie, R.P. Meyers, T.S. Conver, Anal. Chem. 70 (1998) 3255.
[image:16.612.44.261.580.655.2][16] I.S. Lurie, T.S. Conver, V.L. Ford, Anal. Chem. 70 (1998)
Table 2 4563.
CEC repeatability (RSD, n58) of retention time (t ), relativeR [17] I.S. Lurie, K.C. Chan, T.K. Spratley, J.F. Casale, H.J. Issaq, retention time (RRT), peak area (Area) and relative peak area J. Chromatogr. B 669 (1995) 3.
(RArea) for selected peaks (see Experimental for conditions) [18] I.S. Lurie, P.A. Hays, J.F. Casale, J.M. Moore, D.M. Castell, K.C. Chan, H.J. Issaq, Electrophoresis 19 (1998) 51. Peak RSD (%)
[19] T.S. Cantrell, J. Boban, L. Johnson, A.C. Allen, Forensic
tR RRT Area RArea Sci. Int. 39 (1988) 39.
[20] C. Yan, US Pat., 5 453 163 (1995).
1 0.31 0.38 14.6 4.48
[21] K.L. Windahl, M.J. McTigue, J.R. Pearson, S.J. Pratt, J.E.
2 0.59 0.06 19.8 4.63
Rowe, E.M. Sear, Forensic Sci. Int. 76 (1995) 97.
3 0.66 0.06 18.3 4.42
[22] R.M. Seifar, W.T. Kok, J.C. Kraak, H. Poppe,
Chromato-4 0.63 15.0