R E S E A R C H
Open Access
Predicting six-month mortality of patients with
traumatic brain injury: usefulness of common
intensive care severity scores
Rahul Raj
1*, Markus Benedikt Skrifvars
2, Stepani Bendel
3, Tuomas Selander
4, Riku Kivisaari
1, Jari Siironen
1and Matti Reinikainen
5Abstract
Introduction:The aim of this study was to evaluate the usefulness of the APACHE II (Acute Physiology and Chronic Health Evaluation II), SAPS II (Simplified Acute Physiology Score II) and SOFA (Sequential Organ Failure Assessment) scores compared to simpler models based on age and Glasgow Coma Scale (GCS) in predicting long-term outcome of patients with moderate-to-severe traumatic brain injury (TBI) treated in the intensive care unit (ICU).
Methods:A national ICU database was screened for eligible TBI patients (age over 15 years, GCS 3–13) admitted in 2003–2012. Logistic regression was used for customization of APACHE II, SAPS II and SOFA score-based models for six-month mortality prediction. These models were compared to an adjusted SOFA-based model (including age) and a reference model (age and GCS). Internal validation was performed by a randomized split-sample technique. Prognostic performance was determined by assessing discrimination, calibration and precision.
Results:In total, 1,625 patients were included. The overall six-month mortality was 33%. The APACHE II and SAPS II-based models showed good discrimination (area under the curve (AUC) 0.79, 95% confidence interval (CI) 0.75 to 0.82; and 0.80, 95% CI 0.77 to 0.83, respectively), calibration (P> 0.05) and precision (Brier score 0.166 to 0.167). The SOFA-based model showed poor discrimination (AUC 0.68, 95% CI 0.64 to 0.72) and precision (Brier score 0.201) but good calibration (P> 0.05). The AUC of the SOFA-based model was significantly improved after the insertion of age and GCS (ΔAUC +0.11,P< 0.001). The performance of the reference model was comparable to the APACHE II and SAPS II in terms of discrimination (AUC 0.77; compared to APACHE II,ΔAUC−0.02,P= 0.425; compared to SAPS II,ΔAUC−0.03,P= 0.218), calibration (P> 0.05) and precision (Brier score 0.181).
Conclusions:A simple prognostic model, based only on age and GCS, displayed a fairly good prognostic performance in predicting six-month mortality of ICU-treated patients with TBI. The use of the more complex scoring systems APACHE II, SAPS II and SOFA added little to the prognostic performance.
Introduction
Comparing mortality rates of patients treated in different ICUs is meaningless if differences in baseline factors affecting outcome, particularly severity of illness or injury, are not taken into account. Therefore, scoring systems that enable quantification of severity of illness are para-mount for the evaluation of quality of intensive care [1-4]. Moreover, precise data on severity of illness and the
accompanying risk of death are essential in clinical studies [5,6]. However, a scoring system and its associated risk prediction model is useful only if it demonstrates both good calibration and discrimination [7-10].
Among the most commonly used severity of illness scoring systems in intensive care are the APACHE II (acute physiology and chronic health evaluation II) and the SAPS II (simplified acute physiology score II) [11-13]. They were developed for the general ICU population and include equations for the prediction of the risk of in-hospital death [11,12]. Another commonly used scoring system is the SOFA (sequential organ failure
* Correspondence:rahul.br.raj@icloud.com 1
Department of Neurosurgery, Helsinki University Central Hospital, Topeliuksenkatu 5, PB 266, Helsinki FI-00029, HUS, Finland Full list of author information is available at the end of the article
assessment) score, which was designed as a measure of organ dysfunction, but has also been used for outcome prediction [14-18].
Patients with traumatic brain injury (TBI) represent a specific type of ICU patients with a substantially different prognosis to the general ICU population [19]. Importantly, in patients with TBI, hospital discharge mortality is a poor outcome measure as it significantly underestimates mortality rates [20]. Thus, using hospital mortality as an endpoint may cause bias if discharge practices differ and models able to adequately predict long-term outcomes are needed [21-23]. The role of the ICU scoring systems for long-term outcome prediction in patients with TBI treated in the ICU is uncertain, and although TBI-specific prognostic models are likely to be more accurate than the ICU scoring systems in this patient group, they are not as widely implemented [13,19]. Therefore, we decided to evaluate the usefulness of the APACHE II, SAPS II and SOFA scores in predicting six-month mortality after TBI and to find out whether these scoring systems are of any additional value compared to a simple model based only on age and the GCS.
Methods
Using the database of the Finnish Intensive Care Consor-tium (FICC) we retrieved data on patients who were aged >15 years, and were treated in an ICU with neuro-surgical expertise (university hospitals in Finland) during a ten-year period (2003 to 2012). To exclude outcome bias we only included patients with a moderate-to-severe TBI
(GCS ≤13) during the first ICU day [24]. The FICC is a
high-quality database that prospectively collects data on the characteristics and severity of illness as well as outcomes from ICUs all over Finland [25]. Treatment standards in included institutions are according to the Brain Trauma Foundation guidelines [26]. The Ethics com-mittee of the Northern Savonia hospital district approved the study. As the FICC database is an anonymous database the Ethics committee of Northern Savonia hospital district waived the need for informed consent. Following that, the FICC board granted us access to the database.
Statistical analysis
We used theχ2test (two-tailed) for categorical univariate analyses. We tested continuous variables for skewness and chose appropriate statistical tests accordingly. We
used the Mann-WhitneyU-test for non-parametric data
and the Student t-test for parametric data. Parametric
data are presented as mean (SD) and non-parametric data as median (IQR). The primary outcome was six-month mortality; a secondary outcome was in-hospital mortality.
To assess the performance of the different scoring systems a split-sample technique was used, where the study population was randomly divided into a development and
validation cohort [27]. Logistic regression analysis was used for customization of the APACHE II, SAPS II and SOFA-based prediction models for six-month mortality prediction. The risk of death is calculated using the equation:
1= 1þe‐logit;
where each scoring system has a defined logit (see Additional file 1). For the adjusted SOFA, age was added into the model as an additional variable and the GCS component from the SOFA score was extracted and inserted as a separate variable. A reference model, including only age and the worst measured GCS in the first 24 hours in the ICU, was built for comparison. For the adjusted SOFA and reference models the age and GCS were tested as binominal, categorical and continuous variables. Dichotomization of GCS (based on the median) and ten-year interval age-categorization was found to yield the best results. All models were also customized for in-hospital mortality prediction, in order to assess differences in prognostic performances of each scoring system regarding both short and long-term mortality.
Scoring system performance was assessed by determining discrimination, calibration and precision [28]. Discrimin-ation refers to the ability to separate between those who die and those who survive. It is measured by calculating the area under the receiver operating characteristic curve (AUC). An AUC of 0.50 is no better than mere chance, whereas values > 0.90, >0.80 and >0.70 are considered excellent, good and satisfactory, respectively [10]. The AUC curves were compared to one another using the non-parametric DeLong-DeLong test [29].
Calibration refers to the agreement between predicted and observed mortality across different classes of risk and
is usually assessed using the Hosmer-Lemeshow Ĉ-test
independent of each other, should not be connected by a line) [30].
To overcome the limitations of the H-L, we combined the classic H-L test with a new statistical test for calibration, the GiViTI calibration belt [30,31]. In addition to giving a calibration curve that illustrates the relationship between predicted risk and observed outcome over different levels of risk, this technique also gives the confidence belt of the curve, that is, an estimation of the degree of uncertainty regarding the true location of the curve. In the GiViTI calibration belt, the relationship between the predicted and observed outcome is calculated by fitting a polynomial logistic function between the logit transformation of the predicted probability and outcome. The calibration belt calculates the 80% CI (light gray area) and 95% CI (dark gray area) surrounding the calibration curve. A statistically significant deviation from the bisector vector (diagonal line for perfect calibration) occurs when the 95% CI does not cover the bisector.
Precision was measured by the Brier score, which is the mean squared difference between the observed and predicted outcome, comprehending both calibration and discrimination [32]. When the incidence of the outcome is 50% the Brier score ranges from 0.0 (perfect) to 0.25 (worthless) [33].
For the statistical analyses, IBM SPSS Statistics 20.0 for Windows and R version 3.0.1 for Windows (R Foundation for Statistical Computing, Vienna, Austria) were used. The H-L calibration was plotted using the PredictABEL library and the calibration belt was plotted using the GiViTI calibration belt library [30,34,35].
Results
Baseline characteristics
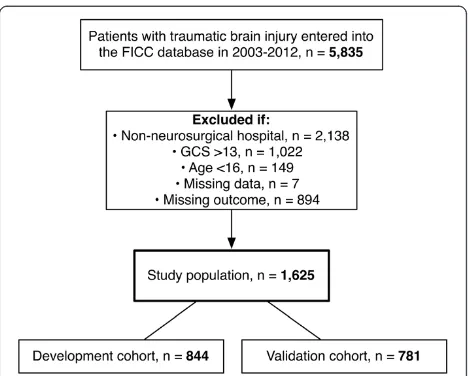
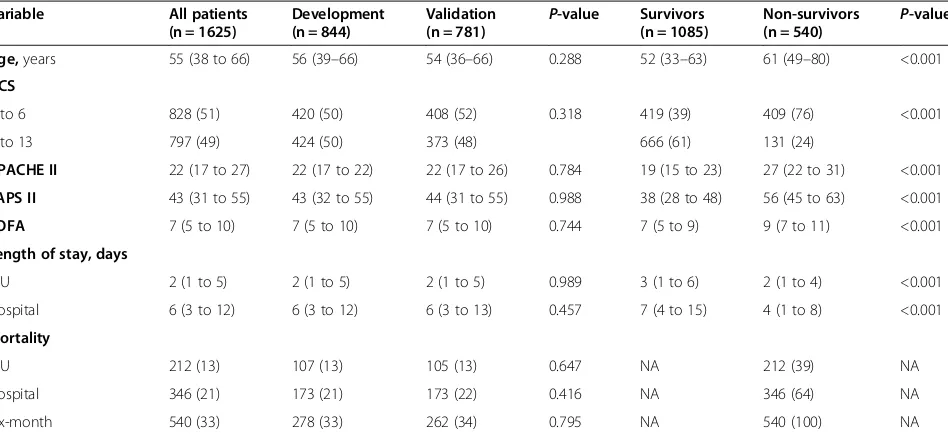
In total 1,625 patients were included: 844 patients were randomized to the development cohort and 781 to the validation cohort (Figure 1). The median age was 55 years (IQR 38 to 66). Overall crude 6-month mortality was 33% (n = 540/1625); 64% of all deaths (n = 346) took place in the index hospital. There were no significant differences in baseline characteristics, severity scores or outcome between the development and validation cohorts. Dif-ferences in scoring system variables between 6-month survivors and non-survivors are shown in Table 1 and in Additional file 2. For the adjusted SOFA and the reference models, the GCS was dichotomized to 3 to 6 and 7 to 13 (based on the median GCS). The relationship and effect of GCS and age on 6-month mortality is shown in Table 2, and illustrated in Additional file 3.
Hospital mortality performance
Following customization and validation the SAPS II showed the highest discriminative power (AUC 0.81), followed by the APACHE II (AUC 0.80), the adjusted SOFA (AUC
0.79), the reference model (AUC 0.74) and the SOFA (AUC 0.73). The AUCs of the SAPS II and APACHE II were significantly higher compared to the reference
model (ΔAUC 0.07, P= 0.011; ΔAUC 0.06, P= 0.013,
respectively). The adjusted SOFA score showed signifi-cantly improved discriminative power compared to the
original SOFA score (AUC 0.79 versus 0.73, ΔAUC
0.06,P= 0.018).
All models displayed good calibration for hospital mortal-ity prediction with no significant over- or under-prediction intervals, as measured by the GiViTI calibration belt (see Additional files 4 and 5). Precision, as measured by the Brier score, varied between 0.128 and 0.151.
Six-month mortality performance
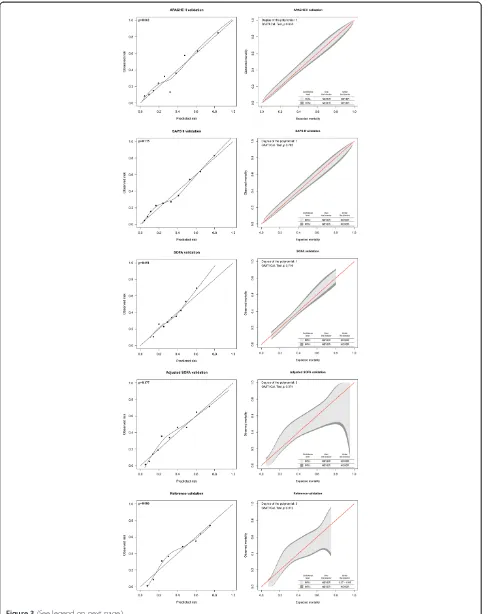
The scoring systems showed a lower discriminative power for predicting 6-month mortality compared to predicting in-hospital mortality. Following customization and valid-ation, the discriminative power was highest for SAPS II (AUC 0.80), followed by APACHE II (AUC 0.79), the adjusted SOFA (AUC 0.79), the reference model (AUC 0.77) and the SOFA (AUC 0.68) (Figure 2). The AUC of the SOFA-based model was significantly improved after the insertion of age and GCS (ΔAUC 0.11,P<0.001) to
match the ones of APACHE II (P= 0.920) and SAPS II
(P= 0.745). None of the scoring systems had higher
AUCs compared to the reference model (reference model
versus APACHE II, P= 0.425; reference model versus
SAPS II,P= 0.218) (Table 3).
[image:3.595.305.539.87.275.2]All models showed good calibration for 6-month mor-tality prediction according to the H-L test and none of them displayed any significant deviations from the bisector line by the GiViTI tests (P>0.05) (Figure 3). Precision, as measured by the Brier score, ranged from 0.166 for SAPS II to 0.201 for SOFA.
Discussion Key findings
We conducted a retrospective study using a nationwide multi-center ICU database, investigating the usefulness of the APACHE II, SAPS II and SOFA scoring systems in predicting long-term mortality for ICU-treated patients with moderate-to-severe TBI. We found that after custom-ization, both the APACHE II and SAPS II-based models showed good performance (discrimination, calibration and precision), whereas the SOFA-based model showed poor performance (poor discrimination and precision but good calibration) for predicting 6-month mortality. The performance of the SOFA-based model was improved with the inclusion of age and the GCS. However, none of these severity score-based models showed superior performance to a simple reference model including only age and the GCS.
Comparison with previous studies
Previous studies have suggested that APACHE II and SAPS II are either poor or good predictors of short-term mortality in trauma and TBI patients [36-39]. Reports on long-term outcome prediction are scarce. Brinkmanet al. studied the APACHE IV and found that a customized model had an AUC of 0.84 for predicting 6-month mortal-ity in a non-selected ICU population [23]. In patients with acute myocardial infarction, Huanget al. showed the SOFA score to be of moderate value in predicting long-term outcome in patients with acute myocardial infarction (AUC 0.78) [40]. In comparison, the best-performing scoring system in the present study (SAPS II) had an AUC of 0.80.
[image:4.595.63.537.100.318.2]Similar to the results of Brinkmanet al., we found the AUCs of the APACHE II- and SAPS II-based models to be higher for predicting in-hospital compared to 6-month mortality [23]. For in-hospital mortality prediction, the SAPS II-based model was significantly superior compared to the reference model. As shown in Additional file 2, initial physiological derangements for patients discharged alive from the hospital were uncommon, whereas they were common for those dying in the hospital. However, among those patients who were discharged alive from the index hospital, there were more evident differences in age and GCS between those who died in the following 6 months and those who survived. Accordingly, the AUC of the reference model was found to be higher for 6-month mortality compared to in-hospital mortality prediction. These findings suggest that abnormal physiology captured by severity of illness scores is of significance for in-hospital but less so for long-term mortality prediction, as long-term
Table 1 Baseline characteristics for development and validation cohorts and for six-month survivors and non-survivors
Variable All patients (n = 1625)
Development (n = 844)
Validation (n = 781) P
-value Survivors (n = 1085)
Non-survivors
(n = 540) P
-value
Age,years 55 (38 to 66) 56 (39–66) 54 (36–66) 0.288 52 (33–63) 61 (49–80) <0.001
GCS
3 to 6 828 (51) 420 (50) 408 (52) 0.318 419 (39) 409 (76) <0.001
7 to 13 797 (49) 424 (50) 373 (48) 666 (61) 131 (24)
APACHE II 22 (17 to 27) 22 (17 to 22) 22 (17 to 26) 0.784 19 (15 to 23) 27 (22 to 31) <0.001
SAPS II 43 (31 to 55) 43 (32 to 55) 44 (31 to 55) 0.988 38 (28 to 48) 56 (45 to 63) <0.001
SOFA 7 (5 to 10) 7 (5 to 10) 7 (5 to 10) 0.744 7 (5 to 9) 9 (7 to 11) <0.001
Length of stay, days
ICU 2 (1 to 5) 2 (1 to 5) 2 (1 to 5) 0.989 3 (1 to 6) 2 (1 to 4) <0.001
Hospital 6 (3 to 12) 6 (3 to 12) 6 (3 to 13) 0.457 7 (4 to 15) 4 (1 to 8) <0.001
Mortality
ICU 212 (13) 107 (13) 105 (13) 0.647 NA 212 (39) NA
Hospital 346 (21) 173 (21) 173 (22) 0.416 NA 346 (64) NA
Six-month 540 (33) 278 (33) 262 (34) 0.795 NA 540 (100) NA
Categorical variables are presented as number (%), all continuous variables were highly skewed and are presented as median (IQR). APACHE II, acute physiology and chronic health evaluation II; SAPS II, simplified acute physiology score II; SOFA, sequential organ failure assessment; NA, not applicable.
Table 2 Relationship between age and Glasgow coma scale (GCS) on six-month mortality
Age, years Mortality, % (absolute numbers)
All patients (n = 1625)
GCS 7 to 13 (n = 797)
GCS 3 to 6 (n = 828)
<40 20 (86/438) 2 (4/210) 36 (82/228)
40 to 49 27 (50/187) 11 (11/97) 43 (39/90)
50 to 59 32 (116/363) 10 (17/167) 51 (99/196)
60 to 69 42 (129/309) 24 (36/149) 58 (93/160)
[image:4.595.56.291.606.724.2]outcomes seem to be predominantly determined by age and the GCS.
Compared to the APACHE II and SAPS II, the SOFA score seems to be of limited value in predicting long-term mortality in critically ill TBI patients. One obvious reason for this is that the SOFA score does not pay regard to age, which heavily affects prognosis in this
[image:5.595.57.540.89.340.2]patient group [41]. Furthermore, multiple organ failure (MOF), well demonstrated by a high SOFA score, is a rare complication of TBI, occurring in less than 1% of all TBI patients treated in the ICU [42,43]. In the present study, only one out of 1,625 patients had a SOFA liver score of 4 and 23 patients had a SOFA renal score of 4. Including age and GCS as a separate variable Figure 2Area under the curve (AUC) for six-month mortality prediction.Left panel, the development cohort; right panel, the validation cohort. APACHE II, acute physiology and chronic health evaluation II; GCS, Glasgow coma scale; SAPS II, simplified acute physiology score II; SOFA, sequential organ failure assessment.
Table 3 Scoring system performance for six-month mortality
Performance variable
Discrimination Calibration Precision
AUC 95% CI H-LP-value GiViTIP-value‡ Brier score
Development cohort
APACHE II 0.81 0.78, 0.84 0.153 NA 0.160
SAPS II 0.81 0.77, 0.84 0.343 NA 0.160
SOFA 0.68 0.64, 0.72 0.282 NA 0.201
Adjusted SOFA* 0.78 0.75, 0.81 0.444 NA 0.175
Reference† 0.75 0.72, 0.78 0.144 NA 0.185
Validation cohort
APACHE II 0.79 0.75, 0.82 0.062 0.653 0.167
SAPS II 0.80 0.77, 0.83 0.775 0.782 0.166
SOFA 0.68 0.64, 0.72 0.691 0.710 0.201
Adjusted SOFA* 0.79 0.76, 0.82 0.177 0.574 0.174
Reference† 0.77 0.74, 0.80 0.086 0.072 0.181
[image:5.595.58.544.504.699.2]into the adjusted SOFA model improved the discrimination so that the prognostic performance of the model matched that of the best performing models (SAPS II- and APACHE II-based models). This further strengthens the importance of age and GCS in long-term outcome-prediction in this patient group.
To assess calibration we used a new method, namely the GiViTI calibration belt [30]. The GiViTI belt has two main applications: performance comparison between different centers and external validation of prediction models [30,35,44]. Although the mathematical basis of the GiViTI calibration belt has been shown elsewhere it should be compared to the H-L test, which has been considered the gold standard of calibration testing [31,35]. We found the GiViTI and H-L tests to generate similar results for calibration. The main benefit of the GiViTI test is to pinpoint intervals of under- and over-prediction for a given model. Although no significant deviations from the bisector line were noted for any of the models, the reference and the adjusted SOFA models displayed a less-than-perfect calibration belt for 6-month mortality prediction. This is due to the higher degree of polynomial function fitted between the predicted and observed out-come, resulting in wide confidence intervals [35]. This is to our knowledge one of the first clinical studies com-paring the traditional H-L calibration test with the GiViTI calibration belt [31]. The GiViTI calibration belt should be strongly considered in further studies in addition to the traditional H-L test.
Future implications
Future studies should compare the performance of general ICU scoring systems to that of TBI-specific prediction models, such as the IMPACT or the CRASH models [45,46]. In the present study, the best performing scoring system-based models showed AUCs between 0.79 and 0.80 (APACHE II, SAPS II) for predicting 6-month mortality, whereas external validation studies of the IMPACT model have shown AUCs up to 0.87 [47-49]. The general ICU scores lack data on several variables that are important for outcome prediction in TBI patients, for example, pupillary light reaction and head computerized tomography (CT) scan characteristics and signs of increased intracranial pressure, which may reduce predictive ability [45,50,51].
In the era of a more widespread use of TBI-specific prognostic models it is unlikely that future prospective TBI studies will rely only on general ICU scoring systems
for case-mix adjustment. However there are numerous high-quality databases in the field of intensive care and trauma medicine around the world that lack some key variables limiting the use of TBI-specific prediction models (for example, the IMPACT). Conversely, general ICU scores (especially APACHE II and SAPS II) are ubi-quitously collected in ICUs around the world and based on our results, reliable case-mix adjustment for long-term outcome prediction can be achieved by applying these [13]. On the other hand in epidemiological studies on TBI a simple model including only age and GCS also provides sufficient accuracy. This has implications for case-mix adjustment in forthcoming epidemiological studies [19].
Limitations
We acknowledge some limitations to our study. First, due to the retrospective nature of the study we were limited to using 6-month mortality as the primary outcome measure. Although mortality is a more clear-cut end point, future studies should consider outcome variables such as neuro-logical outcome and quality of life. Second, as the FICC database does not include radiological data or TBI-specific baseline characteristics, we had to rely on physiological data when evaluating injury severity and could not study the performance of any of the available TBI-specific prediction models, something of key importance for future studies. Third, some long-term outcome data were missing, limiting the power of the study.
Conclusion
A simple prognostic model, based only on age and GCS, displayed a fairly good prognostic performance in pre-dicting 6-month mortality of ICU-treated patients with TBI. The use of the more complex scoring systems APA-CHE II, SAPS II and SOFA added little to the prognostic performance.
Key messages
The APACHE II and SAPS II-based prediction models
showed equally good prognostic performance in predicting 6-month mortality of ICU-treated patients with TBI.
The SOFA-based model displayed poor performance
in 6-month mortality prediction. However, after the inclusion of age and the GCS, as separate variables, the performance improved significantly to match that of the APACHE II and SAPS II.
(See figure on previous page.)
A simple prognostic model, including only age and GCS, also displayed fairly good prognostic
performance in 6-month mortality prediction.
Forthcoming epidemiological studies lacking
necessary data for the use of TBI-specific models may use the general ICU scoring systems APACHE II and SAPS II or the novel reference model for adequate case-mix adjustment.
Additional files
Additional file 1:Scoring system equations for the calculation of 6-month mortality risk.
Additional file 2:Table showing scoring system characteristics differences between 6-month survivors and non-survivors.
Additional file 3:Figure showing relationship and effect of age and Glasgow coma scale on outcome.For the reference and adjusted SOFA models, the GCS was dichotomized to 3 to 6 and 7 to 13, and age was categorized by 10-year intervals (as shown). The figure demonstrates a strong relationship and effect of age and GCS on 6-month mortality.
Additional file 4:Figure showing calibration for in-hospital mortality prediction in the validation cohort.Right, Italian Group for the Evaluation of Intervention in Intensive Care Medicine (GiViTI) calibration belt; left, traditional Hosmer-LemeshowĈ-test (H-L) calibration plot.
Additional file 5:Table showing scoring system performance for in-hospital mortality.
Abbreviations
APACHE II:acute physiology and chronic health evaluation II; AUC: area under the curve; FICC: Finnish Intensive Care Consortium; GCS: Glasgow coma scale; GiViTI: Italian Group for the Evaluation of Intervention in Intensive Care Medicine; H-L: Hosmer-LemeshowĈ-test; SAPS II: simplified acute physiology score II; SOFA: sequential organ failure assessment; TBI: traumatic brain injury.
Competing interests
The authors declare that they have no conflict of interest. The study was funded by a Helsinki University Hospital EVO grant (TYH2012142),Medicinska Understöds föreningen Liv och Hälsa, Finska Läkaresällskapetand the Maire Taponen Foundation.
Authors’contributions
RR, MS, SB and MR designed the study. MR, SB, MS, JS, RK and RR contributed to the data collection and assembly. RR and TS are responsible for all statistical analyses. All authors contributed to the result interpretation. RR, MR, MS and SB drafted the manuscript. All authors read, edited and approved the manuscript in its final form.
Acknowledgements
The authors give their gratitude to the Finnish Intensive Care Consortium and all the contributing institutions. We also wish to thank Giovanni Nattino (RCCS-Istituto di Ricerche Farmacologiche“Mario Negri”Laboratory of Clinical Epidemiology) for his statistical assistance.
Author details
1
Department of Neurosurgery, Helsinki University Central Hospital, Topeliuksenkatu 5, PB 266, Helsinki FI-00029, HUS, Finland.2Department of Anesthesiology, Intensive Care, Emergency Care and Pain management, Helsinki University Central Hospital, Topeliuksenkatu 5, PB 266, Helsinki FI-00029, HUS, Finland.3Department of Intensive Care, Kuopio University Hospital and Kuopio University, Puijonlaaksontie 2, 70211 Kuopio, Finland. 4
Science Service Center, Kuopio University Hospital, Puijonlaaksontie 2, 70211 Kuopio, Finland.5Department of Intensive Care, North Karelia Central Hospital, Tikkamäentie 16, 80210 Joensuu, Finland.
Received: 19 January 2014 Accepted: 25 March 2014 Published: 3 April 2014
References
1. Le Gall J-R:The use of severity scores in the intensive care unit.Intensive Care Med2005,31:1618–1623.
2. Ridley S:Severity of illness scoring systems and performance appraisal.
Anaesthesia1998,53:1185–1194.
3. Rothen HU, Takala J:Can outcome prediction data change patient outcomes and organizational outcomes?Curr Opin Crit Care2008,14:513–519. 4. Woodhouse D, Berg M, van der Putten J, Houtepen J:Will benchmarking
ICUs improve outcome?Curr Opin Crit Care2009,15:450–455. 5. Hosmer DW, Hosmer T, Le Cessie S, Lemeshow S:A comparison of
goodness-of-fit tests for the logistic regression model.Stat Med1997,
16:965–980.
6. Maas AIR, Murray GD, Roozenbeek B, Lingsma HF, Butcher I, McHugh GS, Weir J, Lu J, Steyerberg EW, International Mission on Prognosis Analysis of Clinical Trials in Traumatic Brain Injury (IMPACT) Study Group:Advancing care for traumatic brain injury: findings from the IMPACT studies and perspectives on future research.Lancet Neurol2013,12:1200–1210. 7. Bertolini G, D’Amico R, Nardi D, Tinazzi A, Apolone G:One model, several
results: the paradox of the Hosmer-Lemeshow goodness-of-fit test for the logistic regression model.J Epidemiol Biostat2000,5:251–253. 8. Lemeshow S, Le Gall JR:Modeling the severity of illness of ICU patients.
A systems update.JAMA1994,272:1049–1055.
9. Kramer AA, Zimmerman JE:Assessing the calibration of mortality benchmarks in critical care: The Hosmer-Lemeshow test revisited.Crit Care Med2007,
35:2052–2056.
10. Hosmer DW Jr, Lemeshow S, Sturdivant RX:Applied Logistic Regression, 3rd edition.John Wiley & Sons; 2013.
11. Knaus WA, Draper EA, Wagner DP, Zimmerman JE:APACHE II: a severity of disease classification system.Crit Care Med1985,13:818–829.
12. Le Gall JRJ, Lemeshow SS, Saulnier FF:A new Simplified Acute Physiology Score (SAPS II) based on a European/North American multicenter study.
JAMA1993,270:2957–2963.
13. Vincent J-L, Moreno R:Clinical review: scoring systems in the critically ill.
Crit Care2010,14:207.
14. Vincent JL, Moreno R, Takala J, Willatts S, de Mendonça A, Bruining H, Reinhart CK, Suter PM, Thijs LG:The SOFA (Sepsis-related Organ Failure Assessment) score to describe organ dysfunction/failure. On behalf of the Working Group on Sepsis-Related Problems of the European Society of Intensive Care Medicine.In Intensive Care Med1996,22:707–710. 15. Vincent JL, de Mendonça A, Cantraine F, Moreno R, Takala J, Suter PM,
Sprung CL, Colardyn F, Blecher S:Use of the SOFA score to assess the incidence of organ dysfunction/failure in intensive care units: results of a multicenter, prospective study. Working group on“sepsis-related problems”of the European Society of Intensive Care Medicine.Crit Care Med1998,26:1793–1800.
16. Ferreira FLF, Bota DPD, Bross AA, Mélot CC, Vincent JLJ:Serial evaluation of the SOFA score to predict outcome in critically ill patients.JAMA2001,
286:1754–1758.
17. Minne L, Abu-Hanna A, de Jonge E:Evaluation of SOFA-based models for predicting mortality in the ICU: A systematic review.Crit Care2008,12:R161. 18. Pettilä V, Pettilä M, Sarna S, Voutilainen P, Takkunen O:Comparison of
multiple organ dysfunction scores in the prediction of hospital mortality in the critically ill.Crit Care Med2002,30:1705–1711.
19. Lingsma HF, Roozenbeek B, Steyerberg EW, Murray GD, Maas AIR:Early prognosis in traumatic brain injury: from prophecies to predictions.
Lancet Neurol2010,9:543–554.
20. Myburgh JA, Cooper DJ, Finfer SR, Venkatesh B, Jones D, Higgins A, Bishop N, Higlett T, Australasian Traumatic Brain Injury Study (ATBIS) Investigators for the Australian, New Zealand Intensive Care Society Clinical Trials Group:
Epidemiology and 12-month outcomes from traumatic brain injury in Australia and New Zealand.J Trauma2008,64:854–862.
21. Angus DC:Scoring system fatigue…and the search for a way forward.
Crit Care Med2000,28:2145–2146.
22. Pouw ME, Peelen LM, Moons KGM, Kalkman CJ, Lingsma HF:Including post-discharge mortality in calculation of hospital standardised mortality ratios: retrospective analysis of hospital episode statistics.BMJ2013,
347:f5913.
24. Mena JHJ, Sanchez AIA, Rubiano AMA, Peitzman ABA, Sperry JLJ, Gutierrez MIM, Puyana JCJ:Effect of the modified Glasgow Coma Scale score criteria for mild traumatic brain injury on mortality prediction: comparing classic and modified Glasgow Coma Scale score model scores of 13.J Trauma2011,
71:1185–1193.
25. Reinikainen M, Mussalo P, Hovilehto S, Uusaro A, Varpula T, Kari A, Pettilä V, Finnish Intensive Care Consortium:Association of automated data collection and data completeness with outcomes of intensive care. A new customised model for outcome prediction.Acta Anaesthesiol Scand 2012,56:1114–1122.
26. Brain Trauma Foundation, American Association of Neurological Surgeons, Congress of Neurological Surgeons:Guidelines for the management of severe traumatic brain injury.J Neurotrauma2007,26:S1–S106. 27. Picard RR, Berk KN:Data splitting.Am Statistician1990,44:140–147. 28. Steyerberg EW, Vickers AJ, Cook NR, Gerds T, Gonen M, Obuchowski N,
Pencina MJ, Kattan MW:Assessing the performance of prediction models: a framework for traditional and novel measures.Epidemiology2010,
21:128–138.
29. DeLong ER, DeLong DM, Clarke-Pearson DL:Comparing the areas under two or more correlated receiver operating characteristic curves: a nonparametric approach.Biometrics1988,44:837–845.
30. Finazzi S, Poole D, Luciani D, Cogo PE, Bertolini G:Calibration belt for quality-of-care assessment based on dichotomous outcomes.PLoS ONE 2011,6:e16110.
31. Serrano N:Calibration strategies to validate predictive models: is new always better?Intensive Care Med2012,38:1246–1248.
32. Hilden J, Habbema JD, Bjerregaard B:The measurement of performance in probabilistic diagnosis. III. Methods based on continuous functions of the diagnostic probabilities.Methods Inf Med1978,17:238–246. 33. Steyerberg EW, Harrell FE, Borsboom GJ, Eijkemans MJ, Vergouwe Y, Habbema
JD:Internal validation of predictive models: efficiency of some procedures for logistic regression analysis.J Clin Epidemiol2001,54:774–781. 34. Kundu S, Aulchenko YS, van Duijn CM, Janssens ACJW:PredictABEL: an R
package for the assessment of risk prediction models.Eur J Epidemiol 2011,26:261–264.
35. Nattino G, Finazzi S, Bertolini G:A new calibration test and a reappraisal of the calibration belt for the assessment of prediction models based on dichotomous outcomes.Stat Med2014. doi:10.1002/sim.6100.
36. Vassar MJ, Lewis FR, Chambers JA, Mullins RJ, O’Brien PE, Weigelt JA, Hoang MT, Holcroft JW:Prediction of outcome in intensive care unit trauma patients: a multicenter study of Acute Physiology and Chronic Health Evaluation (APACHE), Trauma and Injury Severity Score (TRISS), and a 24-hour intensive care unit (ICU) point system.J Trauma1999,47:324–329.
37. Livingston BM, MacKirdy FN, Howie JC, Jones R, Norrie JD:Assessment of the performance of five intensive care scoring models within a large Scottish database.Crit Care Med2000,28:1820–1827.
38. Rocca B, Martin C, Viviand X, Bidet PF, Saint-Gilles HL, Chevalier A:Comparison of four severity scores in patients with head trauma.J Trauma1989,
29:299–305.
39. Reiter A, Mauritz W, Jordan B, Lang T, Pölzl A, Pelinka L, Metnitz PGH:
Improving risk adjustment in critically ill trauma patients: the TRISS-SAPS Score.J Trauma2004,57:375–380.
40. Huang S-S, Chen Y-H, Lu T-M, Chen L-C, Chen J-W, Lin S-J:Application of the Sequential Organ Failure Assessment score for predicting mortality in patients with acute myocardial infarction.Resuscitation2012,83:591–595. 41. Mushkudiani NA, Engel DC, Steyerberg EW, Butcher I, Lu J, Marmarou A,
Slieker F, McHugh GS, Murray GD, Maas AIR:Prognostic value of demographic characteristics in traumatic brain injury: results from the IMPACT study.J Neurotrauma2007,24:259–269.
42. Schirmer-Mikalsen K, Moen KG, Skandsen T, Vik A, Klepstad P:Intensive care and traumatic brain injury after the introduction of a treatment protocol: a prospective study.Acta Anaesthesiol Scand2013,57:46–55.
43. Roberts BW, Kilgannon JH, Chansky ME, Mittal N, Wooden J, Parrillo JE, Trzeciak S:Multiple organ dysfunction after return of spontaneous circulation in postcardiac arrest syndrome.Crit Care Med2013,41:1492–1501. 44. Poole D, Rossi C, Latronico N, Rossi G, Finazzi S, Bertolini G, GiViTI:
Comparison between SAPS II and SAPS 3 in predicting hospital mortality in a cohort of 103 Italian ICUs. Is new always better?Intensive Care Med 2012,38:1280–1288.
45. Steyerberg EW, Mushkudiani N, Perel P, Butcher I, Lu J, McHugh GS, Murray GD, Marmarou A, Roberts I, Habbema JDF, Maas AIR:Predicting outcome after
traumatic brain injury: development and international validation of prognostic scores based on admission characteristics.PLoS Med2008,
5:e165.
46. Trial Collaborators MRCCRASH, Perel P, Arango M, Clayton T, Edwards P, Komolafe E, Poccock S, Roberts I, Shakur H, Steyerberg E, Yutthakasemsunt S:Predicting outcome after traumatic brain injury: practical prognostic models based on large cohort of international patients.BMJ2008,
336:425–429.
47. Raj R, Siironen J, Kivisaari R, Hernesniemi J, Tanskanen P, Handolin L, Skrifvars MB:External Validation of the IMPACT Model and the Role of Markers of Coagulation.Neurosurgery2013,73:305–311.
48. Panczykowski DM, Puccio AM, Scruggs BJ, Bauer JS, Hricik AJ, Beers SR, Okonkwo DO:Prospective independent validation of IMPACT modeling as a prognostic tool in severe traumatic brain injury.J Neurotrauma2012,
29:47–52.
49. Lingsma H, Andriessen TMJC, Haitsema I, Horn J, van der Naalt J, Franschman G, Maas AIR, Vos PE, Steyerberg EW:Prognosis in moderate and severe traumatic brain injury: External validation of the IMPACT models and the role of extracranial injuries.J Trauma Acute Care Surg 2013,74:639–646.
50. Maas AIR, Steyerberg EW, Butcher I, Dammers R, Lu J, Marmarou A, Mushkudiani NA, McHugh GS, Murray GD:Prognostic value of
computerized tomography scan characteristics in traumatic brain injury: results from the IMPACT study.J Neurotrauma2007,24:303–314. 51. Marmarou A, Lu J, Butcher I, McHugh GS, Murray GD, Steyerberg EW,
Mushkudiani NA, Choi S, Maas AIR:Prognostic value of the Glasgow Coma Scale and pupil reactivity in traumatic brain injury assessed pre-hospital and on enrollment: an IMPACT analysis.J Neurotrauma2007,24:270–280.
doi:10.1186/cc13814
Cite this article as:Rajet al.:Predicting six-month mortality of patients with traumatic brain injury: usefulness of common intensive care severity scores.Critical Care201418:R60.
Submit your next manuscript to BioMed Central and take full advantage of:
• Convenient online submission
• Thorough peer review
• No space constraints or color figure charges
• Immediate publication on acceptance
• Inclusion in PubMed, CAS, Scopus and Google Scholar
• Research which is freely available for redistribution