Report on the Second NLG Challenge on
Generating Instructions in Virtual Environments (GIVE-2)
Alexander KollerSaarland University [email protected]
Kristina Striegnitz Union College [email protected]
Andrew Gargett Saarland University [email protected]
Donna Byron Northeastern University
Justine Cassell Northwestern University
Robert Dale Macquarie University
Johanna Moore University of Edinburgh
Jon Oberlander University of Edinburgh
Abstract
We describe the second installment of the Challenge on Generating Instructions in Virtual Environments (GIVE-2), a shared task for the NLG community which took place in 2009-10. We evaluated seven NLG systems by connecting them to 1825 users over the Internet, and report the re-sults of this evaluation in terms of objec-tive and subjecobjec-tive measures.
1 Introduction
This paper reports on the methodology and results of the Second Challenge on Generating Instruc-tions in Virtual Environments (GIVE-2), which we ran from August 2009 to May 2010. GIVE is a shared task for the NLG community which we ran for the first time in 2008-09 (Koller et al., 2010). An NLG system in this task must generate instructions which guide a human user in solving a treasure-hunt task in a virtual 3D world, in real time. For the evaluation, we connect these NLG systems to users over the Internet, which makes it possible to collect large amounts of evaluation data cheaply.
While the GIVE-1 challenge was a success, in that it evaluated five NLG systems on data from 1143 game runs in the virtual environments, it was limited in that users could only move and turn in discrete steps in the virtual environments. This made the NLG task easier than intended; one of the best-performing GIVE-1 systems generated instructions of the form “move three steps for-ward”. The primary change in GIVE-2 compared to GIVE-1 is that users could now move and turn freely, which makes expressions like “three steps” meaningless, and makes it hard to predict the pre-cise effect of instructing a user to “turn left”.
We evaluated seven NLG systems from six in-stitutions in GIVE-2 over a period of three months
from February to May 2010. During this time, we collected 1825 games that were played by users from 39 countries, which is an increase of over 50% over the data we collected in GIVE-1. We evaluated each system both on objec-tive measures (success rate, completion time, etc.) and subjective measures which were collected by asking the users to fill in a questionnaire. We completely revised the questionnaire for the sec-ond challenge, which now consists of relatively fine-grained questions that can be combined into more high-level groups for reporting. We also in-troduced several new objective measures, includ-ing the point in the game in which users lost or cancelled, and an experimental “back-to-base” task intended to measure how much users learned about the virtual world while interacting with the NLG system.
Plan of the paper. The paper is structured as fol-lows. In Section 2, we describe and motivate the GIVE-2 Challenge. In section 3, we describe the evaluation method and infrastructure. Section 4 reports on the evaluation results. Finally, we con-clude and discuss future work in Section 5. 2 The GIVE Challenge
GIVE-2 is the second installment of the GIVE Challenge (“Generating Instructions in Virtual En-vironments”), which we ran for the first time in 2008-09. In the GIVE scenario, subjects try to solve a treasure hunt in a virtual 3D world that they have not seen before. The computer has a com-plete symbolic representation of the virtual world. The challenge for the NLG system is to gener-ate, in real time, natural-language instructions that will guide the users to the successful completion of their task.
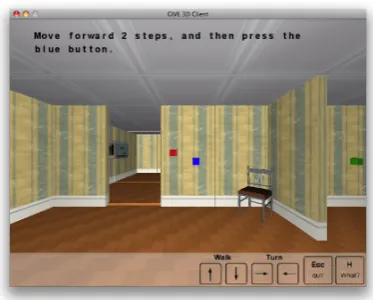
Figure 1: What the user sees when playing with the GIVE Challenge.
game window as in Fig. 1, which displays instruc-tions and allows them to move around in the world and manipulate objects. The first room is a tuto-rial room where users learn how to interact with the system; they then enter one of three evaluation worlds, where instructions for solving the treasure hunt are generated by an NLG system. Users can either finish a game successfully, lose it by trig-gering an alarm, or cancel the game. This result is stored in a database for later analysis, along with a complete log of the game.
In each game world we used in GIVE-2, players must pick up a trophy, which is in a wall safe be-hind a picture. In order to access the trophy, they must first push a button to move the picture to the side, and then push another sequence of buttons to open the safe. One floor tile is alarmed, and play-ers lose the game if they step on this tile without deactivating the alarm first. There are also a num-ber of distractor buttons which either do nothing when pressed or set off an alarm. These distractor buttons are intended to make the game harder and, more importantly, to require appropriate reference to objects in the game world. Finally, game worlds contained a number of objects such as chairs and flowers that did not bear on the task, but were available for use as landmarks in spatial descrip-tions generated by the NLG systems.
The crucial difference between this task and the (very similar) 1 task was that in GIVE-2, players could move and turn freely in the vir-tual world. This is in contrast to GIVE-1, where players could only turn by 90 degree increments, and jump forward and backward by discrete steps. This feature of the way the game controls were set
up made it possible for some systems to do very well in GIVE-1 with only minimal intelligence, using exclusively instructions such as “turn right” and “move three steps forward”. Such instructions are unrealistic – they could not be carried over to instruction-giving in the real world –, and our aim was to make GIVE harder for systems that relied on them.
3 Method
Following the approach from the GIVE-1 Chal-lenge (Koller et al., 2010), we connected the NLG systems to users over the Internet. In each game run, one user and one NLG system were paired up, with the system trying to guide the user to success in a specific game world.
3.1 Software infrastructure
We adapted the GIVE-1 software to the GIVE-2 setting. The GIVE software infrastructure (Koller et al., 2009a) consists of three different mod-ules: Theclient, which is the program which the user runs on their machine to interact with the virtual world (see Fig. 1); a collection of NLG servers, which generate instructions in real-time and send them to the client; and a matchmaker, which chooses a random NLG server and virtual world for each incoming connection from a client and stores the game results in a database.
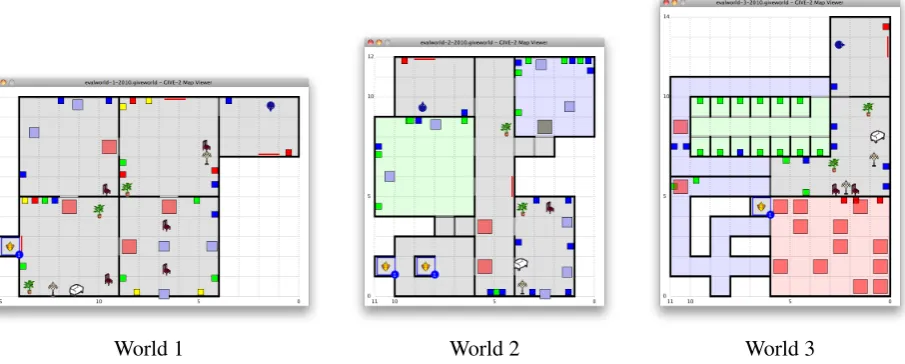
The most visible change compared to GIVE-1 was to modify the client so it permitted free move-ment in the virtual world. This change further ne-cessitated a number of modifications to the inter-nal representation of the world. To support the de-velopment of virtual worlds for GIVE, we changed the file format for world descriptions to be much more readable, and provided an automatic tool for displaying virtual worlds graphically (see the screenshots in Fig. 2).
3.2 Recruiting subjects
laboratory-World 1 World 2 World 3
Figure 2: The three GIVE-2 evaluation worlds.
based experiment (Koller et al., 2009b).
We also tried to leverage social networks for re-cruiting participants by implementing and adver-tising a Facebook application. Because of a soft-ware bug, only about 50 participants could be re-cruited in this way. Thus tapping the true poten-tial of social networks for recruiting participants remains a task for the next installment of GIVE.
3.3 Evaluation worlds
Fig. 2 shows the three virtual worlds we used in the GIVE-2 evaluation. Overall, the worlds were more difficult than the worlds used in GIVE-1, where some NLG-systems had success rates around 80% in some of the worlds. As for GIVE-1, the three worlds were designed to pose different challenges to the NLG systems. World 1 was intended to be more similar to the development world and last year’s worlds. It did have rooms with more than one button of the same color, however, these but-tons were not located close together. World 2 con-tained several situations which required more so-phisticated referring expressions, such as rooms with several buttons of the same color (some of them close together) and a grid of buttons. Fi-nally, World 3 was designed to exercise the sys-tems’ navigation instructions: one room contained a “maze” of alarm tiles, and another room two long rows of buttons hidden in “booths” so that they were not all visible at the same time.
3.4 Timeline
After the GIVE-2 Challenge was publicized in June 2009, fifteen researchers and research teams declared their interest in participating. We
dis-tributed a first version of the software to these teams in August 2009. In the end, six teams sub-mitted NLG systems (two more than in GIVE-1); one team submitted two independent NLG sys-tems, bringing the total number of NLG systems up to seven (two more than in GIVE-1). These were connected to a central matchmaker that ran for a bit under three months, from 23 February to 17 May 2010.
3.5 NLG systems
Seven NLG systems were evaluated in GIVE-2:
• one system from the Dublin Institute of Tech-nology (“D” in the discussion below); • one system from Trinity College Dublin
(“T”);
• one system from the Universidad Com-plutense de Madrid (“M”);
• one system from the University of Heidelberg (“H”);
• one system from Saarland University (“S”); • and two systems from INRIA Grand-Est in
Nancy (“NA” and “NM”).
Detailed descriptions of these systems as well as each team’s own analysis of the evalua-tion results can be found at http://www. give-challenge.org/research.
4 Results
the logs of the interactions; whereas the data for the subjective measures are obtained from a ques-tionnaire which asked subjects to rate various as-pects of the NLG system they interacted with.
Notice that some of our evaluation measures are in tension with each other: For instance, a sys-tem which gives very low-level instructions may allow the user to complete the task more quickly (there is less chance of user errors), but it will re-quire more instructions than a system that aggre-gates these. This is intentional, and emphasizes our desire to make GIVE a friendly comparative challenge rather than a competition with a clear winner.
4.1 Demographics
Over the course of three months, we collected 1825 valid games. This is an increase of almost 60% over the number of valid games we collected in GIVE-1. A game counted as valid if the game client did not crash, the game was not marked as a test game by the developers, and the player com-pleted the tutorial.
Of these games, 79.0% were played by males and 9.6% by females; a further 11.4% did not specify their gender. These numbers are compa-rable to GIVE-1. About 42% of users connected from an IP address in Germany; 12% from the US, 8% from France, 6% from Great Britain, and the rest from 35 further countries. About 91% of the participants who answered the question self-rated their English language proficiency as “good” or better. About 65% of users connected from vari-ous versions of Windows, the rest were split about evenly between Linux and MacOS.
4.2 Objective measures
The objective measures are summarize in Fig. 3. In addition to calculating the percentage of games users completed successfully when being guided by the different systems, we measured the time until task completion, the distance traveled until task completion, and the number of actions (such as pushing a button to open a door) executed. Fur-thermore, we counted how many instructions users received from each system, and how many words these instructions contained on average. All objec-tive measures were collected completely unobtru-sively, without requiring any action on the user’s part. To ensure comparability, we only counted successfully completed games.
task success: Did the player get the trophy? duration: Time in seconds from the end of the
tu-torial until the retrieval of the trophy.
distance: Distance traveled (measured in distance units of the virtual environment).
actions: Number of object manipulation actions. instructions: Number of instructions produced
by the NLG system.
words per instruction: Average number of words the NLG system used per instruction.
Figure 3: Objective measures.
Fig. 4 shows the results of these objective mea-sures. Task success is reported as the percent-age of successfully completed games. The other measures are reported as the mean number of sec-onds/distance units/actions/instructions/words per instruction, respectively. The figure also assigns systems to groups A, B, etc. for each evaluation measure. For example, users interacting with sys-tems in group A had a higher task success rate, needed less time, etc. than users interacting with systems in group B. If two systems do not share the same letter, the difference between these two systems is significant with p<0.05. Significance was tested using a χ2-test for task success and ANOVAs for the other objective measures. These were followed by post-hoc tests (pairwiseχ2 and Tukey) to compare the NLG systems pairwise.
In terms of task success, the systems fall pretty neatly into four groups. Note that systems D and T had very low task success rates. That means that, for these systems, the results for the other ob-jective measures may not be reliable because they are based on just a handful of games. Another aspect in which systems clearly differed is how many words they used per instruction. Interest-ingly, the three systems with the best task success rates also produced the most succinct instructions. The distinctions between systems in terms of the other measures is less clear.
4.3 Subjective measures
D H M NA NM S T
task success
9% 11% 13% 47% 30% 40% 3%
A A
B
C C C
D D
duration
888 470 407 344 435 467 266
A A A A A
B B B B B
C
distance 231 164 126 162 167 150 89A A A A A A
B B B B B
actions 25 22 17 17 18 17 14A A A A A A A
instructions 349 209 463 224 244 244 78A A A A A A
B B
words per instruction
15 11 16 6 10 6 18
A A
B C
D
[image:5.595.313.521.62.227.2]E E
Figure 4: Results for theobjectivemeasures.
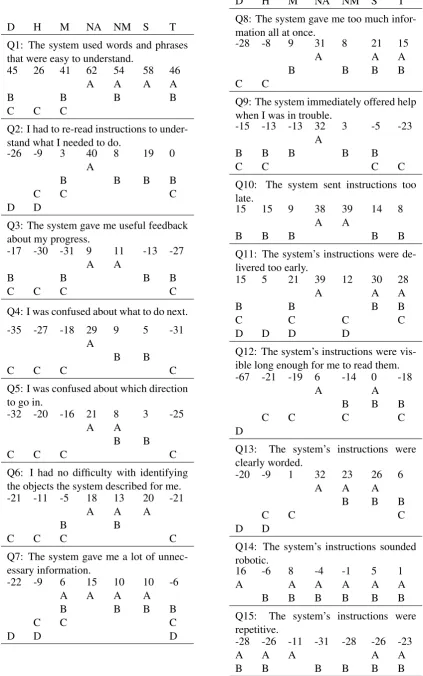
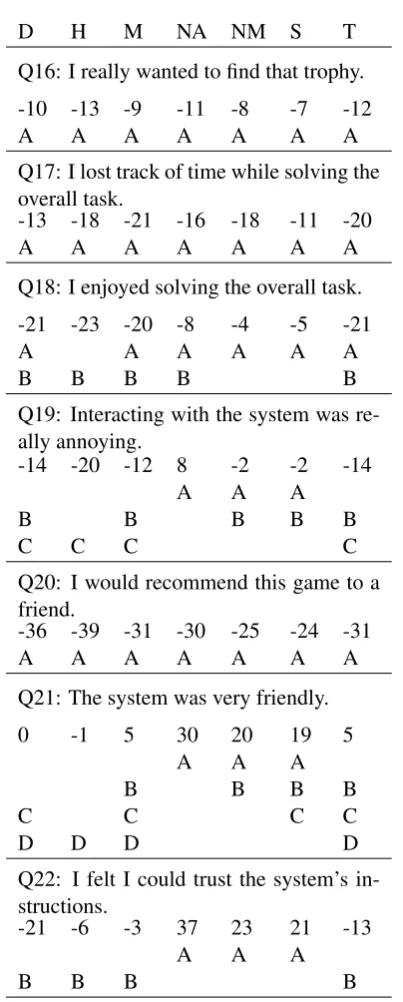
system using a continuous slider. The slider posi-tion was translated to a number between -100 and 100. Figs. 7 and 6 show the statements that users were asked to rate as well as the results. These results are based on all games, independent of the success. We report the mean rating for each item, and, as before, systems that do not share a letter, were found to be significantly different (p<0.05). We used ANOVAs and post-hoc Tukey tests to test for significance. Note that some items make a pos-itive statement about the NLG system (e.g., Q1) and some make a negative statement (e.g., Q2). For negative statements, we report the reversed scores, so that in Figs. 7 and 6 greater numbers are always better, and systems in group A are always better than systems in group B.
In addition to the items Q1–Q22, the ques-tionnaire contained a statement about the over-all instruction quality: “Overover-all, the system gave me good directions.” Furthermore notice that the other items fall into two categories: items that as-sess the quality of the instructions (Q1–Q15) and items that assess the emotional affect of the in-teraction (Q16–Q22). The ratings in these
cate-D H M NA NM S T
overall quality question
-33 -18 -12 36 18 19 -25 A
B B
C C C C
quality measures (summed)
-183 -148 -18 373 239 206 -44
A A A
B B B B
emotional affect measures (summed)
-130 -103 -90 20 -5 0 -88
A A A A
B B B B B
[image:5.595.73.293.63.389.2]C C C C C
Figure 5: Results for item assessing overall in-struction quality and the aggregated quality and emotional affect measures.
gories can be aggregated into just two ratings by summing over them. Fig. 5 shows the results for the overall question and the aggregated ratings for quality measures and emotional affect measures. The three systems with the highest task success rate get rated highest for overall instruction qual-ity. The aggregated quality measure also singles out the same group of three systems.
4.4 Further analysis
In addition to the differences between NLG sys-tems, some other factors also influence the out-comes of our objective and subjective measures. As in GIVE-1, we find that there is a significant difference in task success rate for different evalua-tion worlds and between users with different levels of English proficiency. Fig. 8 illustrates the effect of the different evaluation worlds on the task suc-cess rate for different systems, and Fig. 9 shows the effect that a player’s English skills have on the task success rate. As in GIVE-1, some systems seem to be more robust than others with respect to changes in these factors.
D H M NA NM S T Q1: The system used words and phrases that were easy to understand.
45 26 41 62 54 58 46
A A A A
B B B B
C C C
Q2: I had to re-read instructions to under-stand what I needed to do.
-26 -9 3 40 8 19 0 A
B B B B
C C C
D D
Q3: The system gave me useful feedback about my progress.
-17 -30 -31 9 11 -13 -27
A A
B B B B
C C C C
Q4: I was confused about what to do next. -35 -27 -18 29 9 5 -31
A
B B
C C C C
Q5: I was confused about which direction to go in.
-32 -20 -16 21 8 3 -25
A A
B B
C C C C
Q6: I had no difficulty with identifying the objects the system described for me. -21 -11 -5 18 13 20 -21
A A A
B B
C C C C
Q7: The system gave me a lot of unnec-essary information.
-22 -9 6 15 10 10 -6
A A A A
B B B B
C C C
D D D
D H M NA NM S T
Q8: The system gave me too much infor-mation all at once.
-28 -8 9 31 8 21 15
A A A
B B B B
C C
Q9: The system immediately offered help when I was in trouble.
-15 -13 -13 32 3 -5 -23 A
B B B B B
C C C C
Q10: The system sent instructions too late.
15 15 9 38 39 14 8
A A
B B B B B
Q11: The system’s instructions were de-livered too early.
15 5 21 39 12 30 28
A A A
B B B B
C C C C
D D D D
Q12: The system’s instructions were vis-ible long enough for me to read them. -67 -21 -19 6 -14 0 -18
A A
B B B
C C C C
D
Q13: The system’s instructions were clearly worded.
-20 -9 1 32 23 26 6
A A A
B B B
C C C
D D
Q14: The system’s instructions sounded robotic.
16 -6 8 -4 -1 5 1
A A A A A A
B B B B B B
Q15: The system’s instructions were repetitive.
-28 -26 -11 -31 -28 -26 -23
A A A A A
[image:6.595.71.495.68.745.2]B B B B B B
D H M NA NM S T Q16: I really wanted to find that trophy.
-10 -13 -9 -11 -8 -7 -12
A A A A A A A
Q17: I lost track of time while solving the overall task.
-13 -18 -21 -16 -18 -11 -20
A A A A A A A
Q18: I enjoyed solving the overall task.
-21 -23 -20 -8 -4 -5 -21
A A A A A A
B B B B B
Q19: Interacting with the system was re-ally annoying.
-14 -20 -12 8 -2 -2 -14
A A A
B B B B B
C C C C
Q20: I would recommend this game to a friend.
-36 -39 -31 -30 -25 -24 -31
A A A A A A A
Q21: The system was very friendly.
0 -1 5 30 20 19 5
A A A
B B B B
C C C C
D D D D
Q22: I felt I could trust the system’s in-structions.
-21 -6 -3 37 23 21 -13
A A A
[image:7.595.314.514.61.241.2]B B B B
[image:7.595.69.271.141.643.2]Figure 6: Results for thesubjective measures as-sessing theemotional affectof the instructions.
[image:7.595.312.515.282.466.2]Figure 8: Effect of the evaluation worlds on the success rate of the NLG systems.
Figure 9: Effect of the players’ English skills on the success rate of the NLG systems.
a significant effect of gender on the time players need to retrieve the trophy as in GIVE-1 (although the mean duration is somewhat higher for female than for male players; 481 vs. 438 seconds).
5 Conclusion
In this paper, we have described the setup and re-sults of the Second GIVE Challenge. Altogether, we collected 1825 valid games for seven NLG sys-tems over a period of three months. Given that this is a 50% increase over GIVE-1, we feel that this further justifies our basic experimental methodol-ogy. As we are writing this, we are preparing de-tailed results and analyses for each participating team, which we hope will help them understand and improve the performance of their systems.
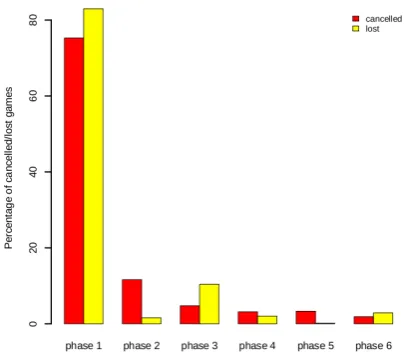
Figure 10: Points at which players lose/cancel.
harder task (free movement) explained in Sec-tion 2 and to the more complex evaluaSec-tion worlds (see Section 3.3). It was our intention to make GIVE-2 more difficult, although we did not antic-ipate such a dramatic drop in performance. GIVE-2.5 next year will use the same task as GIVE-2 and we hope to see an increase in task success as the participating research teams learn from this year’s results.
It is also noticeable that players gave mostly negative ratings in response to statements about immersion and engagement (Q16-Q20). We dis-cussed last year how to make the task more engag-ing on the one hand and how to manage expecta-tions on the other hand, but none of the suggested solutions ended up being implemented. It seems that we need to revisit this issue.
Another indication that the task may not be able to capture participants is that the vast majority of cancelled and lost games end in the very begin-ning. To analyze at what point players lose or give up, we divide the game into phases demarcated by manipulations of buttons that belong to the 6-button safe sequence. Fig. 10 illustrates in which phase of the game players lose or cancel.
We are currently preparing the GIVE-2.5 Chal-lenge, which will take place in 2010-11. GIVE-2.5 will be very similar to GIVE-2, so that GIVE-2 systems will be able to participate with only mi-nor changes. In order to support the development of GIVE-2.5 systems, we have collected a multi-lingual corpus of written English and German in-structions in the GIVE-2 environment (Gargett et al., 2010). We expect that GIVE-3 will then extend the GIVE task substantially, perhaps in the direc-tion of full dialogue or of multimodal interacdirec-tion.
Acknowledgments. GIVE-2 was only possible through the support and hard work of a number of colleagues, especially Konstantina Garoufi (who handled the website and other publicity-related is-sues), Ielka van der Sluis (who contributed to the design of the GIVE-2 questionnaire), and several student assistants who programmed parts of the GIVE-2 system. We thank the press offices of Saarland University, the University of Edinburgh, and Macquarie University for their helpful press releases. We also thank the organizers of Gener-ation Challenges 2010 and INLG 2010 for their support and the opportunity to present our results, and the seven participating research teams for their contributions.
References
Andrew Gargett, Konstantina Garoufi, Alexander Koller, and Kristina Striegnitz. 2010. The GIVE-2 corpus of giving instructions in virtual environ-ments. In Proceedings of the 7th International Conference on Language Resources and Evaluation (LREC), Malta.
S. D. Gosling, S. Vazire, S. Srivastava, and O. P. John. 2004. Should we trust Web-based studies? A com-parative analysis of six preconceptions about Inter-net questionnaires. American Psychologist, 59:93– 104.
A. Koller, D. Byron, J. Cassell, R. Dale, J. Moore, J. Oberlander, and K. Striegnitz. 2009a. The soft-ware architecture for the first challenge on generat-ing instructions in virtual environments. In Proceed-ings of the EACL-09 Demo Session.
Alexander Koller, Kristina Striegnitz, Donna Byron, Justine Cassell, Robert Dale, Sara Dalzel-Job, Jo-hanna Moore, and Jon Oberlander. 2009b. Validat-ing the web-based evaluation of NLG systems. In
Proceedings of ACL-IJCNLP 2009 (Short Papers), Singapore.