ISSN Online: 2161-7198 ISSN Print: 2161-718X
DOI: 10.4236/ojs.2017.74052 Aug. 31, 2017 743 Open Journal of Statistics
Simulated Minimum Hellinger Distance
Estimation for Some Continuous Financial
and Actuarial Models
Andrew Luong
*, Claire Bilodeau
École d’actuariat, Université Laval, Québec, Canada
Abstract
Minimum Hellinger distance (MHD) estimation is extended to a simulated version with the model density function replaced by a density estimate based on a random sample drawn from the model distribution. The method does not require a closed-form expression for the density function and appears to be suitable for models lacking a closed-form expression for the density, models for which likelihood methods might be difficult to implement. Even though on-ly consistency is shown in this paper and the asymptotic distribution remains an open question, our simulation study suggests that the methods have the potential to generate simulated minimum Hellinger distance (SMHD) esti-mators with high efficiencies. The method can be used as an alternative to methods based on moments, methods based on empirical characteristic func-tions, or the use of an expectation-maximization (EM) algorithm.
Keywords
Infinitely Divisible Distribution, Mixture Distribution, Hellinger Distance, Robustness
1. Introduction
In actuarial science or finance, we often encounter the problem of fitting distri-butions to data where the distridistri-butions have no closed-form expressions for their densities. These distributions are often infinitely divisible and they happen to be the distributions of the regularly spaced increments of Lévy processes. Beside in-finitely divisible distributions, mixture distributions created using a mixing me-chanism also provide examples of continuous densities without a closed-form expression. These types of distributions are often encountered in actuarial How to cite this paper: Luong, A. and
Bilodeau, C. (2017) Simulated Minimum Hellinger Distance Estimation for Some Continuous Financial and Actuarial Mod-els. Open Journal of Statistics, 7, 743-759.
https://doi.org/10.4236/ojs.2017.74052
Received: August 8, 2017 Accepted: August 28, 2017 Published: August 31, 2017
Copyright © 2017 by authors and Scientific Research Publishing Inc. This work is licensed under the Creative Commons Attribution International License (CC BY 4.0).
DOI: 10.4236/ojs.2017.74052 744 Open Journal of Statistics science. A few examples will be provided as illustrations subsequently.
Likelihood methods might be difficult to implement in such cases, due to the lack of a closed-form expression for the density function. To handle such a situ-ation, we can consider the following approaches:
1) Expectation-maximization (EM) algorithm. Only under special conditions can the EM algorithm be used as it requires some conditional distributions, and these conditional distributions might be difficult to obtain; see McNeil, Frey and Embrechts [1] (pages 81-85) or McLachlan and Krishnan [2].
2) Method of moments. Even though the model density has no closed form, if the model moments can be expressed in closed form, then the method of mo-ments can be used. The main drawback of the method of momo-ments is that esti-mators thus obtained might not be efficient nor robust for models with three or more parameters as the estimators will depend on a polynomial of degree three or higher, making the methods very sensitive to data which are contaminated; see Küchler and Tappe [3] [4] for method of moments estimation.
3) The k-L procedure. Even if the density has no closed form, if the model characteristic function has a closed-form expression, then we can select points from the real and imaginary parts of the empirical characteristic function and match them with their model counterparts at the chosen points. This is the k-L procedure as proposed by Feuerverger and McDunnough [5] (pages 22-24).
4) Indirect inference. These methods are based on simulations and they re-quire two steps. First, we need to choose a proxy model to obtain the estimators which are biased. Second, we remove the bias using simulations. See Garcia, Re-nault and Veredas [6] for this method. The proxy models from which the esti-mators are obtained affect the efficiencies of the estiesti-mators. For some models, it is difficult to know which proxy model will generate estimators with high effi-ciencies.
When implementing these methods for distributions without closed-form densities, there are some drawbacks which motivate us in this paper to extend minimum Hellinger distance methods originally proposed by Beran [7] to a simulated version (version S) which consists in replacing the model density
( )
f xθ by a density estimate f xθS
( )
using a random sample drawn from f xθ( )
and minimizing( )
( )
12 S( )
12 2dn n
Q = −∞∞f x −f x x
∫
θθ
(1) to obtain the simulated minimum Hellinger distance (SMHD) estimators, where
( )
nf x
is an empirical density estimate based on the observed data with the property( )
p 0( )
n
f x →fθ x where θ0 is the true vector of parameters. This
consistency property will imply
( )
0( )
2 1 1
2
2 d p 0
n
f x f x x
∞ −∞
− →
∫
θ asn→ ∞; see section 3 (page 224) of Tamura and Boos [8].
DOI: 10.4236/ojs.2017.74052 745 Open Journal of Statistics in the choice of points for the k-L procedure based on characteristic functions. Unlike indirect inference, the proposed method does not need a proxy model. Furthermore, the estimators obtained using the proposed method might be more robust and efficient than method of moments estimators. Besides, the proposed method does not require conditioning, which can be difficult, whereas the EM algorithm does.
It appears that the proposed method, which originally combines simulation with Hellinger distance, adds to the set of statistical techniques that can be useful for financial and actuarial data, yet many of which do not receive much atten-tion in the actuarial literature. SMHD methods depend on being able to draw samples from the parametric family; in general, this is indeed possible. Conse-quently, SMHD methods also add to the existing literature on simulated infer-ence which is relatively new; see comments by Davidson and MacKinnon [9]
(page 393).
The new method is built on the classical version (version D) of Hellinger dis-tance as proposed by Beran [7] which consists in minimizing
( )
( )
12( )
12 2dn n
Q = −∞∞ f x −f x x
∫
θθ
(2) to obtain the minimum Hellinger distance (MHD) estimators. The MHD esti-mators have been known to have nice robustness properties with breakdown point greater than 0. Also, they are consistent with, in general, less stringent conditions for consistency than maximum likelihood (ML) estimators. However, more restrictions are placed upon the underlying parametric family for the MHD estimators to attain full efficiency, such assuming
f x
θ( )
having acom-pact support for example. Despite this drawback, simulation studies often show that the methods perform well across many models. For a literature review of Hellinger distance (HD) methods, see chapters 3 and 10 of the book by Basu, Shioya and Park [10]. From the literature, it can be seen that HD methods still do not receive proper attention for their use in actuarial science and finance, es-pecially in actuarial science.
In this paper, we introduce a simulated version of HD methods and show that the SMHD estimators are consistent. However, the question of asymptotic nor-mality is still not resolved for the time being. Further work should generate re-sults on asymptotic distributions for the SMHD estimators that shall then be presented in a subsequent paper. In this paper, the methods are presented with fewer technicalities and we relate them with the traditional likelihood methods. In doing so, we wish to encourage practitioners to use these methods for their applied works in their fields. In the next paragraphs, we will consider a few ex-amples for illustrations of the types of distributions without closed-form expres-sions often encountered in finance and actuarial science where the new simu-lated method can be particularly useful.
Example 1
DOI: 10.4236/ojs.2017.74052 746 Open Journal of Statistics where the random variable X can be represented using equality in distribution as
d
X = θ µ+ W+σ W Z ,
(3)
where
1)
θ
,µ
and σ are parameters with −∞ < < ∞θ
, −∞ < < ∞µ
, and 0σ
> ;2) W is a nonnegative random variable with an infinitely divisible (ID) dis-tribution;
3) Z follows a standard normal distribution N
( )
0,1 and is independent ofW .
The generalized hyperbolic, variance-gamma, and normal-inverse Gaussian distributions belong to this class; see McNeil, Frey and Embrechts [1] (pages 77-79). By conditioning on W first, the moment generating function (mgf) for
X can be obtained and given by
( )
e 1 2 22 s
X W
M s = θ M µs+ σ s
, where the
moment generating functions of X and W are given respectively by
( )
X
M s and MW
( )
s . Distributions of the increments observed at regularin-tervals of a subordinated Brownian motion process belong to this class. It can easily be seen that the density function of X depends on the density function of W . Consequently, the density function of X might not have a closed-form expression in general. Closely related to the variance-gamma distribution is the generalized normal-Laplace (GNL) distribution which is introduced by Reed
[11] and is given in the next example. Example 2
A random variable X follows a GNL distribution if it can be represented as
1 2
1 1
d
X ρµ σ ρZ G G
α β
= + + − , (4)
where
1) the parameters are
µ
, σ,ρ
, α andβ
, with −∞ < < ∞µ
,σ
>0,0
ρ >
,α
>0, andβ >
0
;2) the random variables G1 and G2 are independent and follow a common gamma distribution with density function g x
(
;ρ)
( )
1 xρ1e ,x x 0,ρ 0ρ − −
= > >
Γ ;
3) Z follows a standard normal distribution,
N
( )
0,1
, with Z being inde-pendent of G1 and G2.The distribution is infinitely divisible and can display asymmetry and fatter tail than the normal distribution. It will be symmetric if α β= . The vector of parameters is θ=
(
µ σ ρ α β ′, , , ,)
and the mgf for X can be obtained using the representation given by Equation (4) and is given by( )
e s 12 2 2sX
M s
s s
ρ ρ
ρ µ σ
α
β
α
β
+
=
− +
. (5)
re-DOI: 10.4236/ojs.2017.74052 747 Open Journal of Statistics spectively by
( )
1 1E X ρ µ
α β
= + −
(6) and
( )
22 2
1 1
V X ρ σ
α β
= + +
. (7)
Higher cumulants are
(
1 !)
1( )
1r 1r r r r
κ ρ
α β
= − + −
for r>2.
(8)
Due to the lack of a closed-form expression for the density function, Reed [11]
(page 477) has proposed using the method of moments and matching the em-pirical cumulants with the model cumulants to estimate the parameters. He ap-plied the method to data collected on stocks. In the particular case with four pa-rameters, where α β= , moment estimators can be obtained explicitly. How-ever, for the general case with five parameters, the moment equations must be solved numerically. The moment estimators will be discussed in more detail in section 3 and we shall compare their efficiencies with the efficiencies of the SMHD estimators based on simulated samples.
For more on Lévy processes and infinitely divisible distributions used in fi-nance, see chapter 6 of the book by Schoutens [12] (pages 73-83). For nonnega-tive infinitely divisible distributions used in actuarial science, see Dufresne and Gerber [13], and Luong [14]. For mixtures of distributions without closed-form density functions, for which the proposed estimators can also be used, see Klugman, Panjer and Willmot [15] (pages 62-65). We shall consider HD estima-tion in all those cases.
Assume that we have a random sample of observations X1, , Xn and they are independent and identically distributed as the random variable X which is continuous with model density given by
f x
θ( )
. The vector of parameters isdenoted by θ=
(
θ1, ,θ ′m)
. In his seminal paper, Beran [7] proposes to esti-mateθ
by the minimum Hellinger distance estimators denoted by θˆ which minimize, with respect toθ
, the Hellinger distance between a consistent em-pirical density estimate fn and the parametric family fθ with the property( )
p 0( )
n
f x →fθ x pointwise. It leads to minimize the objective function
( )
( )
12( )
12 2dn n
Q = −∞∞ f x −f x x
∫
θθ
. (9)Beran [7] also noted that, intuitively, the methods are robust as data are smoothed by a kernel density estimator fn, and hence the effects of outliers are mitigated. It has been confirmed in various models that the asymptotic break- down points of the estimators are around 1
2 and it is well-known that the sam-
DOI: 10.4236/ojs.2017.74052 748 Open Journal of Statistics 594-595), and Maronna, Martin and Yohai [17] (page 58) for the notions of fi-nite sample and asymptotic breakdown points as measures of robustness of es-timators. See Lindsay [18] for the discussions on robustness and efficiencies of MHD estimators. We also note that, since
( )
2 2( )
12( )
12dn n
Q θ = −
∫
−∞∞ f x f xθ x(10) and, using the Cauchy-Schwarz inequality, ∞ f xn
( )
12 f x( )
12dx 1−∞ ≤
∫
θ , we find( )
0
≤
Q
nθ
≤
2
.(11)
Moreover, since ∞ f xn
( )
12 f x( )
12dx 1−∞ =
∫
θ if and only iff x
n( )
=
f x
θ( )
almost everywhere, it implies
Q
n( )
θ
=
0
if and only iff x
n( )
=
f x
θ( )
almosteverywhere.
The objective function is stable and bounded. This might explain why, intui-tively, minimizing such an objective function, we obtain estimators that are also stable and therefore robust in some sense.
Kernel density estimators are often used to define
f x
n( )
. One of the simplest ker-nel density estimators is the rectangular kerker-nel density estimator which generalizes the usual histogram estimator. In general, kernel density estimators have the form( )
1 n1 in i
n n
x x f x
nh =
ω
h −
=
∑
, (12)where
a) hn is the bandwidth with the property that hn →0 and nhn →∞ as
n→ ∞;
b)
ω
( )
x
is a density function.The property specified by a) guarantees the consistency of
f x
n( )
; see Corol-lary 6.4.1 given by Lehmann [19] (pages 406-408). Subsequently, we implicitly assume that density estimates used with the SMHD method meet the require-ments specified by a) and b).For the rectangular kernel density, the following symmetric density around 0 is chosen with
( )
12
x
ω = for − < <1 x 1. The kernel
ω
( )
x
has a compactsupport. The density estimate at x is then the average of rectangles located within hn units from x. For other kernels and their implementation using the package R, see chapter 10 of the book by Rizzo [20] (pages 281-318). For Hellin-ger distance estimation, it is preferable to use a symmetric kernel with a compact support and twice differentiable for meeting the regularity conditions of Theo-rem 4 as given by Beran [7] (pages 450-451); also see the discussions by Basu, Shioya and Park [10] (pages 78-83). In this paper, we only need univariate kernel density estimates but multivariate density estimates based on kernels can also be defined similarly; see Toma [21] and Scott [22].
If
f x
θ( )
has no closed-form expression but random samples can be drawnDOI: 10.4236/ojs.2017.74052 749 Open Journal of Statistics kernel density estimator, used to define
f x
n( )
, to estimate f xθ0( )
. In other words, in order to estimatef x
θ( )
, we similarly define f xθS( )
as being the kernel density estimator based on a random sample of size U=τ
n. Note that U → ∞ as n→ ∞ and τ needs to be reasonably large so that there is little loss of efficiencies due to simulations; we recommendτ
≥10.Consequently, for the simulated version, we shall minimize the objective function given by
( )
( )
12 S( )
12 2dn n
Q = −∞∞f x −f x x
∫
θθ
(13) to obtain the SMHD estimators.
For terminology, we shall call the classical version, which is deterministic in terms of
f x
θ( )
, version D, and the simulated version, version S. SinceQ
n( )
θ
, as given by Equation (13), is not differentiable, a direct simplex search method which is derivative-free is recommended. The R package already has a built-in function for performing the Nelder-Mead simplex method which is a deriva-tive-free method to minimize a function. Also, there is a built-in function to handle density estimates using various kernels. These features will facilitate the implementation of SMHD methods for applied works by practitioners. Fur-thermore, because the densitiesf x
n( )
and f xθS( )
based on a rectangular or triangular kernel are positive only in some finite interval and zero elsewhere, this makes the integration for evaluating Equation (13) easy to handle. A trapezoid quadrature method will suffice to find the SMHD estimators. Note that for the simulated version, we still have( )
0
≤
Q
nθ
≤
2
.(14)
As data are also smoothed, intuitively, these features will again make the simulated version robust.
The paper is organized as follows. In Section 2, we will look into the asymp-totic properties of MHD estimators. More precisely, we shall briefly review the asymptotic properties of the classical MHD estimators in Section 2.1 and estab-lish the consistency of SMHD estimators in Section 2.2. Also in Section 2.2, an estimator for the Fisher information matrix is proposed with the use of SMHD estimators. In Section 3, we use a limited simulation study to compare the effi-ciencies of the SMHD estimators with those of method of moments estimators, using the GNL distribution. Despite being limited, the study seems to show that the SMHD estimators are more efficient than the method of moments estimators. This seems to point to the potential of SMHD methods to generate estimators with good efficiency and further justify their use in actuarial science and finance.
2. Asymptotic Properties
2.1. Asymptotic Properties of the Classical MHD Estimators
DOI: 10.4236/ojs.2017.74052 750 Open Journal of Statistics maximum likelihood estimators to be consistent. Since we aim for applications, we only consider asymptotic properties under the strict parametric model, i.e., assuming the observations come from the parametric density family
f x
θ( )
,where
θ
∈Ω, and the parameter space Ω is assumed to be compact.Let
( ) ( )
( )
( )
1 2 2
1 1
1 1
2 2
2 2
1 2 1 2 d
f − f = −∞∞f x −f x x
∫
,(15)
where
f x
1( )
andf x
2( )
are density functions. Note that ⋅ is a norm in the density functional space and it will respect the triangular inequality.Tamura and Boos [8] (page 224) have noted that, if
( )
p 0( )
n
f x →fθ x , then
( )
fn 12−( )
fθ0 12 →p 0, and if( ) ( )
fn 12− fθ 12 >0 for θ θ≠ 0 in probability,it is sufficient for the MHD estimators given by the vector θˆ obtained by minimizing Equation (10) to be consistent, i.e.,
θ
ˆ
→
pθ
0, assuming the pa-rameter space Ω is compact. See Theorem 3.1 by Tamura and Boos [8] (page224). Comparing with the regularity conditions for ML estimators as given by Theorem 2.5 of Newey and McFadden [23] (page 2131), the regularity condi-tions for MHD estimation do not require that E
(
sup logθ f xθ( )
)
< ∞ as in likelihood estimation. This makes the MHD estimators consistent in general even with fewer restrictions than ML estimators.However, for asymptotic normality, they require more stringent conditions to be as efficient as ML estimators. They are found in Theorem 4 given by Beran
[7] (pages 450-451), which is summarized in Theorem 1 below, focusing on the strict parametric model. Beran [7] (pages 450-451) allows the bandwidth of the kernel to be randomly chosen with hn =c sn n, where cn is a sequence of con-stants but sn is a sequence of random variable with
s
n→
ps
. It also requires a compact support K for both ∂log∂f xθ( )
θ and
f x
θ( )
. Despite these restric- tions, empirical studies often show that the estimators have high efficiencies in many models without the condition of compact support for the parametric fam-ily met. The regularity conditions of Beran’s Theorem 4 when restricted to the strict parametric model are stated using Theorem 1 below. We also require the vector of true parameters θ0 to be in Ω, where Ω is compact. Theorem 1 can be viewed as a corollary of Theorem 4 as given by Beran [7] and the proofs have been given there.Theorem 1 Suppose
DOI: 10.4236/ojs.2017.74052 751 Open Journal of Statistics 3) ∂logf x
( )
∂
θ
θ and
f x
θ( )
have a compact support K andf x
θ( )
>
0
on K.4)
f x
θ( )
is twice absolutely continuous with its second derivative withre-spect to x being bounded. 5) lim 12
n→∞n cn = ∞,
1 2 2
limn→∞n cn =0, and limn→∞cn=0.
6) There exists a positive constant s which might depend on f xθ0
( )
such that n s(
n−s)
is bounded in probability.Then n
(
ˆ 0)
L N(
0,I( )
0 1)
− →
−
θ θ θ where
I
( )
θ
0 is the Fisher informa-tion matrix with elements given by( )
( )
2( )
log log log
, 1, , , 1, ,
j i j i
f x f x f x
E E i m j m
θ θ θ θ
∂ ∂ ∂
= − = =
∂ ∂ ∂ ∂
θ θ θ
(16)
and assumed to exist.
We just give an outline establishing the results of Theorem 1 and focus only on the strict parametric model for applications with the aim that it might help practitioners in the applied fields to follow more easily the arguments needed to develop the new method subsequently.
Note that, beside the rectangular kernel, the triangular kernel with
ω
( )
x
= −
1
x
for − ≤ ≤1 x 1 and the Epanechnikov kernel with
( )
3 1(
2)
4
x x
ω = − for
1 x 1
− ≤ ≤ meet conditions 1 and 2 as required by Theorem 1 and are available in the package R.
For establishing asymptotic normality results for the estimators as indicated by Theorem 1, we can consider a Taylor expansion of the system of equations
( )
( )
ˆ
ˆ Qn 0
D
= ∂
= =
∂ θ θ
θ θ
θ around the true vector of parameters θ0. The system of equations implies
( )
( )
( )
( )
( )
ˆ 1 1 2 2 ˆ ˆˆ n d 0
f x
D f x f x x
f x ∞ −∞ ∂ ∂ = − =
∫
θ θ θθ
θ
(17)
with ˆ
( )
( )
ˆf x f x
= ∂ ∂ = ∂ ∂ θ θ θ θ
θ θ and f xθˆ
( )
= f xθ( )
θ θ=ˆ. We proceed to perform a Taylor expansion by noting( )
( )
( )
( )
( )
0 0 0 1 1 2 20 n d
f x
D f x f x x
f x ∞ −∞ ∂ ∂ = −
∫
θ θ θ θθ , (18)
( )
( )
0( )
0( )
( )
( )
0 0
0
log log
1 d 1
2 p
f x f x
D
D −∞∞ f x x o
= ′ ∂ ∂ ∂ = = − + ∂
∫
∂ ∂ θ θ θ θ θ θ θθ θ θ ,(19)
DOI: 10.4236/ojs.2017.74052 752 Open Journal of Statistics
( )
( )
0( )
01 1
2
2 d p 0
n
s x
f x f x x
∞ −∞ ∂ − → ∂
∫
θ θθ , with
( )
( )
( )
0 0 0 f x s x f x ∂ ∂ = θ θ θθ , using
the compact support assumption for
{ }
f
θ . As a result, we can write that( )
0 1 2( )
0 p( )
1D θ = − I θ +o .
(20)
Therefore, with the regularity conditions met, we will have the representation
(
)
( )
1( )
( )
0 0 0
ˆ p 1
n
θ θ
− = −Dθ
− n Dθ
+o ,(21)
where
o
p( )
1
is the remainder term which converges to 0 in probability, which can be re-expressed using the following equality which holds in law,(
)
( )
( )
( )
( )
( )
0 0 0 1 1 1 2 2 0 0ˆ d 2 d
n
f x
n I n f x f x x
f x ∞ − −∞ ∂ ∂ − = −
∫
θ θ θ θ θθ θ . (22)
Using the argument given by Beran [7] (page 451) allows us to establish the equality in probability,
( )
( )
( )
( )
( )
( )
(
)
( )
( )
( )
( )
0 0 0 0 0 0 0 1 1 2 2 d1 d 1
2 n
n
p
f x
n f x f x x
f x f x
f x f x
n x o
f x f x
∞ −∞ ∞ −∞ ∂ ∂ − ∂ − ∂ = +
∫
∫
θ θ θ θ θ θ θ θ θ.
(23)
This can be viewed as a form of generalized delta method to establish equality of the left-hand side and the right-hand side of Equation (23).
Consequently, Equation (22) can be re-expressed, using the equality in distri-bution, as
(
)
( )
(
( )
( )
)
0( )
0
1
0 0
log
ˆ d d
n
f x
n − = I − n −∞∞ f x − f x ∂ x
∂
∫
θθ
θ θ θ
θ . (24)
Note that
( )
( )
(
)
0( )
( )
0( )
0
log log
d d
n n
f x f x
f x f x x f x x
∞ ∞
−∞ −∞
∂ ∂
− =
∂ ∂
∫
θ∫
θθ θ θ
(25) as, in general,
( )
0( )
0
log
d 0
f x
f x x
∞ −∞ ∂ = ∂
∫
θθ θ . Furthermore,
( )
log 0( )
d log 0( )
d( )
( )
1n n p
f x f x
n −∞∞ f x ∂ x= n −∞∞ ∂ F x o+
∂ ∂
∫
θ∫
θθ θ , (26)
where
F x
n( )
is the commonly used sample distribution function. This allows the following representation:(
)
( )
1 0( )
0 0 1
log 1
ˆ d n i
i f x n I n − = ∂ − = ∂
∑
θθ θ θ
DOI: 10.4236/ojs.2017.74052 753 Open Journal of Statistics Therefore, n
(
ˆ 0)
L N(
0,I( )
0 1)
− →
−
θ θ θ .
For the simulated version, i.e., version S, we can only obtain results for con-sistency and they will be given in the next section. As for asymptotic normality, we cannot conclude for the time being whether or not conditions of Theorem 7.1 given by Newey and McFadden [23] (pages 2185-2186) for the asymptotic normality of estimators obtained from a non-smooth function can be met. We hope to have more results on this issue in the future and would present them in a subsequent paper. This does not prevent SMHD estimation from being used as an alternative to methods of moments if the primary interests are in point esti-mation.
2.2. Asymptotic Properties of the SMHD Estimators
For version S, we minimize
( )
( )
12 S( )
12 2dn n
Q = −∞∞f x −f x x
∫
θθ . (28)
We recommend using the same seed across different values of
θ
if possible and the simulated sample size U=τ
n such that U→ ∞ at the same rate asn→ ∞. These recommendations conform with other simulated methods of in-ference such as the method of simulated moments as discussed by Davidson and McKinnon [9] (page 284) or simulated quasi-likelihood found in Smith [24]
(page S68). The condition of the same seed being used is not necessary for con-sistency, but it allows
Q
n( )
θ
to have the value for eachθ
fixed each time we want to evaluateQ
n( )
θ
; otherwise, the values might differ slightly due to the fact that simulations are needed to evaluateQ
n( )
θ
. With the same seed,Q
n( )
θ
behaves like a non-random function with respect toθ
.Let
( )
(
( )
)
12n n
G θ = Q θ , (29)
with
Q
n( )
θ
as defined by Equation (28). The following Theorem, which is es-sentially Theorem (3.1) given by Pakes and Pollard [25] (page 1038) with the assumption of compactness of the parameter space added, can be used to estab-lish the consistency of SMHD estimators. The proofs of the following Theorem have been given by Pakes and Pollard [25] (page 1038) using the Euclidean norm. Their proofs are still valid with the norm as defined by Equation (29) and dis-cussed in Section 2.1. It is implicitly assumed that there is no identification problem for the parametric family, i.e., if θ θ1≠ 2, then f xθ1( )
≠ f xθ2( )
except on a set of measure zero.Theorem 2 Suppose
1) The parameter space Ω is compact, and θ0∈Ω.
2) θˆS minimizes
( )
nG θ or equivalently
Q
n( )
θ
. 3) sup 0 δ Gn( )
1− − >
DOI: 10.4236/ojs.2017.74052 754 Open Journal of Statistics denotes the norm being used.
Then
θ
ˆ
S→
pθ
0.Clearly, we have consistency for θˆS as
0
( )
2
nQ
≤
θ
≤
and( )
p 0n
Q
θ
→only at θ θ= 0.
For the time being, we cannot assert that θˆS follows a multivariate normal distribution asymptotically as we cannot verify the regularity conditions of Theorem 7.1 given by Newey and McFadden [23] (pages 2185-2186) for estima-tors obtained from a non-smooth objective function. For the simulated un-weighted minimum chi-square, Pakes and Pollard [25] (page 1049) find the as- ymptotic covariance to be 1+τ1V
, with V being the asymptotic covariance
matrix of the estimators without using simulations. Conforming with other simulated methods which typically give the same type of asymptotic covariance formula, we recommend choosing
τ
≥10 to minimize the loss of efficiency due to simulations. The matrix 1+τ1V , where
( )
1 0
V I= θ − , can be viewed as a
form of benchmark for the approximate asymptotic covariance matrix for θˆS if indeed asymptotic normality can be shown. In the absence of a rigorous proof, we have to rely on simulations to evaluate the efficiency of θˆS, just as for ver-sion D when the support of the distribution is not compact. Further asymptotic results to be obtained in the future will be presented in a subsequent paper. Since we have estimates for densities, it is natural that we can estimate the Fisher information matrix. Clearly, if the model density has a closed-form ex-pression, then the following matrix
( )
( )
( )
( )
ˆ ˆ
1
ˆ ˆ
1 S S
S S
i i
n i
i i
f x f x
n = f x f x
′
∂ ∂
∂ ∂
∑
θ θ
θ θ
θ θ
(30)
can be used to estimate
I
( )
θ
0 . Instead of fθˆS( )
xi , if it is not available, we can use the kernel density estimate of fθˆS( )
xi , and, following a method given by Pakes and Pollard [25] (page 1043), we can use( )
ˆ( )
ˆ( )
ˆS i S n j i S i
j n
f x f x
f x
θ
+ −
∆
= ∆
e
θ θ
θ , (31)
w i t h n→0 a t t h e r a t e n=o n
( )
−δ , w h e r e 1 2δ≤ , t o e s ti m a t e
( )
ˆS i , 1, , j
f x
j m
θ
∂
=
∂
θ , assuming
( )
ˆS i 0, 1, ,
fθ x > i= n. The vector ej is a unit
vector with 1 in its j-th place and 0 elsewhere. Replacing fθˆS
( )
xi and( )
ˆS i j
f x
θ
∂ ∂
θ
DOI: 10.4236/ojs.2017.74052 755 Open Journal of Statistics
3. Limited Simulation Study
In this study, we shall compare the efficiencies of the moment estimators for the case with α β= , i.e., the GNL distribution with only four parameters. Reed [11]
(page 477) has given the expressions for the moment estimators using the first six empirical cumulants k rr, =2, ,6 , with the sample mean X k= 1. They can be obtained using central empirical moments mr=n1
∑
ni=1(
Xi−X)
2,r=2, ,6 asthey follow the same type of relationships which exist between model cumulants r
κ and model central moments. Let
(
)
2, 2r E X r
µ = −µ > , and
µ =
E X
( )
. The following relationships can be found in Stuart and Ord [26] (pages 90-91) and they are given by1 κ =µ,
2 2 κ =µ ,
3 3 κ =µ ,
2 4 4
3
2κ
=
µ
−
µ
,5 5 10 3 2 κ =µ − µ µ ,
2 3
6 6
15
4 210
330
2κ
=
µ
−
µ µ
−
µ
+
µ
.(32) Explicitly, the moments estimators are
1 2 4
6
20k
k
α β= =
, 43
2 6
100 3
k k
ρ= , µ k1 ρ
=
and 2 2 2
2
k
σ
ρ α
= −
.
(33)
Reed [11] (page 477) also notes that method of moments estimators (MM es-timators) can take on negative values for positive parameters, and it is not easy to include constraints in method of moments estimation. Also, the use of EM algo-rithm does not appear to be straightforward for the GNL distribution. SMHD es-timation can handle constraints by minimizing the objective function, which is given by Equation (28), with constraints.
A limited simulation study using parameters for the symmetric GNL distribu-tion with four parameters, focusing on parameters in the ranges µ=0,
0.008
σ
= , 0.1≤ ≤ρ 5.0, 30≤ ≤α
40, has been carried out and the relevant results are summarized in Table 1. The ranges of parameters as indicated are chosen accordingly and conform with the empirical study conducted by Reed[11] (page 481) using stock data. The simulated sample size for data is n=1000 and the simulated sample size drawn from the model for SMHD estimation is
10000
U = , hence with
τ
=10. It takes about twenty minutes on a laptop com-puter to obtain the estimators for M =50 samples and, due to the limited computer capacity, we fix M =50 samples for each combination of parameters for our study. As we only have access to laptop computers, the scale of the study is limited.effi-DOI: 10.4236/ojs.2017.74052 756 Open Journal of Statistics ciencies use this version of the method of moments estimator. The density esti-mate is based on the built-in function of the package R with a rectangular kernel and default bandwidth based on the normal distribution. The overall asymptotic relative efficiency (𝐴𝐴𝐴𝐴𝐴𝐴) used for comparisons is
( )
( )
( )
( )
( )
( )
( )
( )
ˆ ˆ
ˆS ˆS S S
MSE MSE MSE MSE
ARE
MSE MSE MSE MSE
µ σ α ρ
µ σ α ρ
+ + +
=
+ + +
,
(34)
with MSE
( )
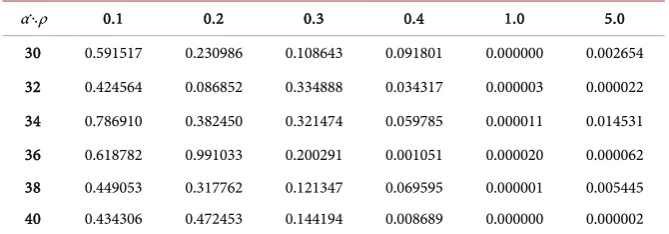
θˆ being the commonly used mean square error of the estimator θˆ and it is estimated using M =50 samples for estimating the expression for ARE and the values of the estimated ARE’s using different sets of parameters are dis-played in Table 1. [image:14.595.206.541.455.572.2]Despite the scope of the study being limited, it suggests that SMHD estimators perform much better than method of moments estimators overall for the ranges of parameters used in finance. The method of moments estimator for
θ
tends to perform better for small values ofρ
and deteriorates rapidly asρ
grows larger with ARE→0 even for various parameter values that we tested which lie outside the ranges indicated above and not shown in Table 1. Table 1 is used for illustration and provides a summary of the key findings of the study. Also, in the ranges considered, the method of moments estimator forµ
tends to perform better than its SMHD counterpart, but the overall efficiency of MM estimators still falls behind the overall efficiency of SMHD estimators in general as shown inTable 1. Clearly, more work needs to be done numerically and theoretically, but it shows the potential efficiencies of SMHD methods.
Table 1. Asymptotic relative efficiencies to compare SMHD estimators with MM estima-tors with σ =0.008.
α⋱ρ 0.1 0.2 0.3 0.4 1.0 5.0 30 0.591517 0.230986 0.108643 0.091801 0.000000 0.002654 32 0.424564 0.086852 0.334888 0.034317 0.000003 0.000022 34 0.786910 0.382450 0.321474 0.059785 0.000011 0.014531 36 0.618782 0.991033 0.200291 0.001051 0.000020 0.000062 38 0.449053 0.317762 0.121347 0.069595 0.000001 0.005445 40 0.434306 0.472453 0.144194 0.008689 0.000000 0.000002 Note: Tabulated values are estimates of the asymptotic relative efficiencies of the SMHD estimators versus the MM estimators.
Individual ratios of mean square errors for some sets of parameters
(
µ 0,σ 0.008,α 30,ρ 0.1)
′= = = = =
θ
( )
( )
ˆ
22.9437 S
MSE MSE
µ
µ
= ,( )
( )
ˆ
0.8584 S
MSE MSE
σ
σ
= ,( )
( )
ˆ
0.5918 S
MSE MSE
α
α
= ,( )
( )
ˆ
0.0222 S
MSE MSE
ρ
DOI: 10.4236/ojs.2017.74052 757 Open Journal of Statistics
(
µ 0,σ 0.008,α 34,ρ 0.3)
′= = = = =
θ
( )
( )
ˆ
925.3334 S
MSE MSE
µ
µ
= ,( )
( )
ˆ
0.6064 S
MSE MSE
σ
σ
= ,( )
( )
ˆ
0.3240 S
MSE MSE
α
α
= ,( )
( )
ˆ
0.0151 S
MSE MSE
ρ
ρ
= , ARE=0.3215(
µ 0,σ 0.008,α 40,ρ 1)
′= = = = =
θ
( )
( )
ˆ
1.3739 S
MSE MSE
µ
µ
= ,( )
( )
ˆ
0.0503 S
MSE MSE
σ
σ
= ,( )
( )
ˆ
0.0004 S
MSE MSE
α
α
= ,( )
( )
ˆ
0.0000 S
MSE MSE
ρ
ρ
= , ARE=0.00004. Conclusion
As SMHD estimators remain consistent with minimum regularity conditions and despite the lack of results on asymptotic normality, the proposed method appears to be useful for fitting actuarial and financial models using continuous infinitely divisible distributions which arise from Lévy processes or continuous mixture distributions constructed using mixing operations, whenever it is not difficult to simulate from these distributions but the density functions of these distributions have no closed-form expressions. In many models, the proposed method appears to be more efficient than traditional methods such as the method of moments. The proposed method is not difficult to implement but methods based on simulations do not seem to receive much attention in finance and actuarial science. They might be considered as additional robust statistical techniques for analyzing empirical data, especially if point estimation is the main interest.
Acknowledgements
The helpful comments of an anonymous referee and the kind support of the OJS staff, which led to an improvement in the presentation of the paper, are grate-fully acknowledged.
References
[1] McNeil, A.J., Frey, R. and Embrechts, P. (2005) Quantitative Risk Management: Concepts, Techniques and Tools. Princeton University Press, Princeton.
[2] McLachlan, G.J. and Krishnan, T. (2008) The EM Algorithm and Extensions. 2nd Edition, Wiley, Hoboken. https://doi.org/10.1002/9780470191613
[3] Küchler, U. and Tappe, S. (2008) Bilateral Gamma Distributions and Processes in Financial Mathematics. Stochastic Processes and their Applications, 118, 261-283. https://doi.org/10.1016/j.spa.2007.04.006
DOI: 10.4236/ojs.2017.74052 758 Open Journal of Statistics https://doi.org/10.1016/j.spa.2013.06.012
[5] Feuerverger, A. and McDunnough, P. (1981) On the Efficiency of Empirical Char-acteristic Function Procedures. Journal of the Royal Statistical Society, Series B, 43, 20-27.
[6] Garcia, R., Renault, E. and Veredas, D. (2011) Estimation of Stable Distributions by Indirect Inference. Journal of Econometrics, 161, 325-337.
https://doi.org/10.1016/j.jeconom.2010.12.007
[7] Beran, R. (1977) Minimum Hellinger Distance Estimates for Parametric Models. The Annals of Statistics, 5, 445-463. https://doi.org/10.1214/aos/1176343842 [8] Tamura, R.N. and Boos, D.D. (1986) Minimum Hellinger Distance Estimation for
Multivariate Location and Covariance. Journal of the American Statistical Associa-tion, 81, 223-229. https://doi.org/10.1080/01621459.1986.10478264
[9] Davidson, R. and MacKinnon, J.G. (2004) Econometric Theory and Methods. Ox-ford University Press, New York.
[10] Basu, A., Shioya, H. and Park, C. (2011) Statistical Inference: The Minimum Dis-tance Approach. Chapman and Hall, Boca Raton.
[11] Reed, W.J. (2007) Brownian-Laplace Motion and Its Use in Financial Modelling. Communications in Statistics—Theory and Methods, 36, 473-484.
https://doi.org/10.1080/03610920601001766
[12] Schoutens, W. (2003) Lévy Processes in Finance: Pricing Financial Derivatives. Wi-ley, New York. https://doi.org/10.1002/0470870230
[13] Dufresne, F. and Gerber, H.U. (1993) The Probability of Ruin for the Inverse Gaus-sian and Related Processes. Insurance: Mathematics and Economics, 12, 9-22. https://doi.org/10.1016/0167-6687(93)90995-2
[14] Luong, A. (2016) Cramér-Von Mises Distance Estimation for Some Positive Infi-nitely Divisible Parametric Families with Actuarial Applications. Scandinavian Ac-tuarial Journal, 2016, 530-549. https://doi.org/10.1080/03461238.2014.977817 [15] Klugman, S.A., Panjer, H.H. and Willmot, G.E. (2012) Loss Models: From Data to
Decisions. 4th Edition, Wiley, Hoboken.
[16] Hogg, R.V., McKean, J.W. and Craig, A.T. (2013) Introduction to Mathematical Statistics. 7th Edition, Pearson, Boston.
[17] Maronna, R.A., Martin, R.D. and Yohai, V.J. (2006) Robust Statistics: Theory and Methods. Wiley, Chichester. https://doi.org/10.1002/0470010940
[18] Lindsay, B.G. (1994) Efficiency versus Robustness: The Case for Minimum Hellin-ger Distance and Related Methods. The Annals of Statistics, 22, 1081-1114. https://doi.org/10.1214/aos/1176325512
[19] Lehmann, E.L. (1999) Elements of Large Sample Theory. Springer, New York. https://doi.org/10.1007/b98855
[20] Rizzo, M.L. (2008) Statistical Computing with R. Chapman and Hall, Boca Raton. [21] Toma, A. (2008) Minimum Hellinger Distance Estimators from the Johnson
Sys-tem. Journal of Statistical Planning and Inference, 138, 803-816. https://doi.org/10.1016/j.jspi.2007.05.033
[22] Scott, D.W. (2014) Multivariate Density Estimation: Theory, Practice and Visualiza-tion. 2nd Edition, Wiley, Hoboken.
DOI: 10.4236/ojs.2017.74052 759 Open Journal of Statistics [24] Smith Jr, A.A. (1993) Estimating Nonlinear Time-Series Models Using Simulated
Vector Autoregressions. Journal of Applied Econometrics, 8, S63-S84. https://doi.org/10.1002/jae.3950080506
[25] Pakes, A. and Pollard, D. (1989) Simulation and the Asymptotics of Optimization Estimators. Econometrica, 57, 1027-1057. https://doi.org/10.2307/1913622
[26] Stuart, A. and Ord, K. (1994) Kendall’s Advanced Theory of Statistics, Volume 1: Distribution Theory. 6th Edition, Edward Arnold, London.
Submit or recommend next manuscript to SCIRP and we will provide best service for you:
Accepting pre-submission inquiries through Email, Facebook, LinkedIn, Twitter, etc. A wide selection of journals (inclusive of 9 subjects, more than 200 journals)
Providing 24-hour high-quality service User-friendly online submission system Fair and swift peer-review system
Efficient typesetting and proofreading procedure
Display of the result of downloads and visits, as well as the number of cited articles Maximum dissemination of your research work