Learning Phenotype Mapping for Integrating Large Genetic Data
Chun-Nan Hsu1,2,∗, Cheng-Ju Kuo2, Congxing Cai1
Sarah A. Pendergrass3,Marylyn D. Ritchie3,4 and Jose Luis Ambite1
1USC Information Sciences Institute, Marina del Rey, CA, USA
2Institute of Information Sciences, Academia Sinica, Taipei, Taiwan
3Center for Human Genetics Research,4Dept. of Molecular Physiology and
Biophysics, Vanderbilt University, Nashville, TN, USA
Abstract
Accurate phenotype mapping will play an im-portant role in facilitating Phenome-Wide As-sociation Studies (PheWAS), and potentially in other phenomics based studies. The Phe-WAS approach investigates the association be-tween genetic variation and an extensive range of phenotypes in a high-throughput manner to better understand the impact of genetic varia-tions on multiple phenotypes. Herein we de-fine the phenotype mapping problem posed by PheWAS analyses, discuss the challenges, and present a machine-learning solution. Our key ideas include the use of weighted Jaccard features and term augmentation by dictionary lookup. When compared to string similarity metric-based features, our approach improves the F-score from 0.59 to 0.73. With augmenta-tion we show further improvement in F-score to 0.89. For terms not covered by the dictio-nary, we use transitive closure inference and reach an F-score of 0.91, close to a level suffi-cient for practical use. We also show that our model generalizes well to phenotypes not used in our training dataset.
1 Introduction
There is a wealth of biomedical data available in public and private repositories (e.g. the database issue of Nucleic Acids Research (?).) Along with this explosion of information comes the need to inte-grate data from multiple sources to achieve sufficient statistical power for analyses and/or to characterize phenomena more precisely. This trend manifests it-self in two primary ways: the formation of large
multi-institution multi-study consortia and public repositories. Although this situation occurs across many areas of biomedicine and our techniques are general, in this paper we will illustrate the ideas with examples from genetic studies in which we are par-ticipating.
Consider the National Center for Biotechnol-ogy Information (NCBI) database of Genotypes and Phenotypes (dbGaP) (www.ncbi.nlm.nih. gov/gap), that was developed to archive and dis-tribute the results of studies that have investigated the interaction of genotype and phenotype. This is a large repository that includes genome-wide associa-tion studies (GWAS), medical sequencing, molecu-lar diagnostic assays, as well as association between genotype and non-clinical traits. Genetic studies funded by the National Institutes of Health (NIH) over a certain size are required to submit the ge-netic and phenotypic data to dbGaP. There are over 130 top-level studies, 1900 datasets, 5600 analyses, comprising about 125000 phenotypic variables. Un-fortunately, each study uses its own set of variables, thus far dbGaP does not attempt to reconcile, match or harmonize any of these variables. For example, a variable called‘BMI’ in one study and ‘Body Mass Index’ in another study are recorded as different variables. The task of matching or harmo-nizing these variables falls on each researcher that obtains dbGaP data from multiple studies.
Similarly, consider a large consortium, such as the Population Architecture Using Genomics and Epidemiology (PAGE) network. PAGE (www.pagestudy.org) is a consortium of four major studies with the goal of understanding the
association of genetic variants with complex dis-eases and traits across a variety of populations. The studies that comprise PAGE include: the Women’s Health Initiative (WHI, www.whiscience. org/); the Multiethnic Cohort (MEC,
www.crch.org/multiethniccohort/,
www.uscnorris.com/mecgenetics/); the CALiCo Consortium, comprised in turn of the Atherosclerosis Risk In Communities (ARIC) study (www.cscc.unc.edu/aric/), the Coronary Artery Risk In Young Adults (CARDIA) study (www.cardia.dopm.uab.edu), the Cardio-vascular Heart Study (www.chs-nhlbi.org/), the Hispanic Community Health Study (www.cscc.unc.edu/hchs/), the Strong Heart Cohort Study, and the Strong Heart Family Study (strongheart.ouhsc.edu/); and the Epidemiologic Architecture of Genes Linked to Environment (chgr.mc.vanderbilt.edu/ eagle/) study, which utilizes genotypic and phe-notypic data from the National Health and Nutrition Examination Surveys (NHANES) from the Centers for Disease Control and Prevention (CDC). The studies of PAGE represent a pool of over 200,000 individuals with genotypic data collected across multiple race/ethnicities, and an extremely diverse collection of phenotypic data. Within PAGE there are numerous analyses and writing groups that focus on specific diseases. Each group selects variables relevant to their disease and harmonizes the variables across studies.
A group within PAGE is investigating a novel approach to genetic association analysis called a Phenome Wide Association Studies (PheWAS) (?). This is a different approach compared to the cur-rent paradigm of Genome Wide Association Stud-ies (GWAS) (?; ?). GWAS focus on calculating the association between the variation of hundreds of thousands of genotyped single nucleotide poly-morphisms (SNPs) and a single or small number of phenotypes. This approach has provided valu-able information about the contribution of genetic variation to a wide range of diseases and pheno-types. A common limitation of GWAS is the in-vestigation of a limited phenotypic domain. In con-trast, PheWAS utilizes an extensive range of de-tailed phenotypic measurements including interme-diary biomarkers, in addition to prevalent and
in-cident status for multiple common clinical condi-tions, risk factors, and quantitative traits for compre-hensively exploring the association between genetic variations and all PheWAS phenotypes. The inves-tigation of a broad range of phenotypes has the po-tential to identify pleiotropy, novel mechanistic in-sights fostering hypothesis generation, and to define a more complete picture of genetic variations and their impact on human diseases.
In order to compare PheWAS results across stud-ies within PAGE to seek replication for significant genotype/phenotype associations, an important step is matching and mapping phenotypes across stud-ies. As the number and range of phenotypes is large across studies, manually matching phenotypes is less than ideal. Therefore, an important step in im-proving the feasibility of PheWAS studies is to use computational approaches to map phenotypes across studies, effectively matching related phenotypes.
DefinitionPhenotype Mappingis the task of assign-ing every variable from each participatassign-ing study to one out of a set of categories. The categories can be defined for a given integrated study or consortium, or can be taken from pre-existing ontologies, such as PhenX (www.phenx.org).
For one example, consider the variable hypt
from WHI which is described by the text
‘Hypertension ever’ and the variable
HAE5A from the EAGLE study described by the text ‘Now taking prescribed medicine for HBP’. To manually match these phenotypes, a human expert declares these two variables to be relevant to class ‘hypertension’. Table 1 shows additional examples.
The phenotype mapping problem is quite chal-lenging. First, the variable descriptions are quite short (around 10 words, often less). Second, map-ping the variables to a category, such as hyperten-sion, may require significant background knowledge (HBP stands for High Blood Pressure, also known as hypertension). Third, there are large numbers of variables, so the solution needs to scale gracefully.
reduce the burden on researchers when integrating data from multiple studies.
2 Related Work
From the perspective of biomedical sciences, phe-notype mapping is a pre-requisite and a generaliza-tion for the task ofphenotype harmonization(?). In harmonization, a single variable is identified or cal-culated for each phenotype within each study. This can only be accomplished for a very limited set of variables. There is a need, however, to provide enough information on a much larger set of pheno-type variables so that researchers can determine the
common denominator version of a measure across studies. For example, if a researcher is interested in hypertension status as an outcome, there needs to be an assessment of how hypertension status was ascertained in each study. Different approaches in-clude self-report, clinic-based blood pressure mea-surement and/or anti-hypertensive medication use. Only after this information is obtained, along with other information, such as at what visit was status assessed and whether the variable is available for the entire cohort or only a portion of it will the re-searcher be able to determine what to use in analysis and how to interpret the findings. The phenotype mapping task that we address in this paper enables a researcher to rapidly find all the phenotype vari-ables that are related to a given category, which then constitutes the input to the harmonization process.
From the computer science perspective, the task of phenotype mapping can be seen as an instance of the problem of entity linkage, which appears in a va-riety of forms across many contexts, namely record linkage (?), object identification (?), duplicate de-tection (?), and coreference (?;?). That is, the prob-lem of recognizing when multiple objects (in multi-ple sources) actually correspond to the same entity.
Record linkage generally consists of three phases: (1) blocking, where the number of pairs of objects is reduced, which is critical for large datasets (e.g., (?; ?; ?)), (2) field similarity, where the attributes of an object are compared (e.g., (?;?;?;?;?), and (3) record similarity, which weights how different attributes contribute to the similarity of records as a whole (e.g., (?;?)). Machine learning techniques are used for many of these tasks.
The task of phenotype mapping is related, but dif-fers from previous incarnations of record linkage. In our case, the variables are the objects to be mapped. However, the only attribute of an object is a terse textual description (cf. Table 1). This makes the problem harder since, as we will see, string simi-larity measures are not enough, and term expansion with additional background knowledge is necessary. We do not consider blocking techniques in this pa-per, since the number of phenotypes is in the thou-sands and an exhaustive O(n2) comparison is still feasible.
In this paper, we define and present an approach to phenotype mapping with good experimental perfor-mance, but there are many opportunities for refine-ment by incorporating additional techniques from the record linkage literature.
3 Phenotype Mapping
For the PAGE PheWAS study, phenotypes were first manually matched, through the creation of 106 phe-notype classes, in order to bring together related phenotypes across studies. The following steps were then used: First, the data from different studies were filtered independently for any significant associa-tion results with p < 0.01. Closely related phe-notypes were then matched up between studies and assigned to phenotype classes. Finally, phenotypes from all studies, regardless of association results, were matched up to the already defined phenotype classes. In this way, a phenotype that might not have shown a significant association result for a sin-gle study, but that matched a phenotype class, would still be added to the phenotype-class list. To scale up the process it is important to develop a semi or fully automatic approach for the task.
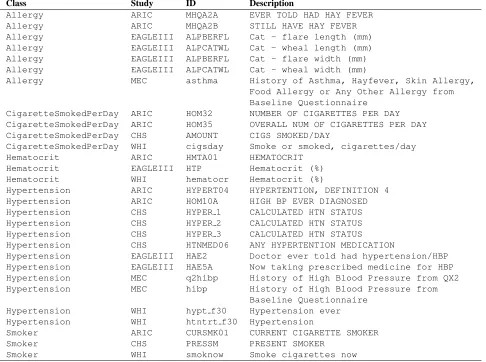
Table 1 shows some example phenotypes and their classification.Classlabels were assigned when we manually matched the phenotypes. The real ID of a phenotype in a study is given in column ID.
Description will be the main clue for automatic matching. These examples were chosen to illustrate unique characteristics that we observed in the manu-ally matched data set and the challenges of the task.
Class Study ID Description
Allergy ARIC MHQA2A EVER TOLD HAD HAY FEVER
Allergy ARIC MHQA2B STILL HAVE HAY FEVER
Allergy EAGLEIII ALPBERFL Cat - flare length (mm) Allergy EAGLEIII ALPCATWL Cat - wheal length (mm) Allergy EAGLEIII ALPBERFL Cat - flare width (mm) Allergy EAGLEIII ALPCATWL Cat - wheal width (mm)
Allergy MEC asthma History of Asthma, Hayfever, Skin Allergy, Food Allergy or Any Other Allergy from Baseline Questionnaire
CigaretteSmokedPerDay ARIC HOM32 NUMBER OF CIGARETTES PER DAY CigaretteSmokedPerDay ARIC HOM35 OVERALL NUM OF CIGARETTES PER DAY CigaretteSmokedPerDay CHS AMOUNT CIGS SMOKED/DAY
CigaretteSmokedPerDay WHI cigsday Smoke or smoked, cigarettes/day
Hematocrit ARIC HMTA01 HEMATOCRIT
Hematocrit EAGLEIII HTP Hematocrit (%)
Hematocrit WHI hematocr Hematocrit (%)
Hypertension ARIC HYPERT04 HYPERTENTION, DEFINITION 4 Hypertension ARIC HOM10A HIGH BP EVER DIAGNOSED Hypertension CHS HYPER 1 CALCULATED HTN STATUS Hypertension CHS HYPER 2 CALCULATED HTN STATUS Hypertension CHS HYPER 3 CALCULATED HTN STATUS Hypertension CHS HTNMED06 ANY HYPERTENTION MEDICATION
Hypertension EAGLEIII HAE2 Doctor ever told had hypertension/HBP Hypertension EAGLEIII HAE5A Now taking prescribed medicine for HBP Hypertension MEC q2hibp History of High Blood Pressure from QX2 Hypertension MEC hibp History of High Blood Pressure from
Baseline Questionnaire Hypertension WHI hypt f30 Hypertension ever Hypertension WHI htntrt f30 Hypertension
Smoker ARIC CURSMK01 CURRENT CIGARETTE SMOKER
Smoker CHS PRESSM PRESENT SMOKER
[image:4.612.72.558.58.420.2]Smoker WHI smoknow Smoke cigarettes now
Table 1: Example phenotypes and their classification
less than 10 words, so it is difficult to apply so-phisticated Natural Language Processing tech-niques.
• Phenotypes may be related in different ways: subsumption, overlapping, at the same layer of semantic hierarchy,etc.
• The granularity of the classes varies. For exam-ple, we have classes as specifically defined as
Hematocrit, the ratio of the volume of red blood cells to the total volume of blood. But the classAllergycovers a wide range of allergy sources and symptoms. In Table 1, we show four phenotype variables for allergies against cats with flare and wheal sizes measured. Sim-ilar variables include those for allergies of a wide range of sources: alternaria, bermuda
grass, german cockroach, mite, peanut, rag-weed, rye grass, Russian thistle, and white oak. While in the same class,MECuses a single phe-notypeasthmato cover just about all types of allergies. On the other hand, phenotypes about cigarette smoking are distinctively divided into two categories: cigarettes smoked per day and currently smoking. As we explained earlier, the main criterion here is to maximize the chance to detect unexpected associations, not necessar-ily to match the most semantically similar phe-notypes. As a result, directly applying conven-tional clustering or topic modeling techniques in Information Retrieval may not be appropri-ate here.
hemat-ocrit phenotypes have almost identical descrip-tions. HYPER 1, 2 and 3 of the study CHS
in the classHypertensionhave exactly the same descriptions. For those cases, apply-ing strapply-ing similarity metrics can easily match them together. However, some phenotypes in the same class appear completely different due to the use of synonyms and abbreviations. Again in class Hypertension, ‘hyperten-sion,’ ‘HTN,’ ‘high blood pressure,’ ‘HBP,’ and ‘high BP’ are keywords appearing in the de-scriptions of phenotypes. It is possible for an effective string similarity metric to recog-nize abbreviations like ‘HTN’ for ‘hyperten-sion,’ but without additional information there is no way for a string similarity metric to match ‘hypertension’ and ‘high blood pressure.’
4 Methods
We formulate the task as a problem of learning to score the degree of match of a pair of phenotypes based on their descriptions. By setting a threshold of the score for match or not, the problem reduces to a standard binary classification problem in Machine Learning.
We started by performing a pre-processing step of data cleaning to remove redundant phenotypes with no description, then pairing the resulting pheno-types for training and testing in a supervised learn-ing framework. The data is skewed as most pairs are negative.
Studies 5 Phenotypes 733 Classes 106 Total pairs 298378 Positives 10906 Negatives 287472
Table 2: Statistics of Data
Another pre-processing step is tokenization, which was applied to the description of each phe-notype before we extracted a set of features from each pairs. The tokenization step includes convert-ing all uppercase letters to lowercase letters, re-moving punctuations, segmenting the text into to-kens, and using Porter’s stemmer (?) to stem to-kens, removing stop words and digits. For exam-ple, ‘TRANSIENT ISCHEMIC ATTACK’ will become (transient, ischem, attack). Note
that‘ic’was removed from‘ischemic’by the stemming process.
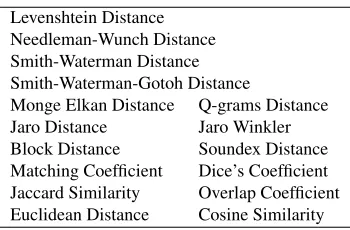
The next step is feature extraction. The goal here is to represent each pair of phenotype variables by a set of feature values as the input to a machine-learning model. We considered two types of fea-tures. The first type is based on string similarity metrics. The idea is to combine the strength of a va-riety of string similarity metrics to measure the edit distance between the descriptions of a pair of pheno-types and use the result to determine if they match each other. We chose 16 metrics as shown in Ta-ble 3. Some of them are sophisticated and designed for challenging record linkage tasks, such as match-ing personal records in census data.
Levenshtein Distance Needleman-Wunch Distance Smith-Waterman Distance Smith-Waterman-Gotoh Distance
[image:5.612.338.513.265.380.2]Monge Elkan Distance Q-grams Distance Jaro Distance Jaro Winkler Block Distance Soundex Distance Matching Coefficient Dice’s Coefficient Jaccard Similarity Overlap Coefficient Euclidean Distance Cosine Similarity
Table 3: String similarity metrics
We used the Java implementation provided by SimMetrics1 to obtain the values of these metrics given a pair of phenotype descriptions. SimMetrics also provides descriptions and references of these string similarity metrics. Each metric is treated as one feature and normalized into a real value between 0 and 1, where 1 indicates that the two strings are identical.
These string similarity metrics, however, treat all words equally but apparently some words are more important than others when we match phenotypes. To assign different weights to different words, we designed a feature set that can be considered as
weighted Jaccard as follows. Let t be a token or a bi-gram (i.e., pair of consecutive tokens). For each tthere are two features in the feature set of the fol-lowing forms:
• share-t: if t appears in the pre-processed de-scriptions of both variables, then its value is1
1
and0otherwise;
• miss-t: if t appears in the pre-processed de-scription of one variable only, then its value is
1and0otherwise;
For example, suppose we have tokenized variables V1 = (age, menopause, start), and V2 = (menopause,start,when), then the features for this pair will be
(miss-‘age’ : 1, share-‘menopause’ : 1, share-‘start’ : 1, miss-‘when’ : 1, miss-‘age menopause’ : 1, share-‘menopause start’ : 1, miss-‘start when’ : 1).
All other features will have value 0. In this way, each example pair of variables will be represented as a very high-dimensional feature vector of binary val-ues. The dimensionality is proportional to the square of the number of all distinct tokens appearing in the training set.
Now we are ready to train a model by a machine-learning algorithm using the examples represented as feature vectors. The model of our choice is the maximum entropy model (MaxEnt), also known as logistic regression (?). An advantage of this model is that efficient learning algorithms are available for training this model with high-dimensional data and the model not only classifies an example into posi-tive or negaposi-tive but also gives an estimated probabil-ity as its confidence. The basic idea of logistic re-gression is to search for a weight vector of the same dimension as the feature vector such that this weight vector when applied in the logit function of the prob-ability estimation of the training examples will max-imize the likelihood of the positive-negative assign-ment of the training examples (?). The same model can also be derived from the principle of maximum entropy. We randomly selected half of the pairs as the training examples and the rest as the holdout set for evaluation.
We used the Merriam-Webster Medical Dictio-nary (?)2to augment the descriptions of phenotypes. If there is an entry for a token in the dictionary,
2www.m-w.com/browse/medical/a.htm
then its definition will be included in the description and then the same pre-processing and feature extrac-tion steps will be applied. Pprocessing is also re-quired to remove useless words from the definitions in the dictionary. We chose this dictionary instead of some ontology or phenotype knowledge base for its quality of contents and comprehensive coverage of biomedical terms. The Merriam-Webster Med-ical Dictionary is also chosen as the only medMed-ical dictionary included in the MedlinePlus3, a Web ser-vice produced by the National Library of Medicine for the National Institute of Health to provide reli-able and up-to-date information about diseases, con-ditions and wellness issues to the patients and their families and friends.
5 Results
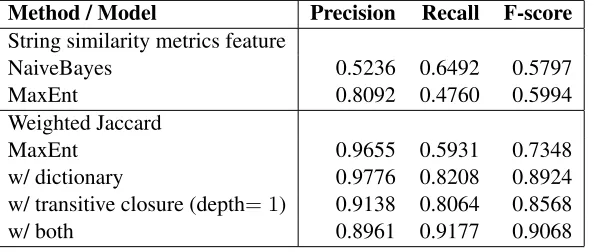
Table 4 shows the results in terms of precision, re-call, and F-score. The first two rows show the use of string similarity metrics as features to train a Naive Bayes model and a MaxEnt model. The F-scores of both models are similar, but Naive Bayes has higher false positives while MaxEnt made more false neg-ative errors. MaxEnt with weighted Jaccard out-performs one with string-similarity features. Aug-mentation by dictionary lookup (“w/ dictionary”) is proved effective by improving recall from 0.59 to
0.82, as more positive mappings were identified for those phenotype pairs described in different terms. One may suspect that the augmentation may in-crease false positives due to incorrectly associating common words in the descriptions. But remarkably, the false positives also decreased, resulting in the improvement in precision as well.
Table 5 shows a set of selected examples to il-lustrate the effectiveness of augmentation by dictio-nary lookup. The first column shows the original de-scriptions of the phenotype variable pairs. The sec-ond and third columns show the classification results (0 for negative, 1 for positive) and the confidence scores by the MaxEnt model without augmentation. The next two columns are their counterparts for the model with augmentation.
For example, the definition of ‘Goiter’ is ‘an enlargement of the thyroid gland.’ There-fore, after augmented by dictionary lookup,
Method / Model Precision Recall F-score
String similarity metrics feature
NaiveBayes 0.5236 0.6492 0.5797
MaxEnt 0.8092 0.4760 0.5994
Weighted Jaccard
MaxEnt 0.9655 0.5931 0.7348
w/ dictionary 0.9776 0.8208 0.8924
w/ transitive closure (depth= 1) 0.9138 0.8064 0.8568
[image:7.612.161.458.55.181.2]w/ both 0.8961 0.9177 0.9068
Table 4: Performance results
Phenotypes w/o dic Score w/ dic Score Goiter ever
Overactive thyroid ever 0 0.014562 1 0.996656 History of High Blood Pressure from
Baseline Questionnaire
Hypertension ever 0 0.014562 1 0.641408
DIABETES W/ FASTING GLUCOSE CUTPT.<126
Insulin shots now 0 0.014562 1 0.523262
TIA STATUS AT BASELINE
Stroke 0 0.014562 1 0.517444
NUMBER OF CIGARETTES PER DAY
CIGS SMOKED/DAY 0 0.014562 0 0.002509
Table 5: Examples of Mapping Results
ter can be matched with overactive thyroid. Sim-ilarly, it is now possible to match ‘High Blood Pressure’with‘hypertension’and‘TIA’
with ‘stroke.’ ‘DIABETES’, ‘GLUCOSE’
and‘Insulin’can also be associated together. However, terms must be covered in the medical dictionary for this method to work. For example, since ‘CIGARETTES’ is not a medical term and even the most sophisticated string similarity met-rics cannot match the local abbreviation ‘CIGS’
to ‘CIGARETTES’, both models failed to match
‘SMOKE’and‘CIGARETTES’together.
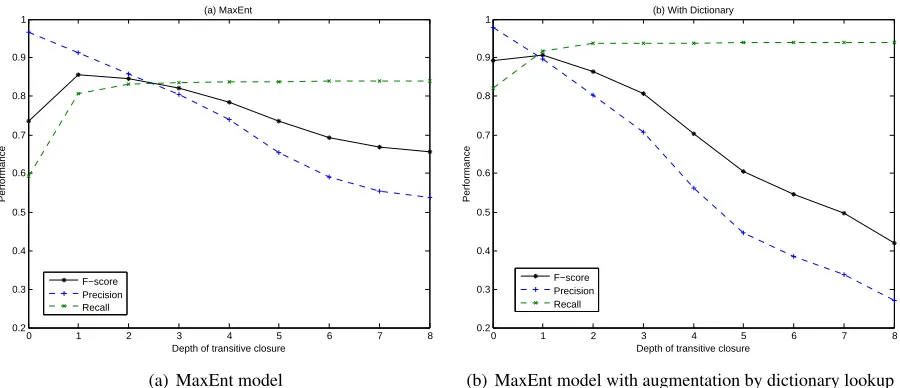
A solution to this issue is to compute transitive closure of the mapping. For example, if
V1 = (SMOKE) and
V2 = (SMOKE CIGARETTES)
are matched together by the model because of a shared term‘smoke’and so areV2and
V3 = (cigarettes),
but notV1 andV3, then transitive closure will infer
a match ofV1 andV3. That will improve recall and
F-score further.
vari-0 1 2 3 4 5 6 7 8 0.2
0.3 0.4 0.5 0.6 0.7 0.8 0.9 1
Depth of transitive closure
Performance
(a) MaxEnt
F−score Precision Recall
(a) MaxEnt model
0 1 2 3 4 5 6 7 8
0.2 0.3 0.4 0.5 0.6 0.7 0.8 0.9 1
Depth of transitive closure
Performance
(b) With Dictionary
F−score Precision Recall
[image:8.612.82.532.55.249.2](b) MaxEnt model with augmentation by dictionary lookup
Figure 1: Performance with increasing depths of transitive closure
ables by 2 to 1, and used2/3of phenotype variables to generate pairs as the training set and1/3to pair with those in the2/3set as well as with each other for testing. That resulted in129286pairs for training and169092 pairs for testing. In this test set,6356
pairs are positive.
We used this training set to train MaxEnt mod-els using the weighted Jaccard feature set with and without dictionary augmentation. Table 6 shows the results. Again, dictionary augmentation signif-icantly improves the performance in this case, too, with the F-score reaching 0.81. Though the results degrade slightly from the ones obtained by splitting by pairs, this is expected as the training set is smaller (129286 pairs vs. 149189 = 298378/2, see Ta-ble 2). Consequently, the proposed models can gen-eralize well to unseen phenotypes to some extent.
Method/Model Precision Recall F-score
w/o dictionary 0.9398 0.5817 0.7186 w/ dictionary 0.8213 0.7977 0.8093
Table 6: Performance results of splitting by variables
6 Conclusions and Future Work
In this paper, we define the problem of phenotype mapping and present a solution by learning to score and classify pairs of phenotypes. We evaluate our solution using a data set of manually matched
phe-notypes from the PAGE PheWAS study. We show that weighted Jaccard features are more effective for this problem than combining string similarity met-rics for a MaxEnt model and that dictionary aug-mentation improves the performance by allowing matching of phenotypes with semantically related but syntactically different descriptions. We show that inferring more positives by depth-one transitive closure fixes those false negatives due to the lack of dictionary definitions. Finally, the evaluation results of splitting-by-variables show that the models gen-eralize well to unseen variables, which is important for the solution to be practical.
Our future work includes to apply blocking as a pre-processing step to keep the number of pairs man-ageable and to apply active or unsupervised learning to alleviate the burden of generating training corpora by manual matching.
Acknowledgments
References
Siiri N. Bennett, Neil Caporaso, Annette L. Fitzpatrick, Arpana Agrawal, Kathleen Barnes, Heather A. Boyd, Marilyn C. Cornelis, Nadia N. Hansel, Gerardo Heiss, John A. Heit, Jae Hee Kang, Steven J. Kittner, Pe-ter Kraft, William Lowe, Mary L. Marazita, Kris-tine R. Monroe, Louis R. Pasquale, Erin M. Ramos, Rob M. van Dam, Jenna Udren, Kayleen Williams, and for the GENEVA Consortium. 2011. Phenotype har-monization and cross-study collaboration in gwas con-sortia: the GENEVA experience. Genetic Epidemiol-ogy, 35(3):159–173.
Mikhail Bilenko and Raymond J. Mooney. 2003. Adaptive duplicate detection using learnable string similarity measures. In Proceedings of the Ninth ACM SIGKDD International Conference on Knowl-edge Discovery and Data Mining, pages 39–48, Wash-ington, DC, USA.
William W. Cohen, Pradeep Ravikumar, and Stephen Fienberg. 2003. A comparison of string distance metrics for name-matching tasks. In Proceedings of IJCAI-03 Workshop on Information Integration on the Web (IIWeb-03).
The Wellcome Trust Case Control Consortium. 2007. Genome-wide association study of 14,000 cases of seven common diseases and 3,000 shared controls.
Nature, 447(7145):661–678, June.
Joshua C. Denny, Marylyn D. Ritchie, Melissa A. Bas-ford, Jill M. Pulley, Lisa Bastarache, Kristin Brown-Gentry, Deede Wang, Dan R. Masys, Dan M. Ro-den, and Dana C. Crawford. 2010. Phewas: demon-strating the feasibility of a phenome-wide scan to discover gene-disease associations. Bioinformatics, 26(9):1205–1210.
Ivan P. Felligi and Alan B. Sunter. 1969. A theory for record linkage. Journal of the American Statistical As-sociation, 64(328):1183–1210.
Michael Y. Galperin and Guy R. Cochrane. 2011. The 2011 nucleic acids research database issue and the on-line molecular biology database collection. Nucleic Acids Research, 39(suppl 1):D1–D6.
John Hardy and Andrew Singleton. 2009. Genomewide association studies and human disease. New England Journal of Medicine, 360(17):1759–1768.
T. Hastie, R. Tibshirani, and J. Friedmann. 2009.The El-ements of Statistical Learning (2nd Edition). Springer-Verlag, New York, NY, USA.
Mauricio A. Hern´andez and Salvatore J. Stolfo. 1998. Real-world data is dirty: Data cleansing and the merge/purge problem. Data Mining and Knowledge Discovery, 2:9–37.
Jerry R. Hobbs. 1979. Coherence and coreference. Cog-nitive Science, 3(1):67–90.
Andrew McCallum, Kamal Nigam, and Lyle Ungar. 2000. Efficient clustering of high-dimensional data sets with application to reference matching. In Pro-ceedings of the Sixth ACM SIGKDD International Conference on Knowledge Discovery and Data Min-ing, pages 169–178.
Merriam-Webster. 2006. Medical Dictionary. Merriam-Webster, Springfield, MA, USA.
Matthew Michelson and Craig A. Knoblock. 2006. Learning blocking schemes for record linkage. In Pro-ceedings of the 21st National Conference on Artificial Intelligence (AAAI-06), Boston, MA.
Steven Minton, Claude Nanjo, Craig A. Knoblock, mar-tin Michalowski, and Matthew Michelson. 2005. A heterogeneous field matching method for record link-age. InProceedings of the Fifth IEEE International Conference on Data Mining, Novemeber.
Alvaro Monge and Charles Elkan. 1996. The field matching problem: Algorithms and applications. In
In Proceedings of the Second International Confer-ence on Knowledge Discovery and Data Mining, pages 267–270.
Felix Naumann and Melanie Herschel. 2010. An Intro-duction to Duplicate Detection. Synthesis Lectures on Data Management. Morgan & Claypool Publishers. Vincent Ng and Claire Cardie. 2002. Improving
ma-chine learning approaches to coreference resolution. In Proceedings of the 40th Annual Meeting on Asso-ciation for Computational Linguistics, pages 104–111, Stroudsburg, PA, USA. Association for Computational Linguistics.
Martin F. Porter. 1980. An algorithm for suffix stripping.
Program, 14(3):130–137.