Native Language Identification: a Simple n-gram Based Approach
Binod Gyawali and Gabriela Ramirez and Thamar Solorio
CoRAL Lab
Department of Computer and Information Sciences University of Alabama at Birmingham
Birmingham, Alabama, USA
{bgyawali,gabyrr,solorio}@cis.uab.edu
Abstract
This paper describes our approaches to Na-tive Language Identification (NLI) for the NLI shared task 2013. NLI as a sub area of au-thor profiling focuses on identifying the first language of an author given a text in his sec-ond language. Researchers have reported sev-eral sets of features that have achieved rel-atively good performance in this task. The type of features used in such works are: lex-ical, syntactic and stylistic features, depen-dency parsers, psycholinguistic features and grammatical errors. In our approaches, we se-lected lexical and syntactic features based on n-grams of characters, words, Penn TreeBank (PTB) and Universal Parts Of Speech (POS) tagsets, and perplexity values of character of n-grams to build four different models. We also combine all the four models using an en-semble based approach to get the final result. We evaluated our approach over a set of 11 na-tive languages reaching75%accuracy.
1 Introduction
Recently, a growing number of applications are tak-ing advantage of author profiltak-ing to improve their services. For instance, in security applications (Ab-basi and Chen, 2005; Estival et al., 2007) to help limit the search space of, for example, the author of an email threat, or in marketing where the demog-raphy information about customers is important to predict behaviors or to develop new products.
Particularly, author profiling is a task of identi-fying several demographic characteristics of an au-thor from a written text. Demographic groups can be
identified by age, gender, geographic origin, level of education and native language. The idea of identi-fying the native language based on the manner of speaking and writing a second language is borrowed from Second Language Acquisition (SLA), where this is known aslanguage transfer. The theory of language transfer says that the first language (L1) influences the way that a second language (L2) is learned (Ahn, 2011; Tsur and Rappoport, 2007). According to this theory, if we learn to identify what is being transfered from one language to another, then it is possible to identify the native language of an author given a text written in L2. For instance, a Korean native speaker can be identified by the er-rors in the use of articlesa and the in his English writings due to the lack of similar function words in Korean. As we see, error identification is very com-mon in automatic approaches, however, a previous analysis and understanding of linguistic markers are often required in such approaches.
In this paper we investigate if it is possible to build native language classifiers that are not based on the analysis of common grammatical errors or in deeper semantic analysis. On the contrary, we want to find a simple set of features related to n-grams of words, characters, and POS tags that can be used in an ef-fective way. To the best of our knowledge, almost all the works related to L1 identification use fine grained POS tags, but do not look into whether a coarse grained POS tagset could help in their work. Here, we explore the use of coarse grained Univer-sal POS tags with 12 POS categories in the NLI task and compare the result with the fine grained Penn TreeBank (PTB) POS tags with 36 POS categories.
Moreover, we also investigate how the system works when perplexity values are used as features in iden-tifying native languages. Using an ensemble based approach that combines four different models built by various combinations of feature sets of n-grams of words, characters, and POS tags, and perplexity values, we identify the native language of the author, over 11 different languages, with an accuracy close to80%and75%in development and test dataset re-spectively.
2 Related Work
The first known work about native language identifi-cation appears in 2005 (Koppel et al., 2005). In their study, the authors experimented with three types of features, i.e. function words, letter n-grams, er-rors and idiosyncrasies. But their analysis was fo-cused on the identification of common errors. They found that using a combination of all the features in a Support Vector Machine (SVM), they can obtain an accuracy of 80% in the classification of 5 differ-ent native languages. As in this first study, analyz-ing errors is common in native language identifica-tion methods, since it is a straightforward adapta-tion of how this task is performed in SLA. For in-stance, Wong and Dras (2009) investigate the use of error types such as disagreement on subject-verb and noun-number, as well as misuse of determin-ers to show that error analysis is helpful in this task. But their results could not outperform the results ob-tained by Koppel et al. (2005). They also suggested that analyzing other types of errors might help to im-prove their approach. In the same path, Jarvis et al. (2012) investigate a larger variety of errors, for ex-ample lexical words and phrase errors, determiner errors, spelling errors, adjective order errors and er-rors in the use of punctuation marks, among others. But they also could not achieve results comparable to the previous results in this task.
Since language transfer occurs when grammati-cal structures from a first language determine the grammatical structures of a second language, the in-clusion of function words and dependency parsers as features seem to be helpful to find such trans-fers as well as error types (Tetreault et al., 2012; Brooke and Hirst, 2011; Wong et al., 2012). It is common that the analysis of the structure of
certain grammatical patterns is also informative to find the use or misuse of well-established gram-matical structures (e.g. to distinguish between the use of verb-subject-object, subject-verb-object, and subject-object-verb), in such cases n-grams of POS tags can be used. Finally, according to Tsur and Rappoport (2007), the transfer of phonemes is use-ful in identifying the native language. Even though the phonemes are usually speech features, the au-thors suggest that this transfer can be captured by the use of character n-grams in the text. Character n-grams have been proved to be a good feature in author profiling as well since they also capture hints of style, lexical information, use of punctuation and capitalization.
In sum, there are varieties of feature types used in native language identification, most of them com-bine three to nine types. Each type aims to capture specific information such as lexical and syntactic in-formation, structural inin-formation, idiosyncrasies, or errors.
3 Shared Task Description
The Native Language Identification (NLI) shared task focuses on identifying the L1 of an author based on his writing in a second language. In this case, the second language is English. The shared task had three sub-tasks: one closed training and two open training. The details about the tasks are described by Tetreault et al. (2013). For each subtask, the par-ticipants were allowed to submit up to five runs. We participated in the closed training task and sub-mitted five runs.
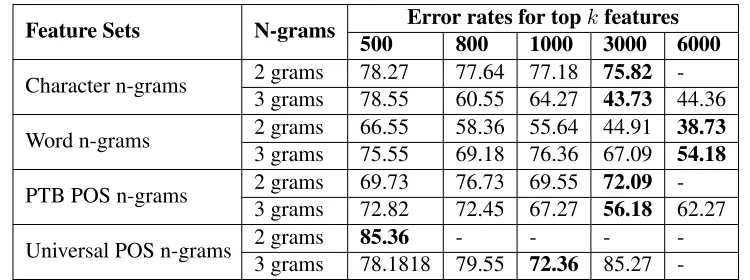
Feature Sets N-grams Error rates for topkfeatures
500 800 1000 3000 6000
Character n-grams 2 grams 78.27 77.64 77.18 75.82 -3 grams 78.55 60.55 64.27 43.73 44.36
Word n-grams 2 grams 66.55 58.36 55.64 44.91 38.73 3 grams 75.55 69.18 76.36 67.09 54.18
PTB POS n-grams 2 grams 69.73 76.73 69.55 72.09 -3 grams 72.82 72.45 67.27 56.18 62.27
Universal POS n-grams 2 grams 85.36 - - -
-3 grams 78.1818 79.55 72.36 85.27
-Table 1: Error rates in L1 identification using various feature sets with different number of features
4 General System Description
In this paper we describe two sets of experiments. We performed a first set of experiments to evaluate the accuracy of different sets of features in order to find the best selection. This set was also intended to determine the threshold of the number of top fea-tures in each set needed to obtain a good perfor-mance in the classification task. These experiments are described in Section 5.
In the second set, we performed five different ex-periments for five runs. Four of the five models used different combinations of feature sets to train the classifier. The major goal of these experiments was to find out how good the results achieved can be by using lower level lexical and shallow syntactic features. We also compared the accuracy obtained by using the fine grained POS tags and the coarse grained POS tags. In one of these experiments, we used perplexity values as features to see how effec-tive these features can be in NLI tasks. Finally, the fifth experiment was an ensemble based approach where we applied a voting scheme to the predictions of the four approaches to get the final result. The de-tails of these experiments are described in Section 6. In our experiments, we trained the classifier using the training dataset, and using the model we tested the accuracy on the development and test dataset. We used an SVM multiclass classifier (Crammer and Singer, 2002) with default parameter settings for the machine learning tasks. We used character n-grams, word n-grams, Parts of Speech (POS) tag n-grams, and perplexity of character trigrams as features. For all the features except perplexity, we used a TF-IDF weighting scheme. To reduce the number of
fea-tures, we selected only the topk features based on the document frequency in the training data.
The provided dataset contained all the sentences in the essays tokenized by using ETS’s proprietary tokenizers. For the POS tags based features, we used two tagsets: Penn TreeBank (PTB) and Uni-versal POS tags. For PTB POS tags, we tagged the text with the Stanford parser (Klein and Manning, 2003). In order to tag the sentences with Universal POS tags, we mapped the PTB POS tags to universal POS tags using the mapping described by Petrov et al. (2011).
We also used perplexity values from language models in our experiments. To generate the lan-guage models and compute perplexity, we used the SRILM toolkit (Stolcke et al., 2011). We used train-ing data to generate the language models and train the classifier. Finally, all the sentences were con-verted into lower case before finding the word and character n-grams.
5 Feature Sets Evaluation
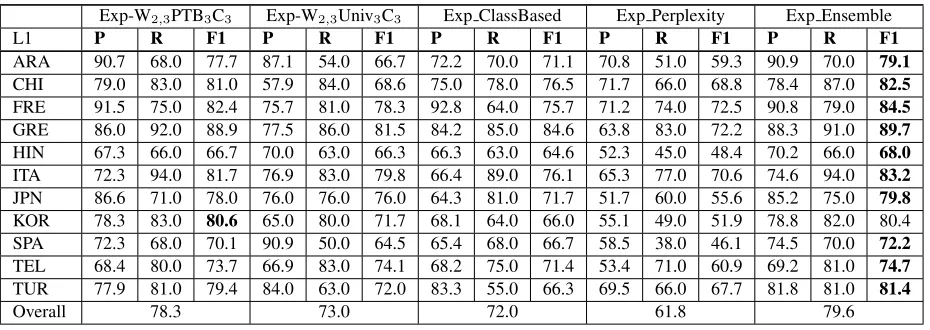
[image:3.612.118.493.62.202.2]Exp-W2,3PTB3C3 Exp-W2,3Univ3C3 Exp ClassBased Exp Perplexity Exp Ensemble
L1 P R F1 P R F1 P R F1 P R F1 P R F1
ARA 90.7 68.0 77.7 87.1 54.0 66.7 72.2 70.0 71.1 70.8 51.0 59.3 90.9 70.0 79.1
CHI 79.0 83.0 81.0 57.9 84.0 68.6 75.0 78.0 76.5 71.7 66.0 68.8 78.4 87.0 82.5
FRE 91.5 75.0 82.4 75.7 81.0 78.3 92.8 64.0 75.7 71.2 74.0 72.5 90.8 79.0 84.5
GRE 86.0 92.0 88.9 77.5 86.0 81.5 84.2 85.0 84.6 63.8 83.0 72.2 88.3 91.0 89.7
HIN 67.3 66.0 66.7 70.0 63.0 66.3 66.3 63.0 64.6 52.3 45.0 48.4 70.2 66.0 68.0
ITA 72.3 94.0 81.7 76.9 83.0 79.8 66.4 89.0 76.1 65.3 77.0 70.6 74.6 94.0 83.2
JPN 86.6 71.0 78.0 76.0 76.0 76.0 64.3 81.0 71.7 51.7 60.0 55.6 85.2 75.0 79.8
KOR 78.3 83.0 80.6 65.0 80.0 71.7 68.1 64.0 66.0 55.1 49.0 51.9 78.8 82.0 80.4 SPA 72.3 68.0 70.1 90.9 50.0 64.5 65.4 68.0 66.7 58.5 38.0 46.1 74.5 70.0 72.2
TEL 68.4 80.0 73.7 66.9 83.0 74.1 68.2 75.0 71.4 53.4 71.0 60.9 69.2 81.0 74.7
TUR 77.9 81.0 79.4 84.0 63.0 72.0 83.3 55.0 66.3 69.5 66.0 67.7 81.8 81.0 81.4
[image:4.612.75.540.62.227.2]Overall 78.3 73.0 72.0 61.8 79.6
Table 2: L1 identification accuracy in development data
POS bigrams, Universal POS bigrams, and Univer-sal POS trigrams were 1275, 1386, 144, and 1602 respectively, some fields in the table are blank.
A trivial baseline for this task is to classify all the instances to a single class, which gives 9.09% ac-curacy. The table above shows that the results ob-tained in all cases is better than the baseline. In five cases, better results were obtained when using the top 3000 or 6000 features compared to other feature counts. In the case of the character trigram feature set, though the result using top 3000 features is bet-ter than the others, the difference is very small com-pared to the experiment using top 6000 features. The accuracy obtained by using top 3000 features in PTB POS tags is 6% higher than that with top 6000 fea-tures. In case of Universal POS tags trigrams, better results were obtained with top 1000 features.
Results show that bigram and trigram feature sets of words give higher accuracy compared to bigrams and trigrams of characters and POS tags. Comparing the results of n-grams of two different POS tagsets, the results obtained when using the PTB tagset are better than those when using the Universal tagsets. In the case of character, PTB POS tag, and Univer-sal POS tag bigram feature sets, the overall accu-racy is less than 30%. Based on these results, we de-cided to use the following sets of features: trigrams of characters and POS tags (PTB and Universal) and bigrams of words in our experiments below.
6 Final Evaluation
We submitted five runs for the task based on five classifiers. We named the experiments based on the features used and the approaches used for feature se-lection. Details about the experiments and their re-sults are described below.
1. Exp-W2,3PTB3C3: In this experiment, we used bigrams at the word level, and trigrams at the word, character level, as well as PTB POS tag trigrams as feature sets. We selected these feature sets based on the accuracies obtained in the experiments described in Section 5. We tried to use a consistent number of features in each feature set. As seen in Table 1, though the results obtained by using top 3000 and 6000 features are better in equal number of cases (2 and 2), the difference in accuracies when ing 6000 features is higher than that when us-ing 3000 features. Thus, we decided to use the top 6000 features in all the four feature sets.
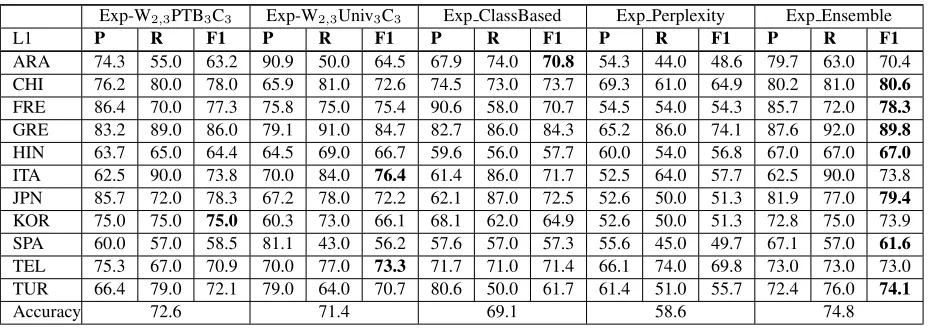
Exp-W2,3PTB3C3 Exp-W2,3Univ3C3 Exp ClassBased Exp Perplexity Exp Ensemble
L1 P R F1 P R F1 P R F1 P R F1 P R F1
ARA 74.3 55.0 63.2 90.9 50.0 64.5 67.9 74.0 70.8 54.3 44.0 48.6 79.7 63.0 70.4 CHI 76.2 80.0 78.0 65.9 81.0 72.6 74.5 73.0 73.7 69.3 61.0 64.9 80.2 81.0 80.6
FRE 86.4 70.0 77.3 75.8 75.0 75.4 90.6 58.0 70.7 54.5 54.0 54.3 85.7 72.0 78.3
GRE 83.2 89.0 86.0 79.1 91.0 84.7 82.7 86.0 84.3 65.2 86.0 74.1 87.6 92.0 89.8
HIN 63.7 65.0 64.4 64.5 69.0 66.7 59.6 56.0 57.7 60.0 54.0 56.8 67.0 67.0 67.0
ITA 62.5 90.0 73.8 70.0 84.0 76.4 61.4 86.0 71.7 52.5 64.0 57.7 62.5 90.0 73.8 JPN 85.7 72.0 78.3 67.2 78.0 72.2 62.1 87.0 72.5 52.6 50.0 51.3 81.9 77.0 79.4
KOR 75.0 75.0 75.0 60.3 73.0 66.1 68.1 62.0 64.9 52.6 50.0 51.3 72.8 75.0 73.9 SPA 60.0 57.0 58.5 81.1 43.0 56.2 57.6 57.0 57.3 55.6 45.0 49.7 67.1 57.0 61.6
TEL 75.3 67.0 70.9 70.0 77.0 73.3 71.7 71.0 71.4 66.1 74.0 69.8 73.0 73.0 73.0 TUR 66.4 79.0 72.1 79.0 64.0 70.7 80.6 50.0 61.7 61.4 51.0 55.7 72.4 76.0 74.1
[image:5.612.75.539.62.226.2]Accuracy 72.6 71.4 69.1 58.6 74.8
Table 3: L1 identification accuracy in test data
trigrams was only 1602, we replaced 6000 PTB POS trigrams with 1602 Universal POS tri-grams.
3. Exp ClassBased: The difference in this exper-iment from the first one lies in the process of feature selection. Instead of selecting the topk features from the whole training data, the se-lection was done considering the top m fea-tures for each L1 class present in the training dataset, i.e., we first selected the topmfeatures from each L1 class and combined them for a total of p where p is greater than or equal to mandk. After a number of experiments per-formed with different combinations of features to train the classifier and testing on the develop-ment dataset, we obtained the best result using character trigrams, PTB POS tag bigrams and trigrams, and word bigrams feature sets with 3000, 1000, 1000, and 6000 features from each L1 respectively. This makes the total number of features in character trigrams, POS tag bi-grams, POS tag tribi-grams, and word bigrams as 3781, 1278, 1475, and 15592 respectively.
4. Exp Perplexity: In this experiment, we used the perplexity values as the features that were computed from character trigram language models. Language models define the proba-bility distribution of a sequence of tokens in a given text. We used perplexity values since these have been successfully used in some au-thorship attribution tasks (Sapkota et al., 2013).
5. Exp Ensemble: In the fifth experiment, we used an ensemble based approach with our above mentioned four different models. We allowed each of the four models to have two votes. The first vote is a weighted voting schema in which the models were ranked ac-cording to their results in the development dataset and the weight for each model was given by wc = 1/rank(c), where rank(c) is the position of c in the ranked list. The final output was based on the second vote that used a majority voting schema. In the second vote, the output of the first voting schema was also used along with the output of four models.
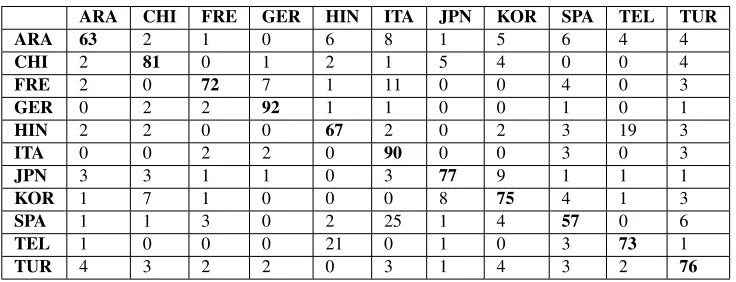
ARA CHI FRE GER HIN ITA JPN KOR SPA TEL TUR
ARA 63 2 1 0 6 8 1 5 6 4 4
CHI 2 81 0 1 2 1 5 4 0 0 4
FRE 2 0 72 7 1 11 0 0 4 0 3
GER 0 2 2 92 1 1 0 0 1 0 1
HIN 2 2 0 0 67 2 0 2 3 19 3
ITA 0 0 2 2 0 90 0 0 3 0 3
JPN 3 3 1 1 0 3 77 9 1 1 1
KOR 1 7 1 0 0 0 8 75 4 1 3
SPA 1 1 3 0 2 25 1 4 57 0 6
TEL 1 0 0 0 21 0 1 0 3 73 1
[image:6.612.123.491.61.202.2]TUR 4 3 2 2 0 3 1 4 3 2 76
Table 4: Confusion Matrix
3rdand 4thlowest accuracies.
Besides the ensemble based approach, the sec-ond best result was obtained by the first experiment (Exp W2,3PTB3C3). Comparing the overall accura-cies of the first and second (Exp-W2,3Univ3C3) ex-periments, though the difference between them does not seem very high in the test dataset, there is a dif-ference of more than 5% in the development dataset. In the test dataset, the second experiment has the best results among all the approaches for classes Italian and Telugu, and has better results than the first experiment for classes Arabic and Hindi. The difference in the approaches used in the first and sec-ond experiments was the use of n-grams of different POS tagsets. The use of coarse grained Universal POS tagset features generalizes the information and loses the discriminating features that the fine grained PTB POS tagset features captures. For instance, the PTB POS tagset differentiates verbs into six cate-gories while the Universal POS tagset has only one category for that grammatical class. Because of this, the fine grained POS tagset seems better for identify-ing the native languages than usidentify-ing a coarse grained POS tagset in most of the cases. More studies are needed to analyze the cases where Universal POS tagset works better than the fine grained PTB POS tagset.
The difference in accuracies obtained between the first experiment (Exp W2,3PTB3C3) and the third experiment (Exp ClassBased) is more than 6% in the development dataset and more than 3% in the test dataset. In the test dataset, the third experiment has the highest accuracy for Arabic class and has better accuracy than the first experiment for Telugu class. The difference between these approaches was the
feature selection approach used to create the feature vector. The results show that in most of the cases se-lecting the features from the whole dataset achieves better accuracy in identifying native languages com-pared to using the stratified approach of selecting the features from individual classes. The main reason behind using the class based feature selection was that we tried to capture some features that are specif-ically present in one class and not in others. Since all the texts in our dataset were about one of the eight prompts, and we have a balanced dataset, there was no benefit of doing the class based feature selection approach.
The fourth experiment (Exp Perplexity) using perplexity values as features did not achieve accu-racy comparable to the first three experiments. Be-cause of the time constraint, we calculated perplex-ity based on only character trigram language mod-els. Though the result we achieved is not promis-ing, this approach could be an interesting work in fu-ture experiments where we could use other language models or the combination of various language mod-els to compute the perplexity.
7 Error Analysis
other languages in the task. The features we used in our experiments are shallow syntactic and lexical features, which could discriminate the writing styles and the structure of the German class texts, thus hav-ing a higher prediction accuracy.
The table shows that French, Italian, and Spanish classes seem to be confused with each other. Though the misclassification rate of texts in the Italian class is considerably low, a good number of texts in the French and Spanish classes are misclassified as Ital-ian. The highest number of documents mispredicted is from Spanish to Italian, i.e. 25 texts of Span-ish class are mispredicted as Italian. These three languages fall under the same language family i.e. Indo-European/Romance and have a similar gram-matical features. The gramgram-matical structure is a par-ticular example of the high rate of misclassification among these classes. While English language is very strict in the order of words (Subject-Verb-Object), Spanish, Italian and French allow more flexibility. For instance, in Spanish, the phrases ‘the car red’ (el auto rojo) and ‘the red car’ (el rojo auto) are both correct although the later is a much less com-mon construction. In this scenario, it is easy to see that the n-grams of words and POS tags are benefi-cial to distinguish them from English, but these n-grams might be confusing to identify the differences among these three languages since the patterns of language transfer might be similar.
Though Hindi and Telugu languages do not fall under the same language family, they are highly con-fused with each other. After Spanish to Italian, the second highest number of misclassified texts is from Telugu to Hindi. Similarly, 19 texts from the class Hindi are mispredicted as Telugu. Both of these lan-guages are spoken in India. Hindi is the National and official language of India, while Telugu is an of-ficial language in some states of India. Moreover, English is also one of the official languages. So, it is very likely that the speakers are exposed to the same English dialect and therefore their language transfer patterns might be very similar. This might have caused our approach of lexical and syntactic features to be unable to capture enough information to identify the differences between the texts of these classes.
Texts from Arabic class are equally misclassified to almost all the other classes, while
misclassifica-tion to Arabic do not seem that high. Texts of the Japanese, Korean, Chinese classes seem to be con-fused with each other, but the confusion does not seem very high thus having a good accuracy rate.
8 Conclusion and Future Work
In this paper, we describe our approaches to Na-tive Language identification for the NLI Shared Task 2013. We present four different models for L1 iden-tification, three of them using various combinations of n-gram features at the word, character and POS tag levels and a fourth one using perplexity values as features. Results show that all these approaches give a good accuracy in L1 identification. We achieved the best result among these by using the combina-tion of character, words, and PTB POS tags. Fi-nally, we applied an ensemble based approach over the results of the four different models that gave the highest overall accuracy of 79.6% and 74.8% in the development and test dataset respectively.
In our approaches, we use simple n-grams and do not consider grammatical errors in L1 identification. We would like to expand our approach by using the errors such as misspelled words and subject-verb, and noun-number disagreements as features. More-over, in our current work of using perplexity values, the result seems good but is not promising. In this approach, we used the perplexity values based on only character trigram language models. We would like to incorporate other word and character n-gram language models to calculate perplexity values in our future work.
Acknowledgements
We would like to thank the organizers of NLI shared task 2013. We would also like to thank CONACyT for its partial support of this work under scholarship 310473.
References
Native Language. Master’s thesis, Naval Postgraduate School, Monterey, CA.
Daniel Blanchard, Joel Tetreault, Derrick Higgins, Aoife Cahill, and Martin Chodorow. 2013. TOEFL11: A Corpus of Non-Native English. Technical report, Ed-ucational Testing Service.
Julian Brooke and Graeme Hirst. 2011. Native language detection with ‘cheap’ learner corpora. InConference of Learner Corpus Research (LCR2011), Louvain-la-Neuve, Belgium. Presses universitaires de Louvain. Koby Crammer and Yoram Singer. 2002. On the
al-gorithmic implementation of multiclass kernel-based vector machines. The Journal of Machine Learning Research, 2:265–292.
Dominique Estival, Tanja Gaustad, Son Bao Pham, Will Radford, and Ben Hutchinson. 2007. Author profiling for English emails. InProceedings of the 10th Con-ference of the Pacific Association for Computational Linguistics, pages 263–272, Melbourne, Australia. Scott Jarvis, Yves Bestgen, Scott A. Crossley,
Syl-viane Granger, Magali Paquot, Jennifer Thewissen, and Danielle McNamara. 2012. The Comparative and Combined Contributions of n-Grams, Coh-Metrix Indices and Error Types in the L1 Classification of Learner Texts. In Scott Jarvis and Scott A. Crosley, editors,Approaching Language Transfer through Text Classification, pages 154–177. Multilingual Matters. Dan Klein and Christopher D Manning. 2003.
Ac-curate unlexicalized parsing. In Proceedings of the 41st Annual Meeting on Association for Computa-tional Linguistics-Volume 1, pages 423–430. Associ-ation for ComputAssoci-ational Linguistics.
Moshe Koppel, Jonathan Schler, and Kfir Zigdon. 2005. Determining an author’s native language by mining a text for errors. In Proceedings of the eleventh ACM SIGKDD international conference on Knowledge dis-covery in data mining, pages 624–628, Chicago, IL. ACM.
Slav Petrov, Dipanjan Das, and Ryan McDonald. 2011. A universal part-of-speech tagset. arXiv preprint arXiv:1104.2086.
Upendra Sapkota, Thamar Solorio, Manuel Montes-y G´omez, and Paolo Rosso. 2013. The use of orthogo-nal similarity relations in the prediction of authorship. InComputational Linguistics and Intelligent Text Pro-cessing, pages 463–475. Springer.
Andreas Stolcke, Jing Zheng, Wen Wang, and Victor Abrash. 2011. SRILM at sixteen: Update and outlook. In Proceedings of IEEE Automatic Speech Recognition and Understanding Workshop.
Joel Tetreault, Daniel Blanchard, Aoife Cahill, and Mar-tin Chodorow. 2012. Native tongues, lost and found: Resources and empirical evaluations in native
language identification. In Proceedings of COLING 2012, pages 2585–2602, Mumbai, India, December. The COLING 2012 Organizing Committee.
Joel Tetreault, Daniel Blanchard, and Aoife Cahill. 2013. A report on the first native language identification shared task. InProceedings of the Eighth Workshop on Building Educational Applications Using NLP, At-lanta, GA, USA, June. Association for Computational Linguistics.
Oren Tsur and Ari Rappoport. 2007. Using classifier fea-tures for studying the effect of native language on the choice of written second language words. In Proceed-ings of the Workshop on Cognitive Aspects of Com-putational Language Acquisition, pages 9–16, Prague, Czech Republic, June. Association for Computational Linguistics.
Sze-Meng Jojo Wong and Mark Dras. 2009. Contrastive Analysis and Native Language Identification. In Pro-ceedings of the Australasian Language Technology As-sociation Workshop 2009, pages 53–61, Sydney, Aus-tralia, December.