Redox Switching and Oxygen Evolution at Hydrous Nickel Oxide Films in Aqueous Alkaline Solution
M.O’Briena, L. Russella, I. Godwina, R.L. Doylea, and M.E.G. Lyonsa
a
Trinity Electrochemical Energy Conversion and Electrocatalysis (TEECE) Group, School of Chemistry & CRANN, Trinity College Dublin, Dublin 2, Ireland.
The redox switching reaction and the oxygen evolution reaction at multi-cycled nickel oxy-hydroxide films in aqueous alkaline solution are discussed. The hydrous oxide is considered as a porous assembly of interlinked octahedrally coordinated anionic metal oxyhydroxide surfaquo complexes which form an open network structure. The latter contains considerable quantities of water molecules which facilitate hydroxide ion discharge at the metal site during active oxygen evolution. The dynamics of redox switching has been quantified in terms of a diffusive frequency using the Laviron-Aoki diffusion model. Steady state Tafel plot analysis has been used to elucidate the kinetics and mechanism of oxygen evolution with slopes of ca. 60 mVdec-1 and ca. 120 mVdec-1 at low and high overpotentials respectively, whereas the reaction order with respect to hydroxide ion activity remains invariant at ca. 1.0 as the potential is increased. These observations are rationalized in terms of a kinetic scheme involving surfaquo groups.
Introduction
The oxygen evolution reaction (OER) is the anodic reaction that accompanies, in aqueous electrolytes, commerically important cathodic processes such as metal electrowinning and hydrogen production via alkaline water electrolysis. For the latter process, the anodic overpotential is the major factor in limting operational efficiency (1). The optimal oxygen evolution anode materials are RuO2 and IrO2, since these
oxides exhibit the lowest overpotentials for the reaction at practical current densities. The high cost of these materials and their poor long term stability in alkaline solution, renders their widespread commercial utilisation both uneconomical and impractical (2). Nickel and its alloys have therefore become the anodes of choice for water electrolysis (1,2). Although the OER overpotential is higher than for RuO2 or IrO2,
inter-metallic alloys (often containing significant amounts of Ni, Co or Fe), electrodeposited Ni (NiOx) and Co (Co3O4) oxides, and mixed oxides, including
spinels(particularly nickelites, cobaltites and ferrites) and perovskites. While the relatively high activity of nickel hydroxide electrodes for the OER is welcome in alkaline electrolyser applications, it is a drawback where this material is utilised as the positive electrode in secondary alkaline batteries (e.g. Cd, MH and Ni-MH2) since it facilitates “self discharge” and consequently leads to a decrease of
charge storage capacity (4,5). Thus in contrast to electrolyser anode research, work in the battery area has been directed towards increasing the OER overpotential at nickel hydroxide electrodes. This has been achieved by the addition of cobalt hydroxide to the nickel hydroxide (6), however, depending on the amount of incorporated Co, this procedure can actually improve OER catalytic activity (7). These oxides have been prepared from inorganic precursor materials using a wide variety of approaches, including thermal decomposition, spray pyrolysis, sol-gel routes and freeze drying, precipitation or electrodeposition from solution.
Despite all this intense activity the mechanism of the OER at first row transition metal oxide surfaces remains controversial. The experimental confirmation that a common OER mechanism pertains for these materials would be a significant aid in the eventual development of a general predictive theory of OER electrocatalysis for such materials.
In the present paper we examine the mechanism both of redox switching and anodic oxygen evolution at oxidized nickel electrodes in alkaline solution using a combination of steady state polarization techniques and reaction order studies. In this sense redox switching refers to the potential induced change in oxidation state involving the linked oxymetal groups which constitute the metal oxide film and give rise to the characteristic charge storage and supercapacitive behaviour associated with such films. We propose a mechanism for the OER which specifically takes the nature of the electrochemically generated hydrous oxide film that is present on the surface of the Ni electrode during active oxygen evolution into account. This work follows on from our recently published studies on the interfacial redox chemistry, redox switching mechanism and OER electrocatalytic activity of oxidized transition metal electrodes (8-10) and iron electrodes modified with microdispersed hydrous oxy hydroxide films (11-16).
Experimental
All experiments were conducted in a conventional three electrode cell. The working electrode was constructed from 1mm thick polycrystalline nickel foil (as supplied by Alfa Aesar-Johnson Matthey, purity 99.9945% (metals basis)) with a geometric surface area of 0.16 cm2. Prior to each experiment the surface of the working electrode was polished with 1200 grit carbimet paper, dipped in H2SO4, wiped, and
polished with a slurry of 0.3 micron alumina powder until a “mirror bright” finish was achieved. A platinum wire electrode (CH Instruments, cat no. CHI 115) was employed as the counter electrode and a mercury-mercuric oxide (Hg/HgO) reference electrode (CH Instruments, cat no. CHI 152) was utilised as the reference standard, therefore all voltages are quoted against this reference electrode1. When used in
1
The equilibrium potential of the cell Pt/H2/OH-/HgO/Hg is 0.926 V at 298 K. Since the equilibrium
NaOH solutions of different concentrations, the potential of the Hg/HgO electrode was checked relative to a second Hg/HgO, 1 M NaOH electode, both before and after the experiment. No significant potential drift was noted after such experiments, implying that the concentration of the NaOH in the reference electrode chamber remains effectively constant over the time scale of typical polarisation measurements. In any case, the 1M NaOH solution in the reference electrode, was changed regularly to ensure experimental consistency.
Aqueous NaOH solutions (in the range between 0.1 and 5.0 M) served as both the electro-polymerisation medium and the supporting electrolyte for the redox switching and electrocatalytic studies. This solution was prepared from sodium hydroxide pellets (Sigma-Aldrich, minimum 99% purity) using Millipore water (resistivity > 15 MΩ cm). Before commencing each experiment, nitrogen gas was bubbled through the electrolyte solution for 20 min.
The electrochemical measurements were performed using a number of high performance digital potentiostats including a BAS 100B Electrochemical Analyser and a CH Model 760 D Bi-potentiostat system. Both workstations were controlled by high end desktop Personal Computers (Dell). The uncompensated solution resistance was determined using a method developed by He and Faulkner (17). Typically the uncompensated solution resistance (90% compensation level) varies from ca. 0.30 Ω for [OH-] = 5.0 M to ca. 4.3 Ω for [OH-] = 0.1 M. This parameter was specifically considered in the Tafel plot measurements, where the data is presented in iR compensated form. Unless otherwise specified, all values of current density are normalised with respect to the geometric surface area.
Charge storage capacity (redox capacity), Q, were determined via integration of the peaks recorded in the voltammetric profiles at slow sweep rates. The redox capacity is directly proportional to the layer thickness. The polymeric Ni oxy-hydroxide films were prepared via multi-cycling the Ni electrode between the switching potentials of -1.450 V and 0.65 V at a scan rate of 0.15 V s-1. Films of different thicknesses were prepared by varying the number of growth cycles. The charge storage capacity or redox capacity (Q) was determined, following the growth of each film, by integration of the peaks in a voltammetric profile recorded at a slow sweep rate (40 mV s-1). The redox capacity is directly proportional to the layer thickness. Tafel plots were recorded for each film using linear sweep voltammetry performed at a sweep rate of 1 mV s-1.
Results and Discussion
Hydrous Oxide Growth via repetitive potential sweep multicycling (RPSM)
aqueous solution of appropriate pH. The type of potential perturbation used for oxide growth – sinusoidal, square or triangular wave- apparently makes little difference. Indeed the triangular wave is most convenient as changes in the current vs potential response (the voltammogram) can be employed during the oxide growth reaction to monitor changes in redox behavior associated with the latter (22), although Arvia and co-workers (23) contend that a repetitive square wave potential pulse is also very effective for the controlled generation of hydrated metal oxy-hydroxide films on metallic supports, especially if one wishes to form relatively thick oxide films.
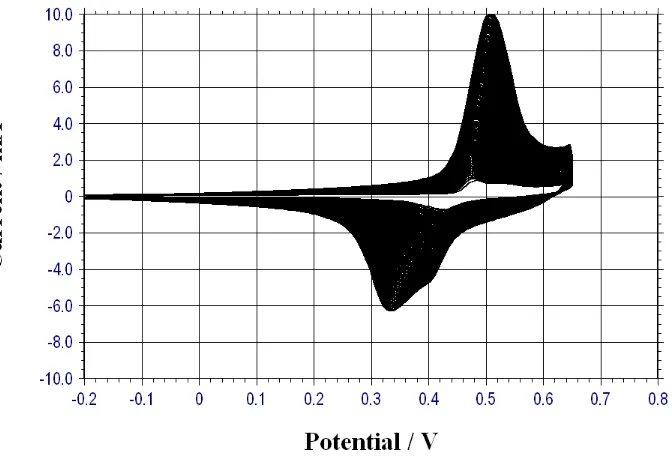
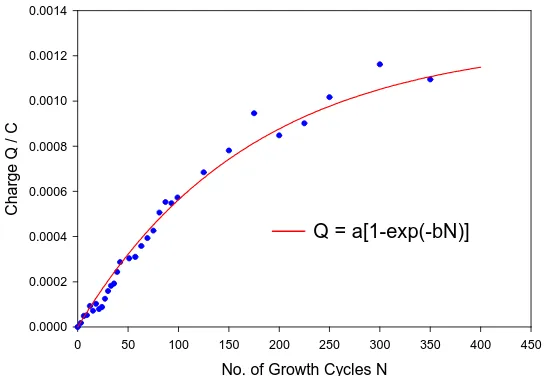
The growth of a hydrous oxide film on an initially bright Ni substrate in 1.0 M NaOH is presented in fig.1. A set of redox peaks located in the potential region 0.40 – 0.50 V vs Hg/HgO) become increasingly more developed with increasing number of potential cycles. The integrated charge developed under either the anodic or cathodic peak can be used as a measure of oxide film thickness. The variation of oxide charge capacity Q with number of oxide growth cycles N is presented in fig.2.
Figure 1. Growth of hydrous nickel oxide thin film on Ni support electrode monitored via analysis of the evolution of the real time voltammogram in 1.0 M NaOH. Growth potential limits: - 1.45 to 0.65 V (vs Hg/HgO), sweep rate 150 mV/s.
The oxide growth kinetics can be fit to the following empirical expression:
[
]
(
1 exp)
Q=a − −bN (1)
where a and b are empirical constants with numerical values determined via NLLS fitting
predicted as 5
0.0014 7.43 10
[image:4.612.144.480.262.491.2]Figure 2. Growth of hydrous nickel oxide thin film on Ni support electrode monitored via analysis of the evolution of the real time voltammogram in 1.0 M NaOH. Plot of integrated voltammetric charge Q (measured at 40 mV/s) as a function of oxide growth cycles N.
As outlined in figure 3 and figure 4, a characteristic feature of the voltammetric response of multicycled oxidized nickel electrodes in aqueous base is a well defined set of peaks corresponding to a Ni(II/III) redox transition within the deposited hydrous oxide film located at potentials just prior to the onset of active oxygen gas evolution. The set of redox peaks may exhibit some fine structure. The voltammetric response recorded for a multicycled nickel electrode (N = 30 cycles) in 1.0 M base is presented in figure 3 whereas the corresponding profile for an electrode after 120 cycles is outlined in figure 4.
Figure 3. Typical voltammetric response recorded for a hydrous nickel oxyhydroxide thin film on Ni support electrode grown in aqueous 1.0 M NaOH for N = 30 cycles. Sweep rate, 40 mV/s.
No. of Growth Cycles N
0 50 100 150 200 250 300 350 400 450
C
h
a
rg
e
Q
/
C
0.0000 0.0002 0.0004 0.0006 0.0008 0.0010 0.0012 0.0014
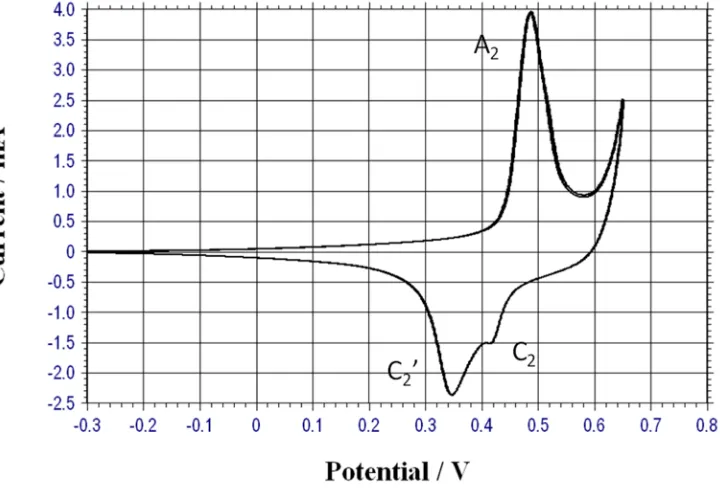
[image:5.612.169.441.68.256.2] [image:5.612.154.465.453.663.2]Figure 4. Typical voltammetric response recorded for a hydrous nickel oxyhydroxide thin film on Ni support electrode grown in aqueous 1.0 M NaOH for N = 120 cycles. Sweep rate, 40 mV/s.
For the thinner nickel oxy-hydroxide film an anodic peak (A2) at 0.48 V and an anodic
shoulder (A2’) at 0.54 V may be observed during the forward oxidative sweep whereas on
the reverse reductive sweep two cathodic peaks are visible, the first (labeled C2) located
at 0.46 V and the second (C2’) at 0.36 V. In contrast only a single well defined anodic
peak (A2) is observed at 0.50 V during the oxidative sweep and a well resolved cathodic
doublet at potentials of ca. 0.44 V (C2) and 0.34 V (C2’) for thicker oxide films (figure 4,
N = 120 cycles).
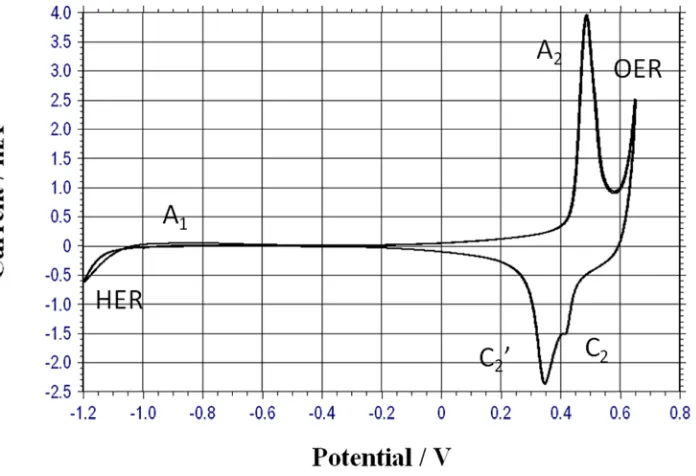
We have shown recently (24) that Ni electrodes oxidize at low potential when subjected to a potential sweep in the region – 1.2 to -0.20 V in 1.0 M NaOH where a distinct pair of peaks A1 and C1 may be discerned. The initial stage of oxide growth
involves the formation of a compact nickel oxide film. It is almost universally agreed that the lower anodic peak observed in the potential region between -0.6 V and – 0.8 V is principally associated with the oxidation of metallic Ni(0) to Ni(II) species. By analogy with the situation found at low potentials for Fe in base [15,16] we can visualize the following sequence of reactions at low potentials:
Ni + OH-→ NiOH(ads.) + e- (2)
NiOH(ads.) + OH-→ Ni(OH)2 + e- (3)
NiOH(ads.) + OH-→ NiO(ads) + H2O + e- (4)
[image:6.612.131.491.86.331.2]redox charge storage peaks, Burke and Twomey (25) observed a pH invariant cathodic peak at potentials some 0.3 V lower than the anodic peak. We have observed similar peaks as recently noted (24). We have noted a distinct pair of peaks (A1 and
C1) at low potentials in the region – 0.6 to -1.0 V (vs Hg/HgO) irregardless of
whether the nickel electrode has been subjected to a potential multicycling perturbation or not. The cathodic peak C1 is observed provided the upper limit of the
potential sweep is reversed at a potential (ca. – 0.2 V) far from the onset of the development of the main charge storage peaks (the latter occur at E > 0.2 V).Based on the variation of the voltammetric peak potential with changes in pH in alkaline solution (typically the redox potential for the anodic reaction decreases by ca. 13 mV per unit change in pH with respect to a pH independent reference electrode), Burke and Twomey (25) proposed that both oxidation and hydrolysis processes were operative in this region, leading to the formation of a species with anionic character which was tentatively assigned, for purposes of rationalization, the formula Ni(OH)2.40.4 -. The reaction sequence proposed by the latter workers was:
Ni + 2 OH-→ Ni(OH)2 + 2 e- (5)
Ni(OH)2→ [NiO0.4(OH)1.6]0.4- + 0.4 H+ (6)
Note that eqn.6 may be represented as a hydroxide ion adsorption step since the reaction occurs in alkaline solution:
Ni(OH)2 + 0.4 OH-→ Ni(OH)2.40.4- (7)
Hence in very simple terms the net anodic reaction corresponding to peak A1 can be
represented as:
Ni + 2.4 OH-→ [Ni(OH)2.4]0.4 – (8)
When the anodic limit of the potential sweep was maintained well below the upper redox charge storage peaks, Burke and Twomey [25] observed a pH invariant cathodic peak at potentials some 0.3 V lower than the anodic peak.We agree with the conclusion proposed by Burke and Twomey [24] that the reversal in sweep direction at low potentials causes the initially produced hydrous oxide species to transform to a more anhydrous form, such as to NiO say. Hence the C1 reduction peak could be due
to:
NiO + H2O + 2e-→ Ni + 2 OH- (9)
In essence the Burke-Twomey (25) proposal is that due to post electrochemical place exchange reactions, the anionic oxide becomes neutral before being reduced back to Ni metal. They also suggest that that the lower oxidation peak appears to be superimposed on a background current that is probably due to a combination of adsorbed hydrogen oxidation and formation of a layer of adsorbed hydroxyl species. In an ellipsometric study de Souza et al.(26) found that the first layer of oxide formed at potentials close to the lower anodic peak A1 consists of NiO. However this
becomes covered with a thick film of Ni(OH)2 upon further increase of potential. A
position of the lower anodic peak did not alter much with repetitive potential cycling. Our previously reported data (24) support this observation. We therefore support the Burke-Twomey (25) contention that it is the inner, compact oxide layer that is reduced at significant cathodic potentials, and thus, even on cycling, the A1 peak is
associated with oxidation of Ni metal to Ni(II) at the metal/porous hydrous oxide interface.
We have previously noted (27) that even though it is directly produced in the initial electrochemical oxidation process, the anhydrous film is probably not the most stable metal oxidation product in the aqueous medium but it may be regarded as an intermediate or metastable product in the formation of a hydrous oxide layer. In the anhydrous film ions are held in a rigid manner in an extended network of polar covalent bonds which drastically reduce ion transport through (and consequently extension of) the surface layer. The next stage of the film thickening process, the hydration reaction, is generally very slow, because as in phase transformation reactions, it involves rupture of primary coordination metal-oxygen bonds. It has been shown (27) that the extent of hydrous oxide growth depends strongly on the value chosen for the upper and lower limit of the potential sweep as well as on the cycling frequency adopted, the solution temperature and the solution pH.
The marked dependence of oxide growth rate on the lower limit of the potential
sweep (found for a wide number of noble and non-noble transition metals) is indicative of the essential role that partial reduction of the anhydrous oxide plays in the production of a thick deposit. Partial reduction of the compact oxide layer apparently facilitates rearrangement of oxycation species at the metal surface, leaving it in a somewhat disrupted state. It is established that in the case of both platinum (28) and gold (28, 29) the anhydrous film is reduced much more readily than the hydrated film. The greater stability of the latter is possibly due to a variety of reasons such as lower repulsion between cations owing to greater separation and decreased charge (the latter effect being due to hydroxyl ion coordination by cations present) and polymer formation. Indeed it has been established that in the case of metal-gas interactions (30) the adsorption-desorption process effects displacement of atoms in the outer layer of the metallic phase, and that potential cycling causes roughening of the surface of noble metals such as platinum under certain conditions (31).
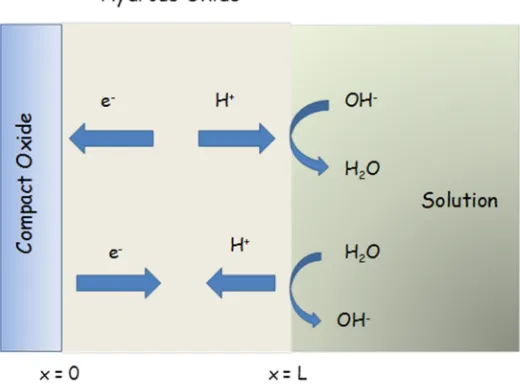
On subsequent re-oxidation of the partially reduced metal surface the compact layer is restored but the outer region of the compact film is present in a more dispersed form. On further reduction the latter material becomes incorporated into the hydrated outer layer. It is not clear whether this rearrangement process involves detachment of oxycations, i.e. a dissolution-reprecipitation mechanism, or a certain weakening, with only a partial detachment of oxycation binding in the compact oxide layer. In the latter case the partially reduced cations are assumed to be displaced from normal lattice sites, and, as such, are more susceptible to oxidation in the subsequent anodic sweep during which they complete their oxygen coordination shell of six oxygen atoms to form a rather open polymeric inorganic bronze or zeolite type structure. Hence under conditions of thick film growth the interfacial region may be represented by : M/MOx/MOa(OH)b(OH2)c/aqueous phase as is outlined in figure 5.
This is the duplex layer model of the oxide/solution interphase region. Here MOx
represents the inner compact layer and MOa(OH)b(OH2)c denotes the outer hydrous
layer. This model was first suggested by Burke and O’Sullivan (32). Hence the appearence of the lower anodic peak A1 and the enhanced hydrous oxide growth
when the lower limit of the potential sweep is set at a magnitude sufficiently cathodic to ensure extensive reduction at the compact/support electrode interface.
Figure 5. Duplex layer model of oxide/solution interface region following Burke and O’Sullivan (32).
Figure 6. Typical voltammetric response recorded for a hydrous nickel oxyhydroxide thin film on Ni support electrode grown in aqueous 1.0 M NaOH for N = 120 cycles. Sweep rate, 40 mV/s. Voltammetric response recorded between limits of hydrogen and oxygen evolution.
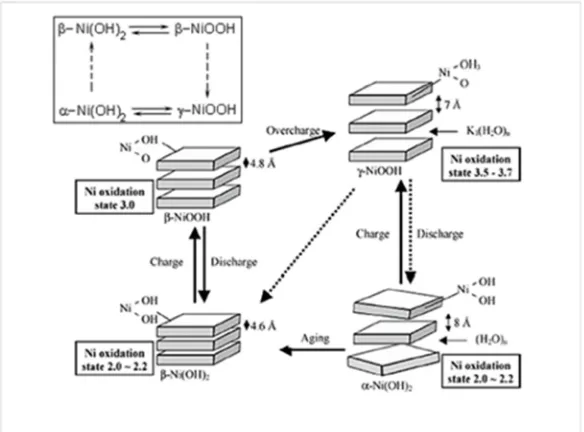
[image:9.612.155.461.95.308.2] [image:9.612.141.489.377.615.2]nickel oxide films was rationalized in terms of four phases as outlined in figure7. The discharged or reduced Ni(OH)2 material can exist either as a largely anhydrous phase
designated as β – Ni(OH)2 (denoted β-Ni(II)) or as a hydrated phase denoted as α
-Ni(OH)2 (in short represented as α-Ni(II)). Oxidation of the β-Ni(II) material is
envisaged to produce a phase referred to as β-NiOOH or β-Ni(III). In contrast oxidation of the α-Ni(II) material produces γ-Ni(III) or γ-NiOOH. Hence one expects two distinct redox transitions : β(II)/β(III) and α(II)/γ(III). The corresponding redox peaks are designated A2’/C2’ and A2/C2 respectively.
We note from figure 7 that upon ageing, especially in more concentrated alkali solution, the α-Ni(OH)2 can dehydrate and re-crystallize as β-Ni(OH)2 . Furthermore,
upon overcharge (which occurs at more elevated potentials) β-NiOOH can convert to γ -NiOOH. The non-stoichiometric nature of both the discharged and charged material is indicated by the average oxidation state of Ni in each phase as indicated in the structural representation of the various phases in the schematic presented in fig.7. It is important to note that while there is a general acceptance for the general features of the Bode scheme, one must understand that it is inappropriate to think about the formation of a compound or a phase with definite stoichiometry during the chemically complex Ni(OH)2/NiOOH
[image:10.612.161.453.352.568.2]transformation. Instead the four phases mentioned in the Bode scheme should be considered as the limiting forms of the divalent and trivalent materials – the actual composition of the oxide at a given potential depending on a range of factors including its history, method of preparation, degree of hydration, defect concentration etc.
Figure 7. Representation of simple Bode Scheme of Squares for nickel oxide (33).
hydrous oxide systems – in these cases the potential/pH shift differs from the expected 0.059V/pH unit at 250C. The mathematical treatment of this situation is beyond the scope of the present paper, but suffice to say, the phenomena have recently been qualitatively summarized (33). Thus, a zero potential shift (with respect to a pH dependent reference electrode) implies that both the reactants and the product possess the same net charge. A positive potential shift with pH, is indicative of an oxidised state that is more positive than the reduced state, whereas the converse is true in the case of an observed negative potential/pH shift.
The variation in voltammetric response profiles and individual A2, C2 and C2’
peak potentials with changes in solution pH are presented in figure 8. Note that peak A2’ was not observed. As previously shown (33) that the anhydrous A2’/C’2 peaks
exhibit a regular Nernstian shift whereas the hydrous counterparts A2/C2 exhibit the
characteristic of a hydrous or hyper-extended oxide (33), i.e. a super-nernstian
potentialpH shift, which typically has the value of dE/dpH = 2.303(3RT/2F) =
-0.088V/pH unit at T = 298 K. Accordingly, by analogy with a scheme produced by Burke and Whelan (34) for redox switching of iridium oxide films, it has been proposed that the main redox switching reaction (corresponding to the peak set A2/C2
may be written as:
[Ni2(OH)6(OH2)3]n2- + 3nOH-→ [Ni2O3(OH)3(OH2)3]n3- +3nH2O + 2ne- (10)
corresponding to a Ni(II)/Ni(III) redox transition in a polymeric microdispersed hydrous oxide layer. This redox switching reaction is illustrated schematically in scheme A below.
Figure 8. (a) Typical voltammetric response recorded for a hydrous nickel oxyhydroxide thin film on Ni support electrode grown in aqueous 1.0 M NaOH for N = 120 cycles. Sweep rate, 40 mV/s. Voltammetry recorded in solutions of various pH values. (b) Variation of voltammetric peak potentials with solution pH.
Dynamics of redox switching
We now consider the results of a series of experiments, conducted to quantify the rate of charge percolation through the hyrated layer. The redox switching reaction (associated with the A2/C2 voltammetric peaks) reflects the change in oxidation state
of the film as a result of a potential perturbation. Redox centres immediately adjacent to the support electrode are directly affected by the electrode potential, whereas charge is further propagated along the oxy-nickel polymer strands in the hydrous layer via a sequence of electron self exchange reactions between neighbouring oxy-metal sites. This process is envisaged to be analogous to redox conduction exhibited by electroactive polymer films. In the simplest terms this electron “hopping” may be modelled in terms of a diffusional process, and so the charge percolation rate may be quantified in terms of a charge transport diffusion coefficient, DCT. In the case of
hydrous nickel oxide, the latter may reflect either the electron hopping rate or the diffusion of of OH- (or equivalently H3O+) ions via a rapid Grotthus type mechanism.
The charge transport diffusion coefficient may be quantitatively estimated using cyclic voltammetry.
As previously noted the charge/discharge reaction involving a Ni(II)/Ni(III) redox transition within the hydrous oxide is simplistically viewed as a Ni(OH)2/NiOOH
Figure 9. Schematic representation of charge/discharge redox switching mechanism occuring within the microdispersed hydrous nickel oxide layer. The thickness of the hydrous layer is L. The redox switching mechanism involves proton diffusion within the film coupled with chemical reaction at the outer interface.
We now examine the redox switching behaviour of the hydrated nickel oxide electrode in aqueous base to a potential sweep perturbation. Although we have noted in a previous communication (24) that the redox switching process may be somewhat more complex, we will attempt to apply a simple first order finite diffusion model to obtain quantitative transport information pertaining to the proton diffusion coefficient through the hydrous layer. In the present work we utilise the mathematical formalism of Aoki and co-workers (42) and extended by others (43), to derive an expression for the inverse diffusive time constant τD−1=D L2 . These workers solved the finite diffusion problem under conditions of a linear potential sweep. Transport information may be readily extracted from an analysis of the shape of the voltammetric response as a function of sweep rate. We have recently reported the utilization of this analysis to examine the redox switching process for multicycled iron electrodes in aqueous base (33).
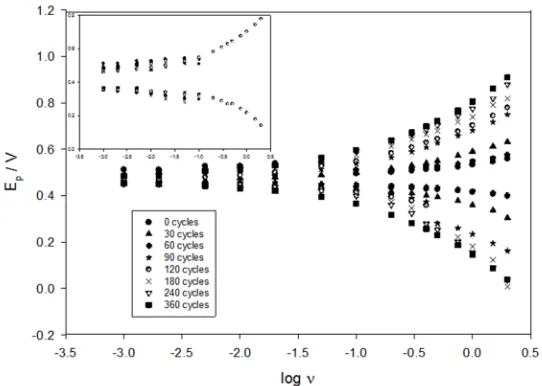
[image:13.612.177.437.67.262.2]Figure 10. Variation of voltammetric peak potential with log sweep rate for a series of multicycled Ni electrodes in 1.0 M NaOH at 298 K. Attention is focused on the main anodic and cathodic charge storage peaks corresponding to the Ni(II)/Ni(III) redox transition located at potentials prior to active oxygen evolution.
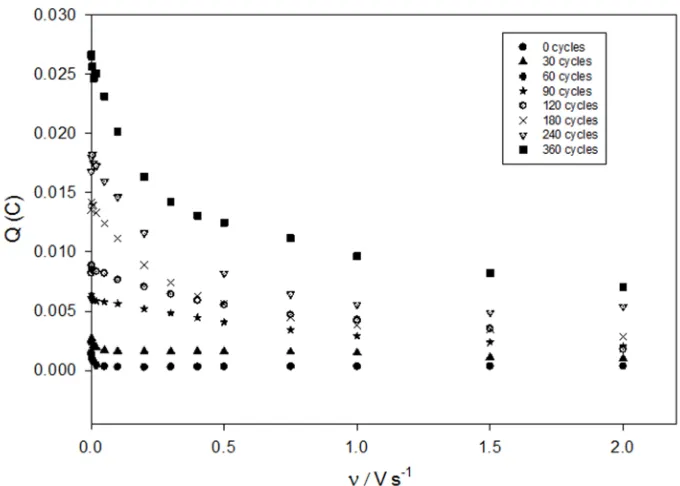
In short, when the diffusive charge percolation process is reversible the voltammetric peak potentials will remain invariant with changes in sweep rate. In this way we define the time window in which the electrochemical reversibility pertains. We note that the peak potential begins to shift significajntly with increasing sweep rate for values greater than 1 Vs-1. Between 0.3 Vs-1 and 1.0Vs-1 an intermediate transition region is observed. Below 0.3 Vs-1 the peak potential remains invariant with sweep rate and the redox switching reaction is regarded to be kinetically reversible. The variation of hydrous oxide charge capacity Q (which is proportional to the redox charge capacity C defined for electroactive polymer films in the work of Murray et al (44,45], with analytical sweep rate is presented in fig. 11. We note that the recorded charge capacity values for reasonably thin oxide films (less than 60 cycles growth) remain invariant with sweep rate between 2 Vs-1 until ca 10 mVs-1, and then increase slightly as the sweep rate is decreased further. This trend is most marked for thicker films (180 cycles growth and greater). Indeed for a thick nickel oxide layer it may be noted that the charge capacity increases by nearly 50% when the sweep rate in decreases from ca. 1 Vs-1 to ca. 10 mVs-1. A similar result has been recently noted for hydrous iron oxide films in base (33).
Figure 11. Variation of voltammetric redox charge capacity Q with analytical sweep rate for a series of Ni oxide hydrous films grown under potential cycling conditions for various number of cycles. Attention is focused on the main anodic charge storage peak corresponding to the Ni(II)/Ni(III) redox transition.
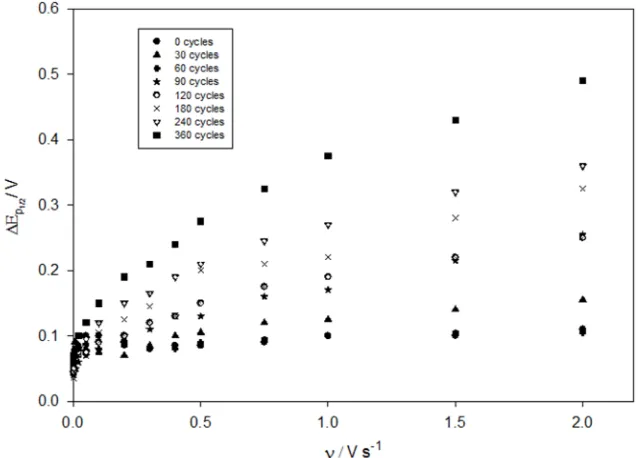
The variation of voltammetric peak width at half peak height for the main anodic charge stroage peak A2 with sweep rate is outlined in fig.12. We present data for a
[image:15.612.132.472.69.312.2]Figure 12. Variation of peak width at half peak height with sweep rate for a series of multicycled nickel electrodes in 1.0 M NaOH.
Lyons (46) has noted that the peak width at half peak height ∆Ep2value extracted from the voltammogram recorded for an electrode chemically modified with an electroactive polymer thin film conveys very useful information about the electrochemistry of redox switching in the layer. Similar considerations arise in the present case. Laviron (47) has developed a useful theory to describe redox switching within space distributed electroactive redox polymer films where charge is transferred via nearest neighbour electron hopping both intrastrand and interstrand. The analysis has been further extended by Aoki and co-workers (42). These models enable the cyclic voltammetric response to be analysed quantitatively as a function of sweep rate. In particular these models enable a prediction to be made concerning the shape of the voltammetric response both for reversible, totally irreversible and indeed quasi-reversible redox switching reactions occuring both in monolayer and multilayer modified electrodes thin films, both in the absence of and in the presence of interactions between the participating redox centers. These models have been well described by Lyons (46). In the latter models, if it is assumed that redox switching is electrochemically reversible then the peak width at half peak height is assumed to be given by:
(
)
/ 2
2 3.53
ln 3 2 2
p
RT RT
E
nF nF
∆ = + = (11)
[image:16.612.144.463.70.299.2]considered. Occupied redox sites with repulsive interactions tend to avoid one another, which ultimately promotes an alternating site occupancy; this is essentially the same as compound formation. This effect results in a broadening of the voltammetric peak response compared with that expected ideally as outlined in eqn.11 for a reversible reaction. In contrast when the interactions are attractive, occupied sites tend to cluster together, which leads to phase separation and considerable narrowing in the voltammogram compared with the ideal. In electroactive polymer materials the extent of peak broadening or narrowing depends to a great extent on the nature of the solvent and the identity and concentration of the charge compensating counterions.
According to Aoki (42) the peak width is related to an empirical interaction parameter σas follows:
/ 2 2 1 ln 1 p RT E nF ρ ρσ ρ + ∆ = − −
(12)
In the latter expression we note that σ =gcΣ = Γg L=G RT where g denotes the Temkin interaction parameter which is negative if repulsive interactions operate and positive if attractive interactions pertain, and G denotes the Gibbs energy of interaction between the redox sites 2 . Furthermore, cΣ = Γ L denotes the site concentration within the hydrous layer, and Γ, Lrepresents the surface coverage and layer thickness respectively. Furthermore we note that:
2 4 σ ρ σ − = − (13)
Under reversible conditions the voltammetric peak corresponding to the redox switching reaction within the hydrous oxide layer is identical in shape to the theoretical reversible monolayer peak for reasonably slow sweep rates3. The fact that the peak width at half peak height indicates that the voltammetric peaks exhibit an increasingly more prominent ‘tailing’ effects as the experimental timescale decreases, in which the peaks exhibit an increasing asymmetry about E-Ep. The latter occurrence may be attributed to the fact that
there is not enough time at faster sweep rates at the beginning of the scan for the redox reaction to propagate through the film. This of course is a diffusive effect.
Aoki (42) has shown that the voltammetric response for a thin film in which the redox reaction is reversible takes the following form:
(
)
(
)
( )
( )
(
)
(
)
(
)
1/2 2 2 0 exp 0, , 1 exp Wyi nFA L nFD RT W y dy nFA L nFD RT F W
Wy
ξ τ
υ θ υ ξ
ξ τ
∞ −
= Γ = Γ
+ −
∫
(14) In the latter expression we have set:
2 If g = 0 the peak has the shape and characteristics of the ideal Langmuirian voltammetric peak. If g < 0,
the peak becomes broader and flatter, and if g > 0, with 0 < g < 2, the peak becomes narrower and sharper. If g > 2 a hysteresis phenomenon is exhibited and the peaks can no longer be described mathematically.
3 This is given by the expression 2
[
]
[ ]
(
[ ]
)
2sech ξ 2 exp ξ 1 exp ξ
Ψ = = − + − where the normalized
current response is given by Ψ =i nF A
(
2 Γυ/RT)
and the normalized potential is0
( )
nF E E RT
(
)
(
)
( )
( )
(
)
1/2 2 2 0 exp , 0, 1 exp WyF W W y dy
Wy ξ τ ξ θ ξ τ ∞ − = + −
∫
(15) Furthermore, we note that:( )
(
0)
2i
nF nFL
E E
RT RT
υτ
ξ τ = − + (16)
Also we define τ =Dt L2, and we introduce the Theta function as:
(
)
( )
22
1 1
0, 1 2 1 expk
k k y y y θ π ∞ = = + − −
∑
(17)We also note that the parameter W is given by:
2 2 D nFL L W DRT X
υ
= =
(18)
And the diffusion layer thickness is:
D
DRT X
nFυ
= (19)
Hence we note that the parameter W is simply the ratio of the layer thickness to the diffusion layer thickness in the film. Now the general expression outlined in eqn.38 cannot be integrated analytically, so one must resort to a numerical analysis in order to compute the shape of the voltammogram. However eqn.14 must reduce to the surface voltammetic limit when W is small and to the semi-infinite Randles-Sevcik limit when the parameter W is large. Hence:
(
)
{
}
[ ]
[ ]
(
)
(
)
[ ]
[ ]
(
)
1/ 2 2 2 2 0 0 exp exp , 0,1 exp 1 exp
W
Lim W F W ξ ξ θ y dy ξ
ξ ξ ∞ − → − − → →
+ −
∫
+ − (20)The result presented in eqn.20 is obtained since we note that:
(
)
{
(
( )
)
}
{
1/ 2}
2 2
0 0
0
0, 0, tanh 1
p p
y dy Lim L Lim p p
θ θ τ
∞ − → → = = =
∫
(21)Where p is the Laplace parameter. Furthermore if W is large enough such that semi-infinite diffusion conditions pertain, then in this case we can show that the Theta function in eqn.17 reduces to:
(
)
2 1 0, y y θ π ≅ (22)And the expression for the current reduces to:
(
)
[
]
[
]
(
)
1/2 2 0 exp 1 exp Wy nFDi nFA L y dy
RT Wy ξ πυ ξ ∞ − − ≅ Γ + −
∫
(23)This integral equation is essentially similar in form to that derived many years ago by Nicholson and Shain and others (48,49). The latter integral may be evaluated numerically and we may readily show that the peak current is given by:
1/2 1/ 2 2 0.4463 P nF D i nFA
RT L υ
= Γ
This is the well established Randles-Sevcik expression characteristic of semi-infinite diffusion. Hence the diffusive time constant τD =D L2can be evaluated from the slope of the Randles-Sevcik plot.
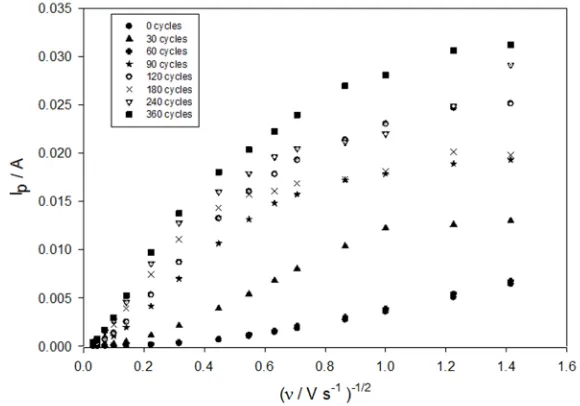
The variation of voltammetric peak current with square root sweep rate for a series of multicycled Ni electrodes in 1.0 M NaOH is outlined in fig.25 below. We note good Randles-Sevcik linearity at lower sweep rates but the current response begins to level out at higher sweep rates.
Figure 13. Typical Randles-Sevcik plots recorded for a series of multicycled Ni electrodes in 1.0 M NaOH as a function of number of oxide growth cycles.
This type of levelling out in the current response at high sweep rates can be predicted from the Aoki analysis (42). In particular, using a numerical analysis it has been shown that the peak current, ip, representing the main redox switching process in the hydrated layer varies with υ according to,
{
2}
1/ 2[ ]
0.446 tanh
P
i = nFA ΓD L W ϒ (25)
In the latter expression we note that:
0.56 W 0.05W
ϒ = + (26)
and we recall that W is defined via eqn.18. This expression may be re-cast in a non-dimensional format to produce a working curve as follows:
(
)
[ ]
1/ 2
0.446 tanh
P
i RT
nFA L nFDυ
Ψ = = ϒ
Γ (27)
The diffusive frequency 2
D D L
τ = can be readily evaluated via numerical analysis of eqn.25 via the following expression:
( )
1/2 1/ 2tanh 0
D D D P
D
G τ ατ βτ γ i
τ
−
= + − =
(28)
[image:19.612.159.449.170.373.2]( )
( )
3/ 2
1/ 2 1/ 2
0.446
0.56
0.05 nF
A RT
nF RT nF
RT
α υ
υ β
υ γ
= Γ
=
=
(29)
The roots τDof the non-linear expression G
( )
τD =0 can be obtained from a standard numerical protocol such as the Bisection algorithm (50). Hence the diffusive frequency2
D D L
τ = can be evaluated provided the peak current i and surface coverage P Γ are known at a particular sweep rate υ. Furthermore if the layer thickness L can be estimated then the diffusion coefficient D can be evaluated.
We have used both eqn.28 and a Randles-Sevcik analysis to numerically evaluate the diffusive frequency 2
D D L
τ = . The results are compared graphically in figure 14 for a series of multi-cycled Ni electrodes. We see that similar results are obtained using the two procedures. The diffusive frequency decreases smoothly with increasing number of oxide growth cycles N from a value close to 1.0 s-1 for the thinnest nickel oxyhydroxide films to ca. 0.2 s-1 for layers formed after ca. 360 cycles. We also have not estimated the layer thickness L in order to compute a charge transfer diffusion coefficient given the approximations and uncertainties inherent in layer thickness estimation. Instead we are content to deal with the diffusive frequency given by τD =D L2 .
Figure 14. Variation of diffusive frequency characterizing redox switching in multicycled hydrous oxide coated Ni electrodes in 1.0 M NaOH with number of oxide growth cycles.
[image:20.612.163.452.425.634.2]OER kinetics and mechanism
In this section we describe the results of a comprehensive kinetic analysis carried out at hydrous oxide coated Ni electrodes in aqueous alkaline solution. These studies were performed both as a function of base concentration and hydrous oxide layer thickness. These studies follow on from a recently published paper (33) which describes enhanced oxygen evolution at hydrous oxy-hydroxide modified iron electrodes in aqueous alkaline solution. We also refer to an earlier paper written by Lyons and Brandon (8) which describes the OER mechanism and kinetics at oxidized (but not potential multicycled) Ni electrodes in base.
Typical steady state polarization curves for the OER recorded at a series of multicycled Ni electrodes in 1.0 M NaOH solutions are outlined in fig. 15. It is clear from these plots that the slope of the linear Tafel region located between 0.6 V and 0.7 V remains invariant with oxide charge capacity (the latter being related to the number of oxide growth cycles). Furthermore the current recorded at a given potential increases with increasing oxide charge capacity and the potential recorded at a fixed current decreases with increasing oxide charge capacity.
Figure 15. Typical steady state polarization curves (iR corrected) for active oxygen evolution at a series of multicycled Ni electrodes in 1.0 M NaOH solution at 298 K.
[image:21.612.162.438.324.523.2]Figure 16. Variation of OER current recorded at a series of fixed over-potentials in the linear Tafel region as a function of average oxide charge capacity Q. Tafel plots were recorded in 1.0 M NaOH.
Figure 17. Variation of OER Tafel slopes recorded at low overpotentials with hydrous oxide charge capacity value Q. Tafel plots were recorded in 1.0 M NaOH.
[image:22.612.165.451.349.543.2]Figure 18. Typical Tafel plots for active oxygen evolution recorded for a hydrous oxide coated Ni electrode (N = 30 growth cycles in 1.0 M NaOH) as a function of base concentration.
Figure 19. Typical Tafel plots for active oxygen evolution recorded for a hydrous oxide coated Ni electrode (N = 120 growth cycles in 1.0 M NaOH) as a function of base concentration.
[image:23.612.149.450.80.302.2] [image:23.612.152.451.388.607.2]log
1.02 log
OH
OH
d i
m
d a
−
−
= =
in the low Tafel slope region and mOH− =0.93 in the high
Tafel slope region. The corresponding values recorded for thicker films were 0.85
OH
m − = and 0.82
OH
m − = in the low and high Tafel slope regions respectively.
Hence any mechanism must rationalise a dual Tafel slope behaviour and a constant reaction order with respect to OH- ion activity of unity irrespective of overpotential. In summary, a kinetic analysis and associated reaction mechanism for the OER at both the uncycled and multicycled Ni electrodes considered in this article, must predict that b = 2.303 × RT/F and the reaction order mOH- = 1.0 at low potentials, changing to b = 2.303 × 2RT/F and mOH- = 1 at higher potentials.
Figure 20. (a)Typical Reaction order with respect to Oxygen evolution recorded for a thin hydrous oxide coated Ni electrode (N = 30 oxide growth cycles, 1.0 M NaOH) in (a) the low Tafel slope region (E = 0.64 V or η = 0.337 V); (b) the high Tafel slope region (E = 0.71 V or η = 0.407 V
Figure 21. Typical Reaction order with respect to Oxygen evolution recorded for a thin hydrous oxide coated Ni electrode (N = 120 oxide growth cycles, 1.0 M NaOH) in (a) the low Tafel slope region (E = 0.64 V or η = 0.337 V) and (b) the high Tafel slope region (E = 0.71 V or η = 0.407 V)..
[image:24.612.100.508.252.391.2] [image:24.612.97.512.466.610.2][Ni III O OH( ) m( ) ]n p OH [Ni III O OH( ) m( ) (n OH*)]p e
−+ − → −+ −
(30)
1
[Ni III O OH( ) m( ) (n OH*)]p−→[Ni III O OH( ) m( )n+ ]p− (31) ( 1)
1 1 2 2
[Ni III O OH( ) m( )n+ ]p−→[Ni III O OH( ) m( )n−]p− −− −H O +e− (32)
( 1)
1 2 2 2 2
[Ni III O OH( ) m( )n− ]p− −− −H O +2OH− →[Ni III O OH( ) m( ) ]n p−− −HO +H O e+ −(33)
2 2 2
[Ni III O OH( ) m( ) ]n p HO OH [Ni III O OH( ) m( ) ]n p O H O e
−− − + − → −+ + + −
(34)
This mechanism involves the invocation of a Ni(III) oxidation state throughout and does not suggest the formation of a Ni(IV) state. We represent the mechanistic sequence in terms of linked networked octahedral surfaquo groups in an extended microdisperse open polymeric framework in which the central metal ion (M = Ni(III)) is coordinated to hydroxyl (OH), oxide (O) and water (OH2) ligands. The second non-eletrochemical step (eqn.31) in the reaction sequence is rate determining at low overpotentials and the initial discharge step (eqn.30) becomes rate limiting at high overpotentials. The latter expression involves the relaxation of a coordinated OH ligand between two energetically inequivalent positions (labelled OH* and OH). This mechanism is similar to that recently outlined by us for hydrous oxide coated Fe electrodes in aqueous base (8,10). Again we note that p=2m+ −n 3, and the rate limiting second step again involves a structural rearrangement of an energetically in-equivalent coordinated hydroxyl ligand. Following Bockris and Otagawa (51), we also invoke the formation of a physisorbed peroxide entity S—H2O2. Note that in the step presented in eqn.32 the electron lost to the external circuit is provided by an excess co-ordinated OH- ion, leading to an overall decrease of one unit in the net negative charge of the surface complex. The suggestion that the OER mechanism involves a NI(III) hydroperoxy intermediate of the form S—HO2- is attractive and has received some experimental backing from recent spectroscopic measurements (52). In the scheme outlined in eqn.30-eqn. 34 above the catalytically active intermediate species are represented as complex anionic entities, in agreement with the observed acid/base properties of the hydrated oxide film. We believe that this approach is more realistic than thinking in terms of discrete simple stoichiometric oxy-hydroxide species.
We now wish to extend this mechanistic analysis and develop a more comprehensive mechanism which is in excellent agreement with the kinetic data. Our mechanistic thinking is guided by the earlier work of Kobussen and Broers (53). The mechanism is presented in schematic form in scheme B. Note that octahedrally co-ordinated oxy-nickel surfaquo groups are identified as the catalytically active species and are located within the hydrous layer. The following reaction sequence based on scheme B may be outlined:
ܱܵܪଶ+ ܱܪି→ ܱܵܪି+ ܪଶܱ (35)
SOH− →SOH+e− (36)
2
SOH+OH−→SO−+H O (37)
SO− →SO+e− (38)
SO+OH− →SOOH+e− (39)
2 2
SOOH+OH− →SO +H O+e− (40)
2 2
In the latter scheme S represents the surfaquo group which is attached to the hydrous oxide surface by bridging oxygen ligands.
Scheme B OER mechanism involving surfaquo groups in the hydrous oxy-nickel hydroxide layer
The proposed catalytic cycle for the OER outlined in Scheme B, involves an octahedrally coordinated Ni(III) species located in the hydrous layer. This scheme is analogous to those depicted for various different photocatalyst systems (54-56). A common feature of these schemes is that the starting point for the OER catalytic cycle is usually represented as a metal coordinated water molecule. However, in the strongly alkaline conditions used in this system it is likely that a significant proportion of these coordinated water molecules will be deprotonated. The pKa value for a water molecule coordinated to a highly charged metal atom is generally in the range pKa 5-9 (57). In light of this, it is more reasonable to assume that the initial deprotonation step is facile and will occur outside of the catalytic cycle. Hence, the initial deprotonation step is depicted as a pre-step in Scheme B and the OER catalytic cycle begins with the resultant coordinated OH− ion which we label SOH−. A second point of note regarding Scheme B is that the formation of the metal oxide SO− (eqn. 37) and metal oxo SO (eqn. 38) species are designated as rate determining. Interestingly, in a recent theoretical study Muckermann et al. (58) showed, through the use of DFT calculations, that for a GaN/ZnO surface with high coverage of adsorbed OH− ions the intermediate associated with the highest energy was an oxide radical. Similarly, Rossmeisl et al. (59) performed a DFT study of the OER at RuO2 surfaces. They too found, for a surface saturated with adsorbed OH, that the highest energy intermediate was a surface oxygen species, in this case an oxo species. Considering these studies, the present mechanistic interpretation brings together a number of strands in the current understanding of the OER at metal oxides, and is clearly more satisfying than our previous presentation.
H
y
d
r
o
u
s
L
a
y
e
r
H2O
O2 e
-OH
-e -e
-OH
-OH -OH
-OH
-H2O e-, H
2O
Low ηRDS:
T.S.=60 mV/dec
mOH-= 1
High ηRDS (θ→1):
T.S.=120 mV/dec
mOH-= 1
SOH2
SOH
-SOH
SO
-SOOH
SO
We note that the first step in the reaction sequence (eqn.35) occurs rapidly and need not be included in the steady state kinetic analysis. If we assume that the step outlined in eqn.37 is rate determining then the net reaction flux is given by:
2
4 OH SOH
fΣ =i FA=k a −Γ
(42) In the latter expression aOH−represents the activity of hydroxyl ion and Γdenotes the
surface coverage. We use the quasi steady state approximation to evaluate the surface coverage of SOH as follows:
1 1 2 0
SOH
SOH SOH
SOH OH
d
k k k a
dt − − −
Γ ′ ′
= Γ − Γ − Γ ≅ (43)
We may readily solve to obtain an expression for the surface coverage:
(
)
1 1 2
SOH k′ SOH− k−′ k aOH−
Γ ≅ Γ + (44)
Hence the net flux is given by
2 1
1 2
OH SOH
OH k k a f
k k a
− − − Σ − ′ Γ ≅
′ + (45)
In the latter expression the primed quantities represent heterogeneous electrochemical rate constants whose potential dependence is assumed to be given by the Butler-Volmer rate equation:
[
]
(
)
0 0
exp exp 1
n n n n
k′ =k β ηF RT k−′ =k− − −β Fη RT (46) In this expression ηdenotes the overpotential and βis the symmetry factor. In contrast the chemical rate constant is given by its standard value and there is no potential dependence:
0
n n
k =k (47)
Hence the net flux is given by
[
]
(
)
0 0 2 1 0 0 1 2 exp exp 1 OH SOH OHk a k F RT
f
k F RT k a
β η β η − − − Σ − Γ ≅ − − +
(48)
Now if the step outlined in eqn.37 is rate determining then we can safely assume that
0 0
2 1
k <<k− and so eqn.48 reduces to
(
)
[
]
0 0 0
2 SOH OH 1 1 exp
fΣ ≅ Γk −a − k k− Fη RT (49)
This expression can be readily shown to predict a reaction order of unity with respect to hydroxide ion activity and a Tafel slope at 298 K of ca. 60 mV/dec (b=2.303
(
RT F)
). In contrast, if the subsequent step outlined in eqn.38 becomes rate limiting then we can write that3 SO
fΣ ≅ Γk′ − (50)
Again using the quasi-steady state approximation we can show that
2
2 2 3 0
SO
SOH OH H O SO SO
d
k a k a k
dt
−
− − − −
Γ
′
= Γ − Γ − Γ ≅ (51)
Solving for the surfaquo group coverage we obtain
[
]
(
2)
0 0 0
2 SOH 2 H O 3 exp
SO− k aOH− k a− k β ηF RT
Γ ≅ Γ + (52)
Hence the net reaction flux is given by
[
]
[
]
2 0 0 2 3 0 0 2 3 exp exp SOH OH H Ok k a F RT
f
k a k F RT
Now at high overpotentials we assume that ΓSOH ≅1and also k−02 >>k30and so we obtain that
(
)
2
0 1 0 0
3 H O 2 2 OH exp
F
f k a k k a
RT
β η
−
−
Σ −
≅
(54)
Hence when the electrochemical oxo generation step is rate limiting at high overpotentials the flux expression presented in eqn.54 predicts that a reaction order of unity with respect to hydroxyl ion activity and a Tafel slope of ca. 120 mV/decade at 298 K will be observed (b≅2.303 2
(
RT F)
assuming that β ≅1 / 2 . Hence the kinetic analysis is in excellent agreement with experiment.The observation that the Tafel slope observed at low overpotentials increases with increasing hydrous oxide charge capacity is directly at variance with similar experiments performed with multicycled iron oxide electrodes in aqueous base solution (33). We are currently examining this result in detail and will report on our conclusions in a subsequent communication.
The increase in OER current (recorded at fixed driving force or overpotential) with increasing oxide redox charge capacity as outlined in fig. 16 is not to be unexpected since the real surface area of the oxide is increasing and consequently the number of catalytically active surfaquo groups available to participate in the oxygen evolution process is also increasing. We recall from the kinetic analysis that the oxygen evolution rate is directly proportional to Γ the surface concentration of Ni(III) surfaquo groups (at least for low values of the redox charge capacity), and so the data outlined in fig. 16 is not surprising.
Conclusions
In the present paper we have described the growth of hydrous nickel oxyhydroxide thin films on Ni substrates in aqueous base and examined the dynamics of redox switching in the latter films. A novel mechanism involving a nickel oxo intermediate in excellent agreement with experimental data has been developed which is in excellent agreement with recent spectroscopic and DFT studies.
Fifth an OER mechanism in keeping with current ideas derived from experiments on molecular inorganic transition metal complexes for OER catalysts has been proposed. This extends the classic work of Kobussen and Broers (53) and utilizes the concept of a surfaquo groups involving a metal oxide and metal oxo species as participants in the rate determining step of the oxygen evolution reaction under electrochemical conditions. Indeed we can conclude that the chemistry of the surfaquo group determines the chemistry of the OER catalytic cycle.
Acknowledgments
This paper is dedicated to the memory of Professor Laurence D Burke, Fellow of the Electrochemical Society, late of the Department of Chemistry, University College, Cork, Ireland who has recently passed away. Professor Burke was a first rate scientist and an excellent mentor and friend to many. The field of Physical Electrochemistry is much the poorer for his absence. He will be sorely missed.
This publication has emanated in part from research conducted with the financial support of Science Foundation Ireland (SFI) under Grant Number SFI/10/IN.1/I2969.
References
1. (a) D.E. Hall, J. Electrochem. Soc., 130, 317 (1983) ; (b) K. Zeng and D. Zhang, Prog. Energy Combust. Sci., 36, 307 (2010) ; (c) H. Tributsch, Int. J. Hydrogen Energy, 33, 5911 (2008); (d) G. W. Crabtree, M. S. Dresselhaus and M. V. Buchanan, Phys. Today, December 2004, 39.
2. K. Kinoshita, Electrochemical Oxygen Technology, chapter 2, pp. 78-99 Wiley-Interscience, New York( 1992).
3. P.W.T. Lu and S. Srinivasan, J. Electrochem. Soc., 125, 1416 (1978). 4. B.E. Conway and P.L. Bourgault, Can. J. Chem., 37, 292 (1959). 5. B.E. Conway and P.L. Bourgault, Trans. Faraday Soc., 58, 593(1962).
6. R.D. Armstrong, G.W.D. Briggs and E.A. Charles, J. Appl. Electrochem., 18, 21 (1988).
7. E.B. Castro, S.G. Real and L.F. Pinheiro Dick, Int. J. Hydrogen Energy. 29, 255 (2004).
8. M. E. G. Lyons and M. P. Brandon, Int. J. Electrochem. Sci., 3, 1386 (2008). 9. M. E. G. Lyons and M. P. Brandon, Int. J. Electrochem. Sci., 3, 1425 (2008). 10. M. E. G. Lyons and M. P. Brandon, Int. J. Electrochem. Sci., 3, 1463 (2008). 11. P. He, L.R. Faulkner, Anal. Chem., 58, 517 (1986).
12. M.E.G. Lyons, L.D. Burke, J. Electroanal. Chem., 170, 377 (1984). 13. L. D. Burke and M. E. G. Lyons, J. Electroanal. Chem., 198, 347 (1986). 14. M.E.G. Lyons, M.P. Brandon, Phys. Chem. Chem. Phys., 11,2203 (2009). 15. L.D. Burke, M.E. Lyons, O.J. Murphy, J. Electroanal. Chem., 132, 247 (1982). 16. L. D. Burke, M. I. Casey, V. J. Cunnane, O. J. Murphy and T. A. M. Twomey, J.
Electroanal. Chem., 189, 353 (1985).
17. P. He, L.R. Faulkner, Anal. Chem., 58, 517 (1986).
18. S. Gottesfeld and S. Srinivasan, J. Electroanal. Chem, 86(1978) 89.
19. A. Seghiouer, J. Chevalet, A. Barhoun and F. Lantelme, J. Electroanal. Chem,
442, 113 (1998).
22. L.D.Burke, D.P. Whelan, J. Electroanal. Chem., 109, 385 (1980).
23. A.C. Chialvo, W.E. Triaca, A.J. Arvia, J. Electroanal. Chem., 146, 93 (1983). 24. M.E.G. Lyons, L. Russell, M.O’Brien, R.L. Doyle, I. Godwin, M.P. Brandon, Int.
J. Electrochem. Sci., 7, 2710 (2012).
25. (a) L.D. Burke, T.A.M. Twomey. J. Electroanal. Chem., 162, 101 (1984).(b) L.D. Burke, T.A.M. Twomey, J. Electroanal. Chem., 167, 285 (1984).
26. L.M.M. de Souza, F.P. Kong, F.R. McLarnon, R.H. Muller, Electrochim. Acta.,
42, 1253 (1997).
27. L.D. Burke, M.E.G. Lyons, Mod. Asp. Electrochem., 18, 169 (1986). 28. S.D. James, J. Electrochem. Soc., 116, 1681 (1969).
29. J.W. Schultze, K.H. Vetter, Electrochim. Acta, 18, 889 (1973).
30. W.M. Sachtler, L.L.V. Reizen, J. Res. Inst. Catal., Hokkaido Univ., 10,87 (1962) . 31. R. Woods in Electroanal. Chem., Vol. 9, Ed. A.J. Bard, Marcel Dekker, New
York, 1976, Ch. 1.
32. L.D.Burke, E.J.M. O’Sullivan, J. Electroanal. Chem., 117, 155 (1981). 33. H. Bode, K.Dehmelt, J. Witte, Electrochim. Acta., 11 (1966) 1079. 34. L. D. Burke and D. P.Whelan, J. Electroanal. Chem., 162, 121 (1984).
35. (a) D.M. MacArthur, J. Electrochem. Soc., 117, 422 (1970) ; (b) D.M. MacArthur, J. Electrochem. Soc., 117 , 729 (1970).
36. A.H. Zimmerman, P.K. Effa, J. Electrochem. Soc., 129, 983 (1984).
37. (a) J.W. Weidner, P. Timmerman, J. Electrochem. Soc., 141, 346 (1994) ; (b) S. Motupally, C.C. Streinz, J.W. Weidner, J. Electrochem. Soc., 142, 1401 (1995). 38. Z. Mao, P. De Vidts, R.E. White, J. Newman, J. Electrochem. Soc., 141,54 (1994). 39. M. Wehrens-Dijksma, P.H.L. Notten, Electrochim. Acta., 51, 3609 (2006).
40. M.S. Kim, K.B. Kim, J. Electrochem. Soc., 145, 507 (1998).
41. G.T. Cheek, W.E. O’Grady, J. Electroanal. Chem., 421, 173 (1997).
42. (a) K. Aoki, K. Tokuda, H. Matsuda, J. Electroanal. Chem., 146 (1983) 417. (b) K. Aoki, K. Tokuda, H. Matsuda, J. Electroanal. Chem., 160 (1984) 33.
43. V. Mirceski, Z. Tomovski, J. Solid State Electrochem., 15 (2011) 197.
44. R.W. Murray in Molecular Design of Electrode Surfaces, Ed. R.W. Murray, Techniques of Chemistry Series, Wiley Interscience, New York, 1992, vol. 22, ch. 1, pp. 1-48.
45. (a) J.C. Jernigan, C.E.D. Chidsey, R.W. Murray, J. Am. Chem. Soc., 107, 2824 (1985); (b) C.E.D. Chidsey, R.W. Murray, J. Phys. Chem., 90, 1479 (1986); (c) E.F. Dalton, N.A. Surridge, J.C. Jernigan, K.O. Wilbourne, J.S. Facci, R.W. Murray, Chem. Phys., 141,143 (1990); (d) J.C. Jernigan, N.A. Surridge, M.E. Zvanut, M. Silver, R.W. Murray, J. Phys. Chem., 93,4620 (1989).
46. M.E.G. Lyons, Electroactive Polymer Electrochemistry, Plenum Press, New York, 1994, ch.2, pp.102-103.
47. (a) E. Laviron, J. Electroanal. Chem., 52, 395 (1974); (b) E. Laviron, J. Electroanal. Chem., 112,1 (1980); (c) E. Laviron, L. Roullier, C. Degrand, J. Electroanal. Chem., 112, 11 (1980); (d) E. Laviron, J. Electroanal. Chem., 122 37 (1981) ; (e) E. Laviron, L. Roullier, J. Electroanal. Chem., 115 ,65 (1980) ; (f) E. Laviron, J. Electroanal. Chem., 101 , 19 (1979) .
48. R.S. Nicholson, I. Shain, Anal. Chem., 36 ,706 (1964).
50. W.H. Press, S.A. Teukolsky, W.T. Vetterling, B.P. Flannery, Numerical Recepies, 2nd Edition, Cambridge University Press, Cambridge, UK, 1993, Chap. 9, pp.343-346.
51. J.O’M. Bockris, T. Otagawa, J. Phys. Chem., 87 , 2960 (1983).
52. (a) B.S. Yeo, S.L. Klaus, P.N. Ross, R.A. Mathies, A.T. Bell, Chem. Phys. Chem.,
11, 1854 (2010); (b) B.S. Yeo, A.T. Bell, J. Am. Chem. Soc., dx.doi.org/10.1021/ja200559j
53. A.G.C. Kobussen, G.H.J. Broers, J. Electroanal. Chem., 126, 221 (1981).
54. M. Busch, E. Ahlberg and I. Panas, Phys. Chem. Chem. Phys., 13, 15069 (2011). 55. L-P. Wang, Qin Wu and T. Van Voorhis, Inorg. Chem., 49, 4543 (2010).
56. L. Duan, F. Bozoglian, S. Mandal, B. Stewart, T. Privalov, A. Llobet and L. Sun, Nature, 4, 418 (2012).
57. G. A. Lawrence, Introduction to Coordination Chemistry, p. 199, J. Wiley & Sons, West Sussex (2010).
58. X. Shen, Y. A. Small, J. Wang, P. B. Allen, M. V. Fernandez-Serra, M. S. Hybertsen and J. T. Muckerman, J. Phys. Chem, 114, 13695 (2010).
59. J. Rossmeisl, Z.-W. Qu, H. Zhu, G.-J. Kroes and J. K. Norskov, J. Electroanal. Chem., 607, 83 (2007).