R E S E A R C H
Open Access
Analysis of different model-based approaches for
estimating dFRC for real-time application
Erwin J van Drunen
1*, J Geoffrey Chase
1, Yeong Shiong Chiew
1, Geoffrey M Shaw
2and Thomas Desaive
3* Correspondence:
1University of Canterbury,
Christchurch 8041, New Zealand Full list of author information is available at the end of the article
Abstract
Background:Acute Respiratory Distress Syndrome (ARDS) is characterized by inflammation, filling of the lung with fluid and the collapse of lung units. Mechanical ventilation (MV) is used to treat ARDS using positive end expiratory pressure (PEEP) to recruit and retain lung units, thus increasing pulmonary volume and dynamic functional residual capacity (dFRC) at the end of expiration. However, simple, non-invasive methods to estimate dFRC do not exist.
Methods:Four model-based methods for estimating dFRC are compared based on their performance on two separate clinical data cohorts. The methods are derived from either stress-strain theory or a single compartment lung model, and use commonly controlled or measured parameters (lung compliance, plateau airway pressure, pressure-volume (PV) data). Population constants are determined for the stress-strain approach, which is implemented using data at both single and multiple PEEP levels. Estimated values are compared to clinically measured values to assess the reliability of each method for each cohort individually and combined.
Results:The stress-strain multiple breath (at multiple PEEP levels) method produced an overall correlation coefficient R2= 0.966. The stress-strain single breath method produced R2= 0.530. The single compartment single breath method produced R2= 0.415. A combined method at single and multiple PEEP levels produced R2= 0.963. Conclusions:The results suggest that model-based, single breath and non-invasive approaches to estimating dFRC may be viable in a clinical scenario, ensuring no interruption to MV. The models provide a means of estimating dFRC at any PEEP level. However, model limitations and large estimation errors limit the use of the methods at very low PEEP.
Keywords:Mechanical ventilation, Functional residual capacity, FRC, dFRC, PEEP, Pulmonary, Model-based methods, ARDS, Intensive care, ICU
Background
Patients suffering from severe respiratory insufficiency such as Acute Respiratory Distress Syndrome (ARDS) (mild, moderate, severe) [1] are admitted to the intensive care unit (ICU) and require mechanical ventilation (MV) for breathing support. ARDS is associated with lung inflammation and fluid filling causing a loss of functional lung units resulting in a stiffer lung with reduced intrapulmonary gas volume known as the
“baby lung” [2]. Mortality rates for ARDS have been reported to be between 20% to 70% [3].
Clinicians offer a supportive environment that aids ARDS patient recovery by application of MV. However, further harm can result from suboptimal MV [4]. Typically, the severity of ARDS is measured as the ratio of the arterial partial pressure of oxygen divided by the fraction of inspired oxygen (PaO2/FiO2ratio). A PaO2/FiO2value less than 300mmHg implies the patient has mild ARDS, while less than 200mmHg is moderate ARDS and less than 100mmHg is characterised as severe ARDS [1].
Functional residual capacity (FRC) represents the pulmonary gas volume of the lung at zero end expiratory pressure (ZEEP), i.e. at atmospheric pressure after normal expiration. Positive end expiratory pressure (PEEP) is applied to ARDS patients to maintain recruit-ment during subsequent breathing cycles [5-8]. PEEP improves gas exchange and ensures pulmonary volume above FRC. However, there is a risk of overstretching healthy lung units during high PEEP [9]. The optimal PEEP remains highly debated with no conclu-sive results [5], and setting this parameter is thus a balance between high and low values. Given the impact of MV on cost and length of stay [10], ensuring an optimal PEEP would have significant impact.
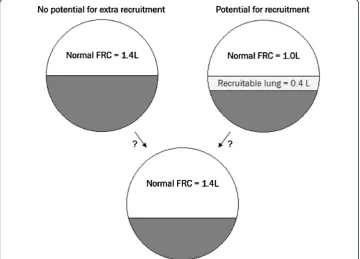
Figure 1 shows a schematic of the lung. An absolute value of FRC gives no infor-mation on the potential for new recruited lung volume during MV. A lung with an FRC of 1.4L could be a result of a lung with 1.4L of fully recruited healthy lung units or 1.0L of recruited lung plus an additional amount of lung recruited due to additional PEEP. Knowing this difference would allow PEEP to be optimized to maximize recruitment and ensure any increase in PEEP added recruited lung volume.
[image:2.595.118.479.454.713.2]Currently, there are few methods of measuring FRC at the bedside. Gas washout/ washin techniques are one method [11], but are not necessarily available on most ventilators. FRC can also be measured by using chest imaging methods such as Computed Tomography (CT) scans [12] and Electrical Impedance Tomography
(EIT) scans [13,14]. Timed at the end of expiration, the lung volume can be assessed at each CT or EIT slice and summed across all the slices in the lung to evaluate true lung FRC. However, this type of measurement is unrealistic for regu-lar use in guiding MV or continuous monitoring in the ICU. Although specialised ventilators can measure FRC and re-estimate FRC following PEEP changes (GE, Engstrom, Carestation ventilators), most standard ventilators cannot. Thus, there is motivation to estimate the PEEP induced FRC change to avoid further lung injury and complication.
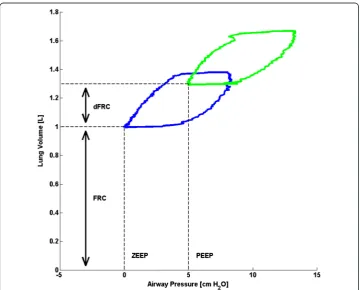
The level of additional lung volume due to additional PEEP is known as dynamic FRC (dFRC) [15] and is shown schematically in Figure 2. The ability to use stand-ard ventilator data to simply and non-invasively estimate dFRC without interrupt-ing MV treatment would be a significant potential enhancement in ventilation management. Although dFRC cannot by itself estimate the potential of lung re-cruitment, used with arterial blood gas measurements it can provide the clinician with useful information on lung recruitability as PEEP or other MV settings are modified. Thus, dFRC represents an aspect of the primary clinical endpoint in ventila-tion management, with the potential to be continuously tracked with changes in patient condition.
[image:3.595.118.479.425.715.2]In this study, four model-based methods of estimating dFRC are presented and their performance investigated. The first method, proposed by Sundaresan et al. [15], is based on a stress–strain approach. It requires pressure-volume (PV) data at a minimum of two PEEP levels. Additional PV loops at a wide range of PEEP levels are required for
higher accuracy thus requiring an interruption to ongoing MV treatment. The second method, proposed by Mishra et al. [16] is an extension to [15] and only requires PV data from a single breath at one PEEP level to estimate dFRC for a given patient eliminating interruption. The third method is based on a single compartment lung model and also requires PV data from a single breath at one PEEP level. The final method is a combination of the methods proposed by [15] and [16] with the aim of providing both accuracy and clinical functionality as data becomes available. All four methods are tested on two separate clinical data cohorts where both PV data and dFRC were measured directly.
Methods
Stress-strain multiple breath method (SSMB)
Chiumello et al [17] proposed a stress-strain theory of lung dynamics where the transpul-monary pressure (ΔPL) is defined as the clinical equivalent of stress. Transpulmonary
pres-sure is the difference between the applied airway prespres-sure and the corresponding pleural pressure. The clinical equivalent of strain is the ratio of the change in volume (ΔV) to the FRC, which represents the resting lung volume, yielding a stress-strain definition:
ΔPLðstressÞ ¼EL;spec ΔV
FRCðstrainÞ ð1Þ
where the specific lung elastance (EL,spec) can be defined as the transpulmonary pressure at
which FRC effectively doubles. The general relationship between the plateau airway pressure (ΔPaw), when the airflow is zero, and the corresponding transpulmonary pressure is defined
as [17]:
ΔPLðstressÞ ¼ΔPawα ð2Þ
α¼ EL
ELþECW ð
3Þ
whereαrepresents the static lung elastance and represents the ratio of the lung elastance (EL) to the chest wall elastance (ECW). The value ofαindicates the severity of ARDS, where
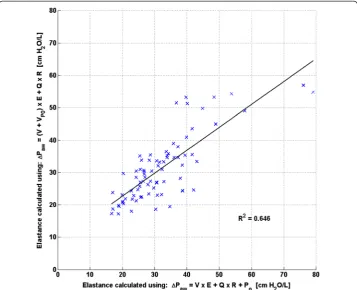
a higher value ofαindicates a higher severity of ARDS [15,18]. The equation of motion de-scribing the airway pressure as a function of the resistive and elastic components of the re-spiratory system is defined as [19]:
ΔPaw¼VErsþQRrsþPo ð4Þ
whereVis the volume ranging from zero at the beginning of inspiration to the tidal volume (Vt) at the end of inspiration,Ersis the respiratory elastance,Qis the airflow rate,Rrsis the
respiratory resistance andPois the offset pressure, which is a combination of applied PEEP
and intrinsic PEEP [20,21]. All of the PEEP data in this study represent plateau airway sures, which are measured at zero airflow at end expiration. Because transpulmonary pres-sure is not typically meapres-sured at the bedside, it is estimated using the PEEP. Thus, rather than using the transpulmonary pressure, the airway pressure is used as an estimate based on Eq. (2). If the pressure and volume are measured at the point between expiration and in-spiration, where the flow is zero, the resistive term is zero and the airway pressure is equal to the plateau airway pressure. Combining Eqs. (1) and (2) yields a formula for FRC in-volvingΔV=ΔdFRCandΔPaw=ΔPEEP:
FRC¼ΔΔdFRC PEEP
EL;spec
Eq. (5) defines FRC as a function of the volume responsiveness of the patient to the specified change in PEEP, ΔdFRC
ΔPEEP;EL;spec andαof the patient. In this model, FRC and the effect on FRC from a recruitment manoeuvre are not known. Thus, it was hypothesised that dFRC follows a similar mathematical form to Eq. (5):
FRCþdFRC¼ΔΔdFRC PEEP
EL;spec
α ð1þxÞ ð6Þ
Therefore, dFRC takes the form:
dFRC¼ΔΔdFRC PEEP
EL;spec
α x ð7Þ
where x is a function of the PEEP level at which dFRC is estimated. EL,spec and α are
relatively constant parameters [17] so can be combined into one unknown parameter,
βyielding:
dFRC¼ΔΔdFRC
PEEPβ ð8Þ
where β is a function of the PEEP, EL,spec and α. The assumption that α is
con-stant is true only for the linear portion of the static PV curve [15]. The value of β for a single value of PEEP is assumed constant across all patients. An additional file shows the β values determined for each data cohort [see Additional file 1]. Be-cause FRC was not known for any patient, β was analytically solved based on Eq. (8) using measured dFRC values from the data. Once β values were evaluated for each patient at each PEEP level, a median βwas then evaluated at each PEEP level to serve as a population constant for that PEEP level. The dFRC was then esti-mated using Eq. (8) and the median β value. The process can be summarised as follows:
1. Analytically solve Eq. (8) to findβfor each patient and PEEP. 2. Evaluate population based medianβat each PEEP level.
3. Estimate dFRC using Eq. (8) and the population based medianβ.
This method requires the patient to undergo a stepwise PEEP increase manoeuvre to obtain multiple PV loops at different PEEP levels prior to analysis.
Stress-strain single breath method (SSSB)
Mishra et al. [16] proposed a model to estimate ΔdFRC using only data from a single PEEP level. Once again, combining Eqs. (1) and (2) yields a formula for FRC involving
ΔV=VtandΔPaw: FRC¼ΔVt
Paw
EL;spec
α ð9Þ
Eq. (9) defines FRC as a function of the volume responsiveness of the patient to the specified change in airway pressure observed during inspiration, Vt
are not known. Thus it was hypothesised that ΔdFRC follows a similar mathematical form to Eq. (9):
FRCþΔdFRC ¼ΔVt Paw
ELspec
α ð1þxÞ ð10Þ
Therefore,ΔdFRC takes the form:
ΔdFRC¼ΔVt Paw
ELspec
α x ð11Þ
Once again, combiningx,EL,specandαinto one unknown parameter,βyields:
ΔdFRC¼ΔVt
Pawβ ð
12Þ
where β is a function of the PEEP, EL,spec and α. As with the SSMB method, the
assumption thatα is constant is true only for the linear portion of the static PV curve [15]. The value of βfor a single value of PEEP is assumed constant across all patients. Calculatedβvalues were normalized by tidal volume as dFRC can vary with the applied tidal volume [16].
β1¼ β
Vt ð
13Þ
An additional file shows theβ1values determined for each data cohort [see Additional file 1]. Values of βandΔdFRC were calculated through the same approach as outlined for the SSMB method.
Single compartment single breath method (SCSB)
An alternative method of estimating dFRC without the use of a population constant uses the single compartment linear lung model [19] as defined by Eq. (4). AssumingPois also the pressure to increase baseline FRC, thenPocan be defined:
Po¼PEEP¼ErsVPo ð14Þ
where,VPois the additional lung volume increase due to PEEP. Substituting Eq. (14) into
(4) gives:
ΔPaw¼ðVþVPoÞ ErsþQRrs ð15Þ
Eq. (14) could be an alternative method to estimate dFRC using respiratory elastance [22]. In particular, Eq. (14) is used to calculateVPowhich from Eq. (15) is expected to
cap-ture the change in FRC due to PEEP changes, thusVPois proportional to dFRC. The
re-spiratory elastance in this study was determined using the integral based method [23] for the inspiration portion of the measured breathing cycle.
Combined method (CM)
all available and prior data. This method aims to combine the higher accuracy of the SSMB method with the higher clinical feasibility of the SSSB method.
Clinical patient data
Retrospective clinical data was used, consisting of 10 patients (each) from Sundaresan [24] and Bersten et al. [9] (cohorts 1, 2 respectively). For cohort 1, the dFRC was calcu-lated during post-processing of flow data obtained by a pneumotachometer. The differ-ence in flow rate across a PEEP change was used to estimate dFRC. For cohort 2, the dFRC was calculated directly by deflation to ZEEP at the end of a breathing cycle for each PEEP level. The demographics and cause of lung injury of all patients are shown in Table 1. The PEEP levels at which data was obtained for each cohort is also presented [see Additional file 2].
Analysis
[image:7.595.117.478.440.734.2]Estimated dFRC values were compared with the clinically measured dFRC to deter-mine the estimation error over each method and data cohort. Performance was assessed by trend correlation coefficient (R2) where comparisons between measured and estimated values were made. The maximum, minimum, median and interquar-tile range non-parametric statistics were chosen to be the summary statistics to display. The accuracy of each method was compared in relation to the other meth-ods and the functionality of each method was evaluated.
Table 1 Characteristics of the patients
Patient Sex Age [years] Cause of Lung Injury
Cohort 1 [24]
1 Female 61 Peritonitis
2 Male 22 Trauma
3 Male 55 Aspiration
4 Male 88 Pneumonia
5 Male 59 Pneumonia
6 Male 69 Trauma
7 Male 56 Legionnaires
8 Female 45 Aspiration
9 Male 37 H1N1
10 Male 56 Legionnaires
Cohort 2 [9]
1 Male 74 Ruptured AAA
2 Male 24 Lung contusion
3 Female 72 Legionnaires
4 Male 48 Pancreatitis
5 Female 68 Pulmonary embolus
6 Male 54 Aspiration
7 Male 73 Aspiration
8 Male 72 Pneumonia
9 Male 81 Aspiration
Results
Stress-strain multiple breath method (SSMB)
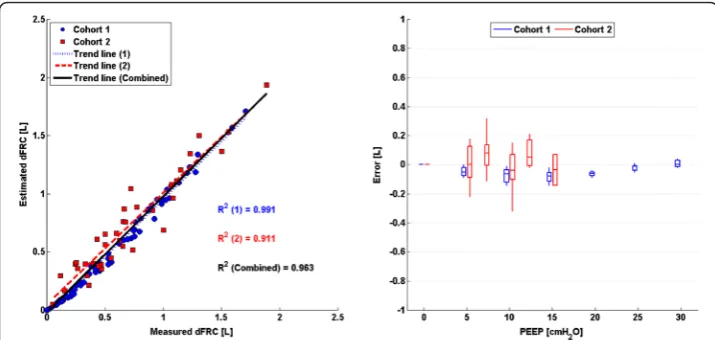
The linear trend in clinical vs. predicted dFRC across all PEEP levels and the associated error for each cohort is shown in Figure 3. Values of R2are given, for both cohorts 1 and 2 separately and combined.
Stress-strain single breath method (SSSB)
[image:8.595.119.478.89.262.2]The linear trend in clinical vs. predicted dFRC across all PEEP levels and the associated error for each cohort is shown in Figure 4. Values of R2are given, for both cohorts 1 and 2 separately and combined. Values of R2are also given for the cases where outlying patients have been excluded.
Figure 3SSMB: Plots of measured dFRC vs.estimated dFRC and associated error.(Left) Plot of clinically measured dFRC vs. estimated dFRC for all patients and PEEP levels. (Right) Box plot of errors between clinically measured dFRC and estimated dFRC for all patients and PEEP levels.
[image:8.595.118.479.516.685.2]Single compartment single breath method (SCSB)
The linear trend in clinical dFRC vs. predictedVPoacross all PEEP levels and the associated
error for each cohort is shown in Figure 5. Values of R2are given, for both cohorts 1 and 2 separately and combined.
Combined method (CM)
The linear trend in clinical vs. predicted dFRC across all PEEP levels and the associated error for each cohort is shown in Figure 6. Values of R2are given, for both cohorts 1 and 2 separately and combined.
[image:9.595.118.478.89.259.2]Table 2 summarizes the correlation coefficients for each method and cohort.
[image:9.595.118.476.525.695.2]Figure 5SCSB: Plots of measured dFRC vs.estimated dFRC and associated error.(Left) Plot of clinically measured dFRC vs. estimatedVPofor all patients and PEEP levels. (Right) Box plot of errors between clinically measured dFRC and estimatedVPoor all patients and PEEP levels. Errors larger than ±1L are truncated for clarity.
Discussion
Stress-strain multiple breath method (SSMB)
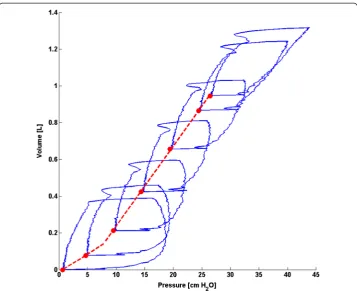
[image:10.595.118.478.100.171.2]There exists a strong, sustained linear trend in measured vs. estimated dFRC over all PEEP values and a wide range of dFRC for each cohort. Auto-PEEP, present in some patients from cohort 1 [24], may have affected the correlation coefficient for that cohort. Auto-PEEP has the effect of a sudden change in the level of recruitment (ΔdFRC) once the PEEP becomes greater than the auto-PEEP, as shown in Figure 7 for an auto-PEEP of 7cmH2O. Although cohort 1 contained patients with auto-PEEP, the median error, as shown in Figure 3, was consistently small across all PEEP levels indicating no inherent tendency for overestimation or underestimation. A significant drawback with this method is that it assumes a linear compliance trend across all PEEP levels which may not hold true for cases where auto-PEEP is present, or at high PEEP levels where overdistension can occur. Another limitation with this model is that it requires PV data from at least two PEEP levels so it cannot be used for continuous
[image:10.595.119.477.414.705.2]Figure 7PV loops for patient 1 (cohort 1) indicating a change in the trend of compliance at an auto-PEEP of 7cmH2O.
Table 2 Summary of trend correlation coefficients (R2) for each method and cohort
Cohort 1 [24] Cohort 2 [9] Overall coefficient
SSMB 0.974 0.945 0.966
SSSB 0.862 0.453 0.530
SCSB 0.744 0.475 0.415
tracking of dFRC. Its application in real-time dFRC measurement is thus limited without interrupting MV treatment.
Stress-strain single breath method (SSSB)
The single breath method proposed by Mishra et al. [16] and applied to cohort 2 [9] resulted in the lowest overall correlation in the study. This result is specifically due to the trend of trials 4, 5 and 12, as shown in Figure 4, where the error reached as high as 1.66L. This large error was caused by two factors:
1. All three trials exhibited a relatively low compliance trend when compared to the majority of other trials in the cohort, resulting in a lower calculated β1 value. The
population constant β1 value was calculated as the median of all β1 values at a given
PEEP. Hence, a significantly higher median β1 value was, in turn, applied to these
patients, causing error.
2. Several other trials also exhibited reasonably low compliance trends, but did not result in overestimation. This difference in outcome occurs because values of β1 were
normalised byVt. Generally, trials 4, 5 and 12 had higher Vtwhen compared to other trials exhibiting the same trend in compliance.
Combined, these two factors resulted in considerable overestimation of dFRC for these three trials and potentially highlight a significant limitation with this method. No patient-specific or case-patient-specific factor could be identified as the root cause of this difference. However, it should be noted that measurements for patients in cohort 1 were obtained with no prior recruitment manoeuvre or stabilization and had a far higher R2 value of 0.862 as shown in Figure 4 and Table 2. In contrast, the study of [9] recruited and stabi-lized patients at each PEEP level for 30 minutes. Thus, as a result, this cohort may see higherVtdespite low compliance, which is a scenario not typically seen clinically.
An advantage of the SSSB method over the SSMB method is that a unique value of
β1 is determined at each PEEP level which is independent of lung behaviour at other PEEP levels. Thus, values of β1 can account for the natural sigmoidal nature of a patients’ volume responsiveness to PEEP increase. This is important for cases where auto-PEEP is present, or at high PEEP levels where overdistension can occur. A disadvan-tage is that the calculated values ofβ1are dependent on the method of data measurement. As previously mentioned, patients in cohort 2 were stabilized prior to measurement while those in cohort 1 were not. Thus, theβ1values obtained from cohorts 1 and 2 diverge as PEEP increases. Combining these cohorts to obtain a larger population for determining values of medianβ1would result in poorer dFRC estimation across both cohorts.
Single compartment single breath method (SCSB)
The correlation coefficients observed in Figure 5 and Table 2 for the SCSB method indicate a possible linear relationship between measured dFRC and estimated VPo,
indicating that VPo may be linearly related to dFRC. This relationship is based on the
assumption that the respiratory elastance, Ers, is the same in both Eqs. (4) and (15)
VPo. The error inVPoacross a range of PEEP levels can be seen in Figure 9 where the
individual patient specific trends between measured dFRC and estimated VPo from
cohort 1 in Figure 5 have been highlighted. The relationship is seen to be non-linear with a concave response as PEEP (and consequently dFRC) increase. It is possible that some normalization of the data may correct for this.
Combined method (CM)
The combined method incorporates the higher linear correlation observed with the SSMB method with the clinical applicability of the SSSB method. Because the combined method considers a progressive increase in the number of available PEEP levels, it can manage changes in compliance with less error than the SSMB method alone, which assumes a linear compliance trend over all PEEP levels, as well as versus the single breath methods. Overall, this approach is clinically feasible, practical and accurate for the range of clinically acceptable PEEP values seen in application.
Outcomes
[image:12.595.119.477.89.379.2]By using non-invasive model-based approaches, dFRC can be tracked continuously as it changes with the evolution of the disease. Although dFRC by itself only gives information on the additional lung volume due to PEEP changes, it can be used in conjunction with arterial blood gas measurements to help model the recruitment potential and response of the lung. In, particular, it might also be combined with existing models of gas exchange [25] to create a fully model-based approach to estimating lung recruitment.
The proposed methods have limitations in their predictive capability since in some cases the error observed between the measured and estimated values was exceptionally large. Auto-PEEP in particular has potential to affect the accuracy of the models. However, it can be detected directly from PV loop responses and thus managed. In the process of evaluating all four methods, it was found that the CM is the optimal method to estimate dFRC for real time application.
Conclusions
The research presented evaluates four model-based methods for their capability of estimating dFRC for mechanically ventilated patients. By monitoring or tracking changes in patient respiratory mechanics, the clinician is able to evaluate the potential of recruitable lung in the patient. This may help to determine the optimal level of PEEP required during MV. In some cases, model limitations and large estimation errors limit the use of the methods for estimating recruitment potential. The models can be implemented in the ICU without the use of time-consuming methods such as CT scans.
Additional files
Additional file 1:Medianβ[cmH2O] values for use in the SSMB method and the CM.Medianβ1[cmH2O/mL] values for use in the SSSB method and the CM. Values ofβandβ1determined for both data cohorts for use in the SSMB method, SSSB method and CM.
[image:13.595.119.477.88.376.2]Additional file 2:PEEP levels at which data was obtained for cohort 1 [24].PEEP levels at which data was obtained for cohort 2 [9]. PEEP levels for cohorts 1 and 2 at which PV data was obtained.
Figure 9Patient specific trends in cohort 1 between clinically measured dFRC and estimatedVPofor
Abbreviations
ARDS: Acute Respiratory Distress Syndrome; ICU: Intensive Care Unit; MV: Mechanical ventilation; FRC: Functional Residual Capacity; PEEP: Positive End Expiratory Pressure; CT: Computed tomography; EIT: Electrical impedance tomography; dFRC: Dynamic Functional Residual Capacity; PV: Pressure-volume; SSMB: Stress-strain multiple breath; SSSB: Stress-strain single breath; SCSB: Single compartment single breath; CM: Combined method.
Competing interests
There are no competing interests.
Authors’contribution
EJD developed the combined method, performed the validation of the models and drafted the manuscript. JGC participated in the implementation and coordination of the study and helped to draft the manuscript. YSC developed the single compartment single breath method and helped to draft the manuscript. GMS helped with the data acquisition. TD participated in the implementation and coordination of the study. All authors read and approved the final manuscript.
Author details
1University of Canterbury, Christchurch 8041, New Zealand.2Christchurch Hospital, Christchurch 8011, New Zealand. 3University of Liège, Liège, Belgium.
Received: 18 October 2012 Accepted: 25 January 2013 Published: 31 January 2013
References
1. The ADTF:Acute respiratory distress syndrome: The berlin definition.JAMA: J Am Med Assoc2012,307(23):2526–2533. 2. Gattinoni L, Pesenti A:The concept of "baby lung".Intensive Care Med2005,31(6):776–784.
3. Bersten AD, Edibam C, Hunt T, Moran J, Australian and New Zealand Intensive Care Society Clinical Trials Group: Incidence and mortality of acute lung injury and the acute respiratory distress syndrome in three Australian states.Am J Respir Crit Care Med2002,165(4):443–448.
4. Ware LB, Matthay MA:The acute respiratory distress syndrome.N Engl J Med2000,342(18):1334–1349. 5. Amato MB, Barbas CS, Medeiros DM, Magaldi RB, Schettino GP, Lorenzi-Filho G, Kairalla RA, Deheinzelin D, Munoz
C, Oliveira R, Takagaki TY, Carvalho CR:Effect of a Protective-Ventilation Strategy on Mortality in the Acute Respiratory Distress Syndrome.N Engl J Med1998,338(6):347–354.
6. The Acute Respiratory Distress Syndrome Network:Ventilation with lower tidal volumes as compared with traditional tidal volumes for acute lung injury and the acute respiratory distress syndrome.N Engl J Med2000, 342(18):1301–1308.
7. McCann UG, Schiller HJ, Carney DE, Gatto LA, Steinberg JM, Nieman GF:Visual validation of the mechanical stabilizing effects of positive end-expiratory pressure at the alveolar level.J Surg Res2001,99(2):335–342. 8. Halter JM, Steinberg JM, Schiller HJ, DaSilva M, Gatto LA, Landas S, Nieman GF:Positive end-expiratory pressure
after a recruitment maneuver prevents both alveolar collapse and recruitment/derecruitment.Am J Respir Crit Care Med2003,167(12):1620–1626.
9. Bersten AD:Measurement of overinflation by multiple linear regression analysis in patients with acute lung injury.Eur Respir J1998,12(3):526–532.
10. Dasta JF, McLaughlin TP, Mody SH, Piech CT:Daily cost of an intensive care unit day: the contribution to mechanical ventilation.Crit Care Med2005,33:1141–1143.
11. Heinze H, Schaaf B, Grefer J, Klotz K, Eichler W:The Accuracy of the oxygen washout technique for functional residual capacity assessment during spontaneous breathing.Anesth Analg2007,104(3):598–604.
12. Malbouisson LM, Muller J-C, Constantin J-M, Lu QIN, Puybasset L, Rouby J-J, the CTSASG:Computed tomography assessment of positive end-expiratory pressure-induced alveolar recruitment in patients with acute respiratory distress syndrome.Am J Respir Crit Care Med2001,163(6):1444–1450.
13. Zhao Z, Steinmann D, Muller-Zivkovic D, Martin J, Frerichs I, Guttmann J, Moller K:A lung area estimation method for analysis of ventilation inhomogeneity based on electrical impedance tomography.J Xray Sci Technol2010,18:171–182.
14. Zhao Z, Moller K, Steinmann D, Frerichs I, Guttmann J:Evaluation of an electrical impedance tomography-based global inhomogeneity index for pulmonary ventilation distribution.Intensive Care Med2009,35:1900–1906. 15. Sundaresan A, Chase JG, Hann CE, Shaw GM:Dynamic functional residual capacity can be estimated using a
stress-strain approach.Comput Meth Programs Biomed2011,101(2):135–143.
16. Mishra A, Chiew YS, Shaw GM, Chase JG:Model-Based Approach to Estimate dFRC in the ICU Using Measured Lung Dynamics: 8th IFAC Symposium on Biological and Medical Systems; 2012:8.
17. Chiumello D, Carlesso E, Cadringher P, Caironi P, Valenza F, Polli F, Tallarini F, Cozzi P, Cressoni M, Colombo A, Marini JJ, Gattinoni L:Lung stress and strain during mechanical ventilation for acute respiratory distress syndrome.Am J Respir Crit Care Med2008,178(4):346–355.
18. Gattinoni L, Chiumello D, Carlesso E, Valenza F:Bench-to-bedside review: chest wall elastance in acute lung injury/acute respiratory distress syndrome patients.Crit Care2004,8(5):350–355.
19. Bates JH:Lung Mechanics: An inverse Modelling Approach. New York: Cambridge University Press; 2009:37–44. 20. Carvalho ARS, Jandre FC, Pino AV, Bozza FA, Salluh J, Rodrigues R, Ascoli FO, Giannella-Neto A:Positive end-expiratory
pressure at minimal respiratory elastance represents the best compromise between mechanical stress and lung aeration in oleic acid induced lung injury.Crit Care2007,11(4):R86.
22. Stenqvist O, Grivans C, Andersson B, Lundin S:Lung elastance and transpulmonary pressure can be determined without using oesophageal pressure measurements.Acta Anaesthesiol Scand2012,56(6):738–747. 23. Hann CE, Chase JG, Lin J, Lotz T, Doran CV, Shaw GM:Integral-based parameter identification for long-term
dynamic verification of a glucose-insulin system model.Comput Meth Programs Biomed2005,77(3):259–270. 24. Sundaresan A, Chase J, Shaw G, Chiew YS, Desaive T:Model-based optimal PEEP in mechanically ventilated
ARDS patients in the Intensive Care Unit.Biomed Eng Online2011,10(1):64.
25. Rees SE, Kjærgaard S, Thorgaard P, Malczynski J, Toft E, Andreassen S:The Automatic Lung Parameter Estimator (ALPE) System: non-invasive estimation of pulmonary gas exchange parameters in 10-15 minutes.J Clin Monit Comput2002,17(1):43–52.
doi:10.1186/1475-925X-12-9
Cite this article as:van Drunenet al.:Analysis of different model-based approaches for estimating dFRC for real-time application.BioMedical Engineering OnLine201312:9.
Submit your next manuscript to BioMed Central and take full advantage of:
• Convenient online submission
• Thorough peer review
• No space constraints or color figure charges
• Immediate publication on acceptance
• Inclusion in PubMed, CAS, Scopus and Google Scholar
• Research which is freely available for redistribution