A thesis presented for
the degree of Doct~r of Philosophy in Civil Enginee
in the University of Canterbury, Christchurch! New Zealand.
by
D WILLIAMS
The overall seismic
is studied.
An experimental investi
our of reinforced masonry shear walls
on concerned particularly with the duct!l! capability, stiffness degradation and load capacity of reinforced masonry wall panels subjected to static cyclic load is reported. Main parameters were the wall geometry, bearing load magnitude and reinforcing distribution. With those walls behaving flexurally satisfactory performance was obtained.
Four reinforced brickwork walls were subjected to dynamic cyclic loading. Significant structural deterioration occurred not only in those walls where shear effects predominated but also in the wall where flexural behaviour predominated.
The effect of jointing materials on the behaviour of masonry prisms tested in uniaxial compression is'discussed with reference to a failure mechanism. Complete stress-strain curves for brickwork and
concrete masonry prisms are presentedj the falling branch characteristics are comparable with those of concrete.
Inelastic response analyses of stiff structures have shown that mild stiffness degradation has little effect on the seismic ductility requirements when of reasonable size.
iii
This investigation was carried out in the Department of Civil ering, University of Canterbury,of which H.J. Hopkins is Head The assistance rendered by the academic and technical staff of this department is gratefully acknowledged
The writer is particularly ted to J.C. Se vener for his valuable help, advice and encouragement as supervisor of this project.
incerest thanks are also extended to McSkimming ndustries Ltd and Vibrapac Blocks for their interest and generous aid; to
2.1
Introduction
2 1.1
ral
2 1 2
Test Objectives
2 1
3
Scope of Investi
on
2.2
Experimental Details
2.2.1
Wall Construction
2.2.2 Materials
2 2.3 Loading and Support Conditions
2.2.4 Instrumentation
2
2.5
Test Procedure
Discussion of
st Results
2.3.1
Wall Behaviour
2.3 2 Ultimate Strengths
2.3.3 Effect of Load Repetition
2.3.4 Effect of Bearing Load
2.3.5
Effect of Wall Geometry
2.3.6 Effect of Reinforcing
2
3.7
Reinforced Grouted Masonry
2.4
Conclusions
3·1
Introduction
3.1
1General
3
'1 .2Scope of
on
3.2
Test Details
3.2.~1
Method of
1
2
2
3
5
5
5
6
8
1012
12
12
15
17
28
28
33
34
35
35
37
3.2 2 Instrumentation
3.203 Test Specimens
3 3 Prism Compression Tests
3.3 1 cimen Shape
3.3·2 Concrete Prisms in on
Masonry Behaviour
3.4 Discussion of Results
3 4.1 Effect of Jointing Material on Prism Compressive Strength
v
38
38
40
40
41
46
46
3.4.2 Effect of Mortar Thickness on Compressive Strength 49
3.4.3 Behaviour of Brick Masonry Prisms 49
3.4.4 Stress-strain Characteristics 49
3.4.5 The Failure Mechanism of Masonry 54
3.5 Conclusions 56
4.1 Introduction 58
4.1 1 General 58
4.1.2 Scope of Investigation 59
4.2 Analysis Details 59
4.2 1 Structural Models 59
4.2.2 Earthquake Record 62
4.2 3 Analysis Procedure 64
4 2.4 Numerical Stability and Step I n t e r v a 1 6 6
403 Discussion of Results 68
4.3 1 Ductility Requirements
68
4 3.2 Effect of Damping 76
4 3.3 Limitations of
4 3
4
Extension to Multi4 4
Conclusionsas
Systems 77
5
15.2
Introduction
Details
5.2.1 Test Specimens
5 2.2 Test Equipment
5.2.3
t Set-up5.2 4 Instrumentation
5.3
Discussion of Results5.4
Conclusions79
79
86
88
89
93
94
REFERENCES
97
APPENDIX Computer Program Listings
Elastic
Elasto~plastic
Basic Stiffness Degrading
Total Stiffness Degrading
101
102
104
2.1
Static Test Set-Up
Wall Fai
Conditions
2
3
t.o
Load-Deflection Cycles
2 12
Idealized Load-Deflection Curves
3.4
3.5
4.1
4.2
4.3
4.4
5·1
5
2Shear/Flexural Displacement of Elastic Cantilever
Typical Failures of Concrete and Brick Masonry Prisms
Hilsdorf's Failure Criterion for Brick Masonry
Stress-Strain Curves for Concrete Masonry, Concrete
and Mortar
Stress-Strain Curves for Brick and Brickwork Prisms
Stress-Strain and Poisson's Ratio-Strain for Mortar
Idealized Degrading Stiffness Models
Response Spectra-El Centro N-S
1940
Earthquake
Earthquake Response
Force-Displacement Diagrams
Load-Deflection Cycles
Load-Deflection Cycles
Block Diagram of Closed-Loop
tem
Load-Deflection Relation for Elastomer Pads
Dynamic Test
vii
Page
11
14
18
to
29
39
45
45
52
52
63
63
73
74
81
82
84
2.1 2.2
static Test Wall Details
Mortar Sand Grading
Static Test Results
Typical Values of
~/ERatio
Compressive Strength of Concrete Masonry Prisms
Properties of Mortars
Strain and Brittleness Values
Maximum Ductility Factors
Typical Ductility Factors for Varying Time Increments
Relative Ductility Requirements - Basic Degrading
Stiffness/Elasto-Plastic
(~d/~) and Maximum
Displacement Ratio - Elasto-Plgstic/Elastic (x /x )
m 0Dynamic Test Wall Details
Dynamic Test Results
4
7
16
42
48
50
50
69
70
70
80
1
In spite of being the oldest building material, the technolo cal d velopment of masonry in earthquake ng has behind other structural materials. The paucity of knowledge on the subject has lead to a lack of confidence by ers to use i t for seismic-resistant
ed by a history of poor earthquake structures. This has not been
performance for "unengineered" masonry structures which have been uufai compared with structures constructed in other materials that were subjected to seismic provisions It has been the aim of this study to investigate the overall seismic problem of reinforced masonry shear-wall structures and in this respect the advances made in reinforced concrete have often been drawn upon and applied to masonry.
Most codes of practice are based on experimental evidence which is limited to monotonic loading, although under seismic conditions
failure in this fashion would be unlikely The importance of the post-elastic cyclic behaviour of structural elements and the lack of such information for reinforced masonry lead to the experimental investigation reported in chapter 2. As a result of this investigation fUrther study of the material failure mechanism was undertaken which is the subject of chapter
3.
Chapter4
reports the effect of stiffness degradation (as observed in the static cyclic tests) on ductility requirementshas been with the cation 0 monotonically increasing loads until specimen failure.
Three series of static tests on reinforced walls of 611
hollow concrete block, approximately 8'-0" square, are reported by Scrlvener · ( 1,2) an d M ass an d S ' c r l v e n e r . (3) Th ese are concerne d W1 . th
the determination of ultimate loads in the case of walls failing in flexure and the effect of reinforcing and cavity filling on shear strengths of those walls loaded in diagonal compression. Earlier Schneider(4) undertook an investigation on reinforced grouted brick and concrete block shear walls, also 8'-0" square and further tests concerned with the shear strength of reinforced masonry walls and piers have been conducted by Converse(5), Schneider(6) and Blume and Prolux(7) •
Experimental inve gations with post-elastic cyclic loading, the most relevant for seismic considerations,are limited. The only such signi cant investigation on reinforced masonry known to the author was that undertaken by Meli and Esteva(8) in Mexico. Their tests followed those by Esteva(9) on masonry infilled frames subjected to alternating load and provided much ration for this test programme. They tested 18
9
9=0" high x 10'-6" panels, 16 being of hollow concreteIn Be Tal CClLI
v rti
load was also ied but r~sultant bearing stresses were less than 60 psi on the gross area, a low value From the load-deflection cycles they concluded that deterioration, defined as loss of capacity and stiffness through load repetition was d and concentrated in first two The inclusion of horizontal and vertical reinforcement in the wall did not improve the s1 tuation The influence of the cyclic deformation amplitude, horizontal reinforce-ment, vertical reinforcereinforce-ment, vertical load, type of failure and number of cycles were discussed. Ultimate strengths and initialload-deflection relations of the walls were also investigated.
2 1 2
The overall objective of this invest on was an evaluation of the post-elastic performance of forced masonry shear walls under cyclic conditions. The tests were designed with the following specific objectives in mind:
to determine the ductility capabilities;
to invest the stiffness degradation and load deterioration characteristics with cycling;
(c) to study the failure mechanisms and evaluate the ultimate load capacities;
(d) to determine the effect on (a), (b) and (c) of variations in the main test parameters, viz:
(i) wall geometry, described by the "aspect ratio" (wall height length);
I
Va terialI
Designa- Height Length Nominal (.,
) Reinforcing Bearing Stress1
Aspect Vertical. (%) (2) ( ) (2)
I
tion Reinforcing
Ratio
Brick 1 31
-9" 3' 1 4/~1! bars uniformly distributed 0.24
Ii 2 II II 1 II
II
3 II II 1 II Ii
H
4
0 )
II"
1 HI
5 IV II 1 VI \I
Concrete
CB 1 4'_0" 4'-0" 1 4/~1l bars
block uniformly distributed 0
n CB 2 II II 1 If
"
eB 3 II II 1 11
II CB 4 l! II 1 II
Brick A1 3'-9" 31
-8"
1 2/~!! bars on periphery 0.67II A2
"
II 1 2/~1I bars on peripheryo.
& &
2/t"
bars horizontally 0033II B1 3'-11" 21-2" 2 2/~1I bars on periphery 0.20
II B2
"
iI2 VI II
B3 II \I 2
"
IIII B4
"
"
24/i"
bars on periphery 1.63"
D1 3'-2"6'_1"
0.561i"
bars uniformly distributed 0.22"
D2I
It"
0.5 II Ii(1) All reinforcing bars deformed mild steel butt welded to base - bars anchored into top beam with standard 1800
hook (111 radius, 311 turndown) ; other vertical bars and l:orizonta~ bars
anchored with gOO bend and
8
11 extension.(2) Based on gross horizontal section. (3) Only reinforced cores grouted.
I
0
I
125 250 500 500 0 1 250 500
250 I
[image:12.822.53.757.66.470.2]Details of the wall
are summarised in Table 2 1
All
walls had nominal aspect ratios of 0.5, 1 or 2 it b
found that walls
within this geometric range, a transition zone between two distinct
behaviour
S,have the most ill-defined behaviour and are
cthe least predictable
Bearing stresses varied from zero to 500
on the gross sectional
area which covers the range likely to be met in practice and may
becompared with the
N,ZeBuilding Code(10) allowable value of 250 psi
andwith an estimated ultimate bearing capacity in excess of 2000 psi.
Walls
1to
5
and CB1 to CB4 of aspect ratio 1, B1, B2,
of aspect
ratio 2
D1, D2 of aspect ratio 0.5 allowed the effect of bearing
load magnitude to be determined.
Brick wall 4 differed from brick wall
5 in that only the
ad cores were grouted.
The other major parameter, the reinforcing perc
, varied
between 0
and 1.6%.
Walls A1 and A2 demonstrated the effect of
horizontal steel as shear reinforcing.
Both brick and concrete block masonry were investi
ed;
the
latter, less extensively, predominantly by inference.
tially
similar tests were performed on specimens
ofboth types with comparable
behaviour resulting.
Accordingly subsequent tests were confined to
walls constructed in brick.
The i
on has been confined to specimens of reinforced
hollow masonry
i e filled~cellconstruction.
test
spec imens
9about
L} I ~O"were chosen so as to
effect be introduced. Hence their behaviour should represent that expected of the prototypes. Dimensions and reinforcing details are
in frable 20'1"
All mens were onstructed in the laboratory by a bricklayer, good standards of compatible with construction practice being maintained in all phases of building, All mixes were we batched and control tests of the mortar included flow and
retentivity tests to ASTM specifications C91-68 and C91 respectively.
8
i1 X L~II cylindrical specimens of all mixes were tested in compressionat the time of wall testing.
The walls were constructed on steel base plates to which the
vertic reinforcing steel had been butt welded. To prevent premature shear failure along the base 1" x 1" angle shear connectors 1" high were welded to the base at the positions of unreinforced cores.
Construction was in running (stretcher or common) bond using
nominal mortar joints~ both head and bed joints being fully buttered. A close check was kept on course levels and wall verticality during laying. Flush joints were obtained by striking the excess mortar and rubbing the surface smooth. This joint detail facilitated crack
detection. Particular attention Was paid to removing mortar dags from the cores so as to prevent obstruction to grout flow. The cores were hosed out prio to grouting and weep holes, in the form of a continuous inverted bond beam section at the bottom course, were provided to
fae itate core cleaning The ends of channel were not blocked until free flow of grout down every core was ensured.
2.2 2
b t All halves we cut from these units. average graBs aree of these bricks was
8
and the ratio of netto
g:ross area was 6496. Single units had a compressive st of7500
±
500 on the net area and an initial rate of abao, for
a(to
ASTM specification C67~66) of 255
gm /30 ' 2 / . 1n m1n 1n , th e d ry s a"e. t t However the bricks were dampened several hours before laying and thiswould have reduced their i.r.a. into the range where optimum bond
could be expected.
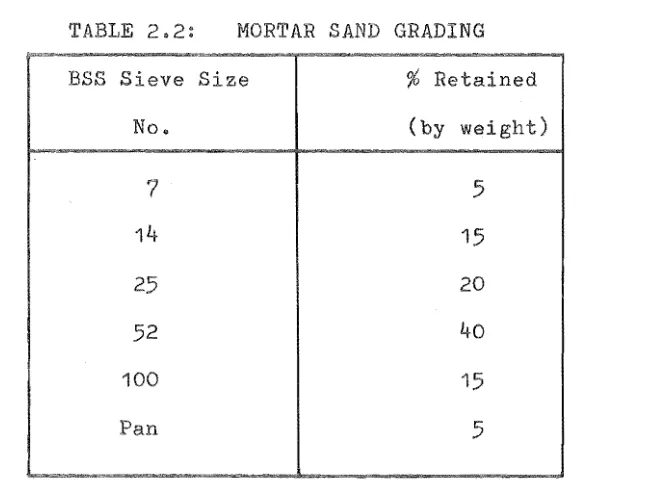
TABLE 2 2: MORTAR
SAND GRADING
BSS Sieve Size % Retained
No. (by wei )
7
5
14
15
25 20
52 40
100 15
5
The basic unit for the concrete masonry walls was the Vibrapac 419
concrete block (the
i
unit in the 4" series) measuring 11i"x
3i" x IIand containing 2 cores approximately
3"
x 11J:" which provides a gross areaof
42 1n2 and a net areaof
77%of
this value. The compressive strengthfor a hollow unit was 5400 + 1000 psi on the net sec on and its i.r a.
was ely
3
gm/30 in2
/minA lime mortar (5 sand '1 cement
o
5
1ime 1.03 water,by weight) with an ultimate strength of + 400 psi, an lnit flow of110
±
5%
and a reten ty of±
was used for walls Thesand was ally graded (Table 2 2) and the hydrated 1 and normal
[image:15.549.88.417.250.499.2]the mortar vuriability.
All cores in every wall, except for unreinforced cores in brick wall
4,
were gravity filled in a single lift with a very fluid grout(3
sand 1 cement : 0 04 Onoda,by weight) having a compressive strength of 2800 + 700 psi.The reinforcing consisted of mild steel deformed bars having
respective yield and ultimate stresses of approximately 50,000 psi and
70,000 psi.
2.2.3 Loading and SUPEort Conditions (i) Loading beam
Lateral load was applied to each wall through a heavily reinforced concrete load-distributing beam cast at the wall top. The beam was
restrained transversely by rollers to prevent wall failure by instability of the load system. Compressive load was applied to the beam end plates on the wall centre-line by a ball seated hydraulic jack and was measured by means of a load-cell mounted between the jack and the exterior reaction frame.
Use of the stiff beam was an attempt to simulate the ideal line load application which is appropriate to the real situation. In much reported experimental work the lateral load was applied to the top corner of the test wall as a point load, not a line load. The mode of load application has a pronounced effect on the extent to which arch action is developed and will thus influence the overall behaviour of the wall.
(ii)
The test rig included a very rigid 111 plate steel base securely fixed
to the test floor. The walls supported on their steel plate bases were bedded with plaster and bolted to this rig for testing.
reates an ial condition, restraining the mortar at the base inhibiting v leal itting of the bricks. However often this vertical
and ae
itting occurred in the first mortar bed above the base it is considered that the basic mode of failure was not appreciably affected by non-representative situation. Further, the tests were deliberately restricted to inve ion of the wall element and i t was considered that a very repeatable condition was obtained with steel without the problems of differing deformation characteristics of concrete bases possible from test to test. Crushing or cracking of the concrete within the base could well have proved a dominant action quite unrepeatable. The rotational deformation of the base, in ular, will have a considerable effect on apparent load-deflection relations of the wall and use of the ri steel base limits this effect ensuring conservative results are obtained.
(iii)
As the bearing load was representing a static superimposed load i t had to remain constant throughout the test duration while the wall under-went eyel
bearing
lateral deformation.
A
series of similar hydraulic jacks, the load-distributing beam, reactedt
high tensile steel rods pinned at their other ends to the test base so that thesystem could move with the wall. They were coupled in parallel to a Riehle
c
test machine that was capable of maintaining a constantfluid pressure. Following initial load application, which was checked indepen by means of a calibrated load-cell and hydraulic jack in a yoke, all subsequent wall deformation in the vertical direction has absorbed by piston movement in the hydraulic jacks Although the Riehle test
machine was several hundred
feet
from the test location and hydraulic pressures of up to 4200 were required, the ramoequipment did not impair operation of the system.
very
succ Beful2 2 4
(i)
The lateral deflection as measured by an Instron electrical resistance strain gauge extensometer at the wall top mid-length and the lateral load as measu
X-Y
pen recorder.(ii)
by the load-cell were tted continuously
In
the earlier tests of this series the top, middle and bottom of aneach reinforc bar was strain gauged with the hope of ascertaining the stress distribution during testing. Shinkoh F102B and Kyowa
KF-foil
type electrical resistance gauges of 2mm gauge length were used. The gauges were bonded to the suitably prepared reinforcing steel with Eastman 910 cement, checked and then, together with lead wires, coated with Budd GW-1 waterproofing compound and covered with a thick layer of molten wax. Strains were measured on a Baldwin strain bridge at each load increment. For the initial elastic behaviour, strain analyses general confirmed the expected behaviour of inc strains in the tensile steel with reasing load. During post-elastic deformations, irregular cracking of the brickwork~ shear deflections producing dowel action and buckling of the steel all affect the at readings. For these reasons i t waS concluded that limited information is obtained from such local strain measurements.The site material did not lend itself to the alternative method of strain measurement over gauge lengths by mechanical means.
As
the
results are relatively unimportantin
an investigationconcerned marily with po c behaviour, further on of strain distribution was not undertaken.
not been included in this thesis.
11.
[image:19.549.68.499.74.375.2]For the purpose of obtaining the deformation characteristics of the wall a number of dial gauge measurements were taken at the wall
for each load increment. They also allowed a check on the base movement of the wall and the extensometer measurement.
The deflection profiles indicated that the proportion of shear and flexural deformation in the elastic region was as predicted by simple deflection theory. However in the post~elastic region no meaningful trends were evident and most measurements only verified the irregular sliding motion of separate wall parts following severe cracking.
The vertical displacement at the wall top indicated the required working range of the bearing load system for the subsequent dynamic tests
d in chapter
5.
For the first cycle in each direction the load was applied in increments of 1 or 2 kips depending on the wall strength. Subsequent sequences of cycling were nominally at some constant deformation,
normally a mul e of the initial yield or maximum load 'deformation This deformation amplitude could not be the same for each wall as it was desired to cycle before major load deterioration had occurred, at least in the earlier cycles.
loaded to failure,
After several cycles each wall was monotonically
The actual sequence of deformations for each wall is evident from the load~deflection cycles
iJuh:t v uur oth walls in relation to these states
I exu::cal behaviou the initial cracking occurs mai in the horizontal mortar joints near the base of the wall and is produced by the vertj al movements necessary in the brickwork to achieve compatibili with the deformations of the aIded steel. After yielding. the load maintains
the
eld level whil the deformation increases until failure is preci tated by crushing, usually accompanied by diagonal cracking, at the toe f the wall The more flexural the wall the er was the ductil capability.di
On the other hand. shear behaviour is characterized by initial cracking resulting in reduced stiffness, virtually no constant load eau but rather a tendency for the load to reduce sharply from the maximum with inc deformation, extensive and sudden damage to the masonry causing loss of strength and eventually wall failure caused by disintegration of masonry at the toe of the wall
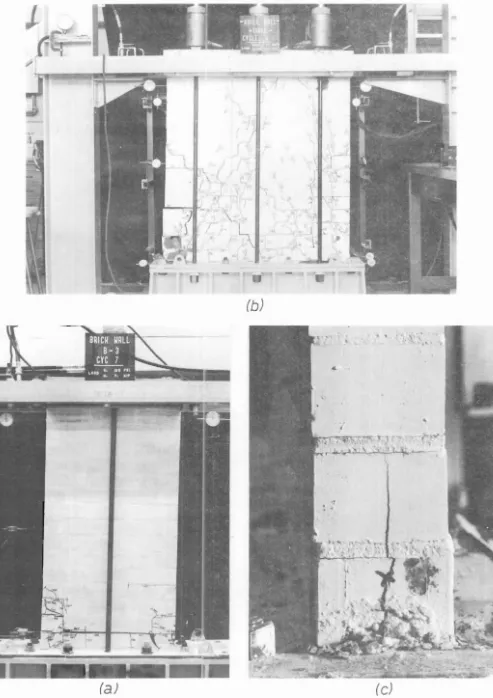
The condition at failure of walls
B3
and3.
exemplifying flexural and shear behaviour respectively! are shown in Figs 2.2(a) and 2.2(b)respectively
For all cases the toe failure appeared to be initiated by tensile splitting of the units following crushing in the adjacent mortar joints, F'i g. 2 2 ( c ) • This typic compressive behaviour prompted the investiga-tion reported in chapter
3.
80me of the walls exhibited a behaviour which was initially flexural in character, and then, because of the overall deformation required of the panel while the wall displaced at eld load, they cracked along the
compression diagonal The behaviour thereafter was shear-like with one important difference in that the panels showed a constant load ateau
at
unlike flexural ductile behaviour This apparent ductility was ace ed by load deterioration when the wall was cycled at constant(b)
raj
(c)
[image:22.551.45.538.59.757.2]forma on Y'88Ghed.
tion of load is presumably caused by progressive deterioration
of the
masonry along the shear cracks but increased deformation bringsinto
ffect d material which allows an increase in load carryingL ty. Wall 1 (Fig. 2. ) is an excellent example of this behaviour wh ch wi be termed "tranEJi t ona1
s results are sed in e 2
3.
Both the estimated and actual maximum loads are recorded When the estimated yield loads were1 ss e estimated shear strengths, flexural post-elastic behaviour
was correctly cted as shown but otherwise shear behaviour prevailed. For those walls in which shear determined the maximum load. the shear
st (ultimate shear stress based on the gross horizontal section) are
recordedo For those walls with initial flexural behaviour the load to
cause yi could be predicted to within a few per cent by equating the moment of this load about the wall base to the algebraic sum of the moment
of the bearing load and vertical reinforcing yield forces taken about the
. ('1 2)
reaction corner. This confirms the findings of Scrlvener ! and it
shows that reinforced concrete ultimate flexural strength prine es can
be ied
to
reinforced masonry walls Brettle(12) alsoh~s
appliedthese iples to reinforced brickwork piers in compressinn and biaxial
b
for the walls ranged from 1 psi
to
260 psi. 'l'hese valll compare with a near constant valueof
143
for a wide :cange wall from chn ider's tests4)
and an average value of 170 psifor those c rete block wall from . I • (2) , . . t1
crlvener s serles con~alnlng 18
o ro
As
expe ar shear ths were associated withTABLE 2.3:
STATIC TEST RESULTS
Wall
Area
Theoretical
Experimental Shear
Predicted
(in
2
)
Yield Load
Maximum
Strength
Behaviour
(kip)
Load
((kip)
CB1
172
10
11.2
65
flexural
CB2
II20
20.5
119
"
CB3
n30
29.5
174
transitional
CB4
II40
44 7
260
shear
1
186
10
12.5
67
flexural
2
It20.6
20.5
110
II3
Ii31.3
30.6
165
transitional
4
n.6
.8
176
shear
5
"
52.6
39.5
212
"
A1
178
48
37.5
210
shear
A2
II48
40.0
225
"
B1
108
9.7(10.8)*
'10
~698
flexural
B2
II16.7
16.6
154
transitional
B3
II6.2(7.3)*
7.4
68
flexural
B4
"
.2
16.0
148
shear
D1
300
30
30.0
100
flexural
D2
II98
70.5
shear
[image:24.549.47.519.91.547.2]17.
250 psi. and B ths of 1 psi and '12 i respect
The values for the equivalen concrete block walls were slightly greater, namely
174
psi and260
psi. Shear strengths of148
psi, 165 and 235 psi from brick walls I3
and D2 respectively, all support bearingstresses of suggest that the shear strengths increase with decreasing aspect rat-J.o. ... The high shear strengths for brick walls
A1
and A2 compared with wall 3 is assumed to be due to the greater shear carried dowel action for the former which are heavily reinforc wallsComparison of brick walls
4
and5
shows the effect of intermittent grout f i l ing. 'rhe shear strength for the partly-filled wall 4 waS 83% of the filled wall More significantly, the loss in both stiffness and load capacity with load repetition was more severe for the in~ermittently filled wall. Moss and Scrivener(3) found that cavity filling increasedthe shear strength and stiffness of reinforced concrete panels by between and 50%
(a)
The most important results obtained, as far as this seismic consideration is concerned, are the load-deflection cycles shown in Figs. 2.3 to 2.11. In all cases stiffness degradation with load
repetition is apparent.
For walls behaving flexurally, the major loss of stiffness occurred between the first and second cycles of each deformation amplitude.
.9-..:t:
.05 ·0 4
4-ND. J
bars
-0.5 -0.4
q
-0.3
i ,;; ..L
16 ·18
-;}4
numbers are
0.3
Loa rJ mOl n fa In/!! d to 2" dlii'ff«tlr:m
~
I
06
()1I!f/ectlof) (ff) )
0.4 0.5
321
llt'e Indicated
! ~ 24
.l(
'"
0<> - . j 115
a
-06 -0,5 -04 -0,3 -02 ·01
-~~---+I----+I----+I--~~I
-~-~----~~~--~~--~----4---~---+-0,3 0,4 05 0·(5
Deflection (in,)
-16
36
•
<I-Nfl. 3 OJ
blllt's J
...
,£l.
24
.l[
L
3'-811.1
'"
(>'"
2 ...
03 0,4
Deflection Un,)
-.,
Q, -i
"tI
"
Q
'"
05 -0 <1 -03
05
12J
e
-8
!:J:O
21
Incrf!!asl!!! 11'1 load
to 10
"'f)
at1 25" dl!!'fl(,c/IOfl
DI!'YIl!'cIIOI'lIIfl)
mamtaml!!C! to 1 I'l" rill fli/!c tion
0'" 05
05 -04 ·0·3
r
-3248
S
40 .lcb
tJ 0
--.I 32
24
-03
·40
numbers i>JI'e rndictJled
03
@
Q= 250 psi@)
q=500 psi
6
04
Load reduces to B lop at '''deflectIOn, them sudden fallur"
-0.2 ·0..1
-0..5 ·0.·4
I
4l'r
J6~
48
.9- 36
~
.J6
-24
·36
2-b
0.·3
..
N27
ars
indicated
rreduces to 8 kip
at 1·5" diilflection
2
0·4 06
Deflection (in.)
250. psi
, t ~ • t
®
•
.
I I I I I
0.·4
Load reduCiils to 12 kip
at 1·8" deflection
0·5 0.·6
-0.6
I
-0. (5 -0.4 -0.2
... 12
12
12
~f6
numbers are indicated
0.6 0.8
Deflection (in.)
2-N9 3
bars
0.4 0.6 0.8 1.0
4-N26 bars
Deflection (in.)
115
- 1.0 -0.8
1.0
TION CyeL
25
indicated
0.4 0.6 0.8 1.0
2-Nf/. 3
Dars
Deflrection (in.)
®
.
....
...
2-N~ 3
bars
Load mllintained fo 3-deflection
1.0 Deflection fin.)
.
-.1
0.3 0.4
Deflection fin.)
@)
q:O-36
q
72
.,
(j-N23
i
60bars
.9-.l;c
...
48'tI
0 0 -'
36
- 0.4 -0·3 -0·2
0.4 0·5
Defledlon (in.)
@)
q:250psi
dlilpl tnd Q r thin wctll the loud carry capacity Was maintained for
a J (d) ill eXt;8SS o f which
is
equivalentto
a ductility factorof ave
On
the other hand for the walls which eO. predom in shearjillustrated by walls
3,
D1,
, B4
etco l the initial stiffness on was and severe load reduction and r stiffness on occurred on each subsequent cycle. Deterioration of the reaction corne):' causes the reduction in shear resistance whereas in flexural behaviour thepost~elastic deflections are due to steel aIding and load capacity of
the reaction corner is not impaired until displacements are reached. This loss of stiffness on load reversal and subsequent eye is attributable to three effects; the opening and closing of cracks, the general deterioration of the load resist mechanism and the Bauschinger effect in the steel. This latter phenomenon, essentially a softening of the steel as a result of post-elastic cyclic loading, has been considered
(12) .
by Kent J.n an "exact" moment-curvature analysis for forced concrete sections.
For the usual seismic-resistant structure reinforced equally for both load directions, , load deterioration would be impossible and very large ductilities could be achieved provided steel bu is prevented Such was not the case. As the axial load in the compression steel
approaches the yield value the critic slenderness ratio reduces rapidly and in many of the test specimens, of the c on toe mat
a1
eliminated sufficient lateral support to allow buckl This prevents the moment resistance of the steel co e reaching its full potentialIt is suggested that further research directed at restraining on steel could be rewarding.
the gross section area. N Z. Building Code(10) allowable value
is
250 for reinforced filled-cell units. However every wall wascapable of supporting its b load until seVere damage had drastically reduced its lateral strengt~. Ultimate capacities estimated from c strengths of three-unit prisms and adjusted using Krefeld1s(13)
corrections for height to depth ratios were 2480 psi for the concrete masonry walls and 2840 for the brickwork walls of aspect ratio one.
The interaction of horizontal and vertical load as found by
Stafford Smith(14) in model in lIed frame tests suggests that for this range of bearing load the lateral strength of the wall will increase with increasing bearing load. results, Table 2.3, confirm this pre-diction However of concern in many instances is the post-elastic cyclic behaviour, and increasing loads are associated with a trend towards more shear-like behaviour. The results of walls B31 B1 and B2 (Fig. 2.9 and 2 10) which have bearing stresses of 125, 250 and 500 psi respecti , show flexural, transitional and shear type behaviour. The ultimate strength increases and the ductility decreases with an increase in load as shown, idealized, in Fig. 2.12.
This implies a beneficial effect in an elastic consideration but conversely a detrimental effect in a post-elastic consideration.
It was considered that walls within the geometric range tested
(aspect ratio 0.5 to 2) have the most complex and unpredictable behaviour As the aspect ratio increases a more fl wall results. Walls of very h aspect ratio can be regarded as long shallow beams with a characteristic flexural behaviour; a well-defined and
2.12: IDEALIZED LOAD-DEFLECTION CURVES
1.0
Fully Restrained End
() 1 2
Aspect Ratio (HIU
EXURAL DISPLACEMENT OF ELASTIC CAN TIL E VER
reinforced concrete (with
for
c material properties) is
applicable for such cases.
Low aspect ratio walls have an essentially
shear type deformation and so may be considered as pure shear resisting
elements with non-ductile behaviour.
However this behaviour is rarely
limiting as these walls generally have very high shear strengths because
of their large sectional areas and problems of structural instability
ffoundations and overturning become the prime restricting criteria.
It
is relevant to note that for elastic behaviour and decreasing aspect
ratios, section strain profiles depart more and more from the linear
distribution
The strain distribution in deep beams has been studied by
D . lSC h .
lnger
( 15)uSlng e as
. 1 t . 1Cth
eory.
For the walls of this series his
results suggest that deviations in the stress pattern from the shallow
beam straight line theory will be small.
The walls whose aspect ratios fall between these distinct types
form a transition zone where behaviour
not clearly defined.
Of
course the transition zone has no distinct boundaries and its range is
also affected by bearing loads and reinforcing percentages.
The theoretical ratio of shear to flexural deformation,
6v
/6f
,
for an elastic cantilever with a free or fully restrained end condition
is given as a function of the aspect ratio, H/L, in Fig. 2.13.
Calculations were based on the following unit load relations:
I::,
=
HL
v
4
3
8
f
::: E(!! )
L
for free end
1
3
6
f
E (li)L
for fully restrained end
The shear modulus,
G,
was taken as
40%
Youngis modulus,
E.
As
the
wall aspect ratio decreases the ratio of shear to flexural deflection
increases.
31.
the ultimate shear str~in of the material is exceeded. 'I'his is the
point at which diagonal tensile stresses cause splitting. Regardless of aspect ratio the same angular deformation produces the same strain.
For pure flexural deformation the ratio of lateral deflection to bending strain increases with increasing aspect ratio. Thus for the same angular deformation, hence shear strain, larger lateral deflections are obtained for walls of higher aspect ratio.
With wall B3 of aspect ratio two, lightly reinforced and supporting a low bearing load (125 psi), flexural behaviour predominated and a large ductility capability was evident, Fig. 2.10.
Comparing walls B1 and 3 (Figs. 2.9 and 2.4), both with bearing stresses of 250 psi a change from transitional to shear type behaviour occurs as the aspect ratio is decreased from two to one.
The behaviour of wall D1, Fig. 2.11, indicates that for low aspect ratios it is virtually impossible to achieve a flexural condition although in this case the maximum load was determined by the flexural strength. Deflections as a result of steel yielding cannot be achieved without excessive shear distortion. Such walls may be regarded as deep beams which are known to have complex behaviour patterns and have been the subject of several reinforced concrete shear investigations.
For deep beam behaviour the geometry is such that the normal mode of shear resistance, namely the beam action and truss mechanism for a
b . f d t' (16)
we reln orce seC-lon , cannot be relied on. It has been thought that the ultimate shear forces have been resisted by arch action.
(17)
However as Paulay has noted for reinforced concrete shear walls, the shear resistance from arch action should not be relied on after cracking. The shear is introduced to the walls through line loads preventing
development of arch action to the same extent as in the "point" loaded case.
courses and so the full shear must be transferred at the compression zone and across the tension steel by dowel action (kinking). The very
favourable biaxial stress condition of the compression zone provides a large shear carrying capacity With successive cycles, deterioration in the compression zone reduces the shear carry capacity by the aggregate interlock mode of shear transfer. The products of crushing the mortar bed act as "lubricant" to the sliding action of shear deformation. This causes a reduction in the maximum attainable load with an increase in the number of cycles as observed in wall
A2,
Fig.2.8.
Thus the upperlimit on the shear capacity of a deep beam after post-elastic cyclic deformation is governed by shear transfer in the reaction corner and
dowel action, provided the section has been reinforced for shear carrying functions
(4) . (1 2)
The racking tests of Schneider and Scrlvener ' established that for anyone masonry material, a reasonably constant shear strength was obtained provided a nominal amount of reinforcing was incorporated. Further, they independently confirmed that horizontal and vertical reinforcing were equally effective in the role of shear reinforcing so that the actual steel distribution had no significant effect on the shear strength but only affected the crack behaviour. Hence an increase of vertical reinforcing will increase the horizontal load to cause yielding of the steel (i.e will raise the flexural strength of the wall) without altering the shear strength appreciably. Walls B1 and B4 with steel contents of
0.2%
and1.63%
respectively illustrate this and show that increas the reinforcing, while other factors remain the same, the effect of increasing the tendency towards shear failure. The superior inelastic performance of wall B1 is clearly evident from thethe wall pe ry May not necessarily produce the most suitable rthquake-resistant structure although, of course, i t is the most effective vertical steel for flexural resistance.
In situations of high aspect ratio a truss mechanism can provide ficant shear resistance but absence of horizontal bars precludes this possibility For deep beams however, the effectiveness of
horizontal shear reinforcing is dubious although i t should help maintain integrity in the wall. By restricting the initiation, growth and
widening of cracks i t should increase the effect of the beam mechanisms of shear resistance, viz. aggregate interlock, frictional resistance and dowel action.
Walls A1 and A2, Fig. 2.8, differed only by the inclusion of horizontal reinforcing in A2. The effect of this reinforcing Was to increase the shear strength by
7%
to 40 kip and create a displacementateau at this maximum load in the first cycle. In subsequent cycles, the shear reinforcing was apparently ineffective and the two walls
behaved sim This agrees with the concept of shear transfer outlined in section 2.3.5.
Another popular form of masonry construction that exists in New Zealand is reinforced grouted masonry. Basically i t consists of
2.4
Contrary to the generally held view, the static test results have indicated that i t should be possible to design reinforced masonry shear walls so that a ductile, generally satisfactory post-elastic behaviour is achieved. For those walls with an aspect ratio of two or more, provided the shear strength exceeds the ultimate flexural strength of the load-bearing section then, predictably, such behaviour should prevail. Low bearing loads, low flexural strengths associated with light reinforcing and high aspect ratios all enhance the prospect of this flexural-type behaviour which is characterized by minor stiffness degradation and negligible load deterioration with load repetition. It is suggested that research aimed at restraining steel from buckling might be a promising method of improving the structural performance of these elements.
The above is not to imply that other behaviour modes will prove unsatisfactory. Indeed a number of walls will be of such geometry that flexural behaviour cannot be obtained. Further, dynamic testing (chapter
5)
has indicated that a potentially flexural situation may not always produce a flexural response. Thus the energy dissipating capacity of shear-like behaviour should not be overlooked.It seems likely that construction practices including steel distribution, anchorage details and grouting effectiveness may prove to be factors of greater importance for satisfactory energy dissipation in this shear mode than in the flexural type and
35.
3
1 INTRODUCTION3
1 1 GeneralThe load-bearing capacity of masonry walls has been the subject of experimental research for many years. The need to establish realistic allowable stresses for design codes has often motivated compression testing of masonry specimens. The effect of varying material properties, eccentricity of load, slenderness ratio and size of test specimen on the crushing strength of walls have been investi ed. It has been found that brickwork strength is only mildly dependent on mortar strength for the normal range and is more dependent on brick
. (18)
unit strength. Several references rev~ewed by Thomas have shown that load factors relating actual crushing strengths to the permi e
(19)
code stress values vary between
6
and15.
reports thelinear correlation between the strength of the brickwork and the tensile strength of the bricks suggesting that a tensile test would be more
appropriate than the current compression test as an index test for bricks. The predominant effect of the deformation characteristics of the joint material as a factor in brickwork strength has been recognised for some time but only recently has a systematic approach been applied to this research. Many other material properties of masonry have been
. (20)
investigated and are reported by Sahl~n •
The raison d ' for an investigation of this nature within a seismic study may not be obvious However, observation of the wall panels subjected to the lateral cyclic loading revealed that the
the flexural compreB~ion zone , especially for those walls supporting large bearing loads. At this stage in the loading cycle, tensile cracks between the wall and the foundation had formed so that the majority of the bearing load was being carried on a relatively small area at the wall toe. Due to the presence of shear the material in this region is thus subjected to a compressive force which is assumed to be directed along a line inclined somewhere between the vertical and wall diagonal. The appearance of the material failure, Fig. 2.2(c), was so similar to the splitting failure associated with the direct compression loading of masonry specimens that an experimental programme consisting of direct uniaxial compression tests on masonry prisms was devised. In particular the failure mechanism and its critical parameters were examined.
Subsequently, promising ways to prevent sudden or brittle compressive failures were attempted. The aim here was to find a joint material that would bond masonry units together and also achieve a restraining effect on the units. Increases in both the masonry strength and the maximum compressive strains attainable were desired and in this re~pect
the problem was analogous to that solved by the lateral confinement of plain concrete.
The major cause of the difference between masonry and other brittle materials, including plain concrete, is the inhomogeneity brought about by the jointing material which consequently became the main parameter of the test series. Joints used were made of:
(a) steel or rubber bonded with epoxy resin
(b) cement or lime mortars of differing strengths and thicknesses (c) mortar beds with various patterns of
i"
diameter black wirereinforcing.
the train behavi r up to maximum load has been studied in the past and so it waS also an objective of this research to obtain compJ.ete stress-strain curves for masonry materials.
3.2
3.2
1The difficulty, on a normal compression test machine1 in obtain
the stress-strain relationship after maximum stress has been reached, is well known, The usual test machine is an apparatus for apply load rather than one for controlling deformation, which is necessary when obtaining the complete stress-strain curve. Barnard (21) has observed that to prevent rupture of a specimen the test machine must be stiff
enough to allow the load to falloff in a failing specimen. A modification of some conventional testing machines is possible and Brock(22) used a
/
method where the control of load was transformed into a control of strain. Special machines which will automatically deform specimens at a constant
t
t d b Roo h ( 23 )ra e are repor e y usc •
A 600,000 lb Avery compression testing machine in the Civil
Engineering Department, University of Canterbury, was found to have the stiffness and hydraulic cheracteristics capable of applying strain at a desirable and near constant rate to the particular specimens under test. After pre-setting the load valve a constant flow of hydraulic fluid to the loading piston ensured a constant rate of deformation. No further adjustment of the valve was needed.
The stress-strain tests were conducted at a nominal strain rate of 0.2% per minute. )has shown that the stress-strain characteristics of concrete are markedly affected by large changes in the rate of strain However comparative tests within this investigation showed that alteration of the straining rate within the range 0
05%
per minute to G perA continuous load~deflection record for each specimen was obtained
u an X-Y plotter. Deflection input was from an Instron electrical resistance strain gauge extensometer mounted between the hydraulic ram and the fixed spherical head of the test machine. A
6"
Sanborn LVDT displacement transducer fitted to the load indicator of the test machine gave the load input.Compression tests on mortar cylinders, 4" high by 2" diameter, were undertaken on a ,000 lb Avery universal test machine. In these tests a Hounsfield extensometer with a mechanical unit was used to drive the graph drum of the test machine. Lateral deformations were obtained using two Philips inductive displacement pick-ups diametric opposed and mounted at the mid-height of the test cylinder. Displacements were read on a Philips bridge. Thus the variation of Poisson's ratio with stress was able to be determined.
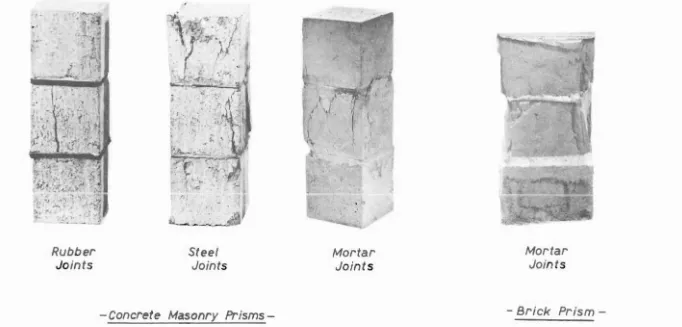
Each test prism was constructed from three nearly cubic solid units of either brick or concrete block bonded together with the appropriate jointing material, Fig. 3.1. Care was taken to ensure that the units were laid horizontally and squarely. The prism ends were c with a thin Plaster of Paris layer. The brick units were halves cut from a brick with an endwise compressive strength of 9100 psi and an i r.a. of 50
±
15gm/30in2/min. The concrete blocks were cut from Vibrapac 417 units which had an average compressive strength of 5000 psi and an i.r.a. of approximately 4gm/30in2/min.Approximate prism dimensions were: concrete blocks 3i" x x
Rubber
Jo
int
s
Steel
Joint
s
- Concrete Masonry
Prisms-Mortar
J
o
i
n
t
s
Fig.
3.1 :
TYPICAL FAILURES OF CONCRETE
&
BRICK MASONRY PRISMS
)Mortar
Joi
nt
s
[image:47.821.55.737.68.395.2]Prism-tested at a wide range of ages, the mortar strengths were usted to
8
d t . P ' I (24)
f2 - ay strengths for compara lve purposes rlce s curve or air-cured specimens of concrete. The particular specimens showed a rapid increase in strength with age and a sudden levelling off at an age of about 20 days which fitted Price's curve and the available data satisfactorily.
3·3
Specimen shape is an important factor in compression tests. For short specimens the failure mechanism is affected by the frictional restraint at the loading ens. As the height to depth ratio, hid j
increases the influence of the restraint reduces causing a reduction in the apparent compressive strength as the failure mode changes from one of shear to tensile split Such was observed by Krefeld(13) who investi brick prisms with hid ratios varying from 1 to 12. The prime criterion to satisfy in any test specimen is that the "correct" failure mode occurSj that in fact the specimen is being subjected to a condition that represents the prototype behaviour. Intuitively, if one considers the effect of the platen to be confined to a
45
0 inclined pyramidal zone then in a prism consisting of three cubic blocks the central block and its two adjacent mortar beds will be free from any end effects. For the prisms in this series with square sections and hid ratios of 3.2 and 2.1 for concrete block and brick respectively, the desired failure by tensile tting was achieved, justifying41.
Masonry is a tIe mate a1 strong in compression and therefore i t is reasonable to borrow from the information available on the behaviour
concrete compressive specimens,
Newman and Lachance ( ) showed that in addition
to
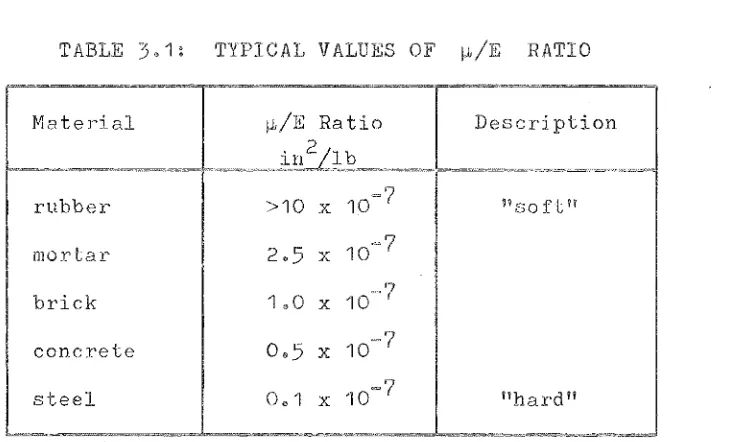
the shapesize of the test specimen, modes of deformation and failure of concrete compressive specimens are affected the type of aten packing which is described a "softness" vc11ue given in Table
3.1
and define as ratio of PoisGonis ratio to Young's modulus, ~/E. Th suggestthat
two distinct loading effects are introduced in the ends of the specimen;(a) Tangential or frictional stresses are set up which are compressive with "hard" packing, e.g steel. On the other hand with !lsoft" packing, e go rubber, the tangential
stresses are tensile and can cause failure to be initiated at the ends of the specimen.
(b) Vertical stress concentrations can occur which result in lateral tensile stresses in the vertical ane.
With hard ens~ short specimens are subjected to triaxial
compressive stress and the failing load, and hence the apparent crushing
I increases with the frictional resistance ied by the atenso
This effect decreases as the t/width increases and becomes insi f. ' , J.~
cant for a height/width ratio of about 2~. If however an increase in the height/width ratio involves an increase in volume, the probability of erous flaws occurring is greater and so failure is statistic more at a lower crushing strength.
Soft packings have two effects;
(1)
They cause tangential tensile stress due to friction which probably dies out at a distance from the ends to the width of the specimen;loaded face c produce a lateral tensile stress to cause cracking ( i t t parallel to the axis of the specimen. As the thickness 0 the soft packing increases the vertical loading becomes more concentrated creat an increased. lateral tensile stress. But as the specimen height increases, the area under tension also increases reduc the stress level and hence inc the apparent G strength
TABLE 3.1: TYPICAL VALUES OF ~/E RATIO
Material ~/E Ratio Description in'/lb
rubber >10 x 10 ~7 "soft"
mortar 2.5 x 10~7
brick 1.0 x 10- 7 concrete 0.5 x 10- 7
steel 001 x 10- 7 "hard"
Using the above information i t is reasonable to a likely behaviour for masonry. The failure mechanism is considered to be
endent on the difference in the elastic properties
of
the jointing and unit materials. Strain compatibili at the joint interface causesial stresses to be set up in the unit and joint materials. From Table 3.1 it is that the mortar joint is typical "softer"
than the unit material. Thus as the mortar joint is restrained from deforming late 1 compressive ial stresses are introduced into
the mortar and tensile tangential stresses are introduced into the
[image:50.549.73.493.52.561.2] [image:50.549.99.468.270.491.2]condi tion tll th prism a desirable state of triaxial compression would exist in the mortar and an undesirable state of combined uni al compression and biaxial tension would exist in the masonry uni The triaxial compression condition of the mortar increases its compressive s but when the enhanced crushing strength is reached the
accompanying large lateral strains cause lure of the unit by vertical itUng which leads to eventual collapse of the smo The existenc of very large lateral strains in concrete as the longitUdinal strain corresponding to the maximum compressive stress is reached and exceed
(22)
is reported by Brock and a very similar behaviour for mortar has been confirmed in this investigation fng additional evidence in support of this failure mechanism It is further substantiated by the experimental work of Somerville( ) on joints for precast concrete components. The masonry units commonly used in construction today
'have a rela ti low height/width 0, so that lateral tensile ~tresses caused by vertical load concentration may also be significant.
The failure mechanism t outlined, the behaviour of masonry
experienced during the tests and the inferences drawn from this behaviour agree so much with Hilsdorfis failure criteria( ) that it is app ate to describe it The development of stresses as they may occur in a
single brick within a masonry unit subjected to axial compression in the y direction are shown in Fig.