warwick.ac.uk/lib-publications
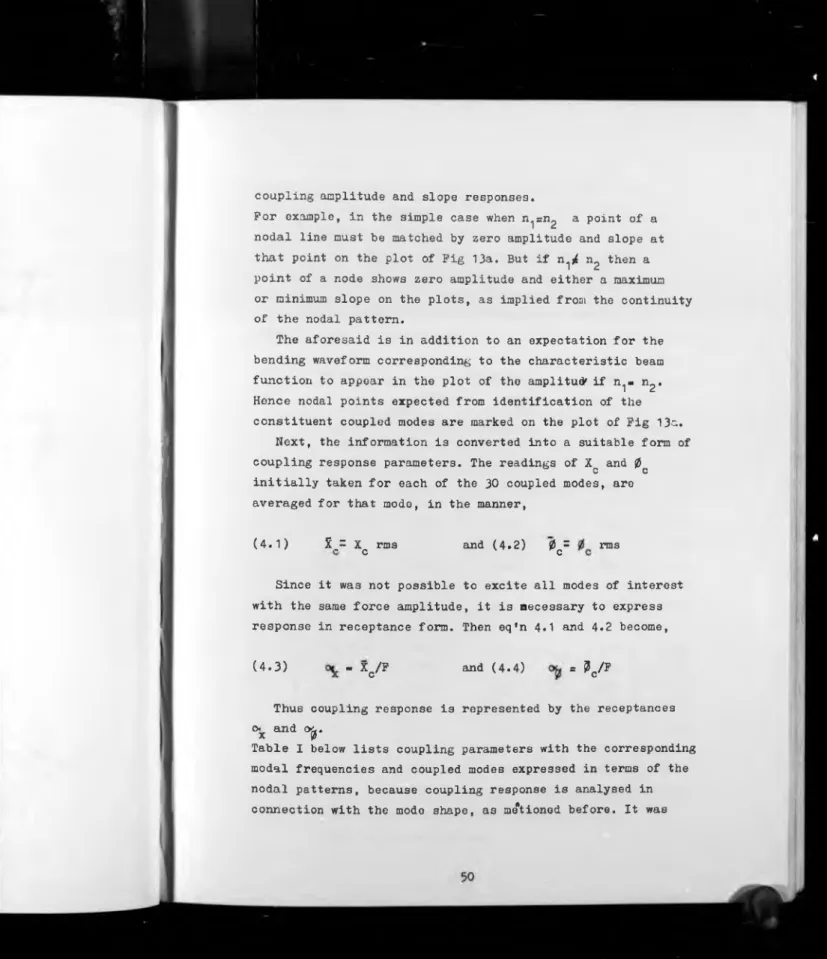
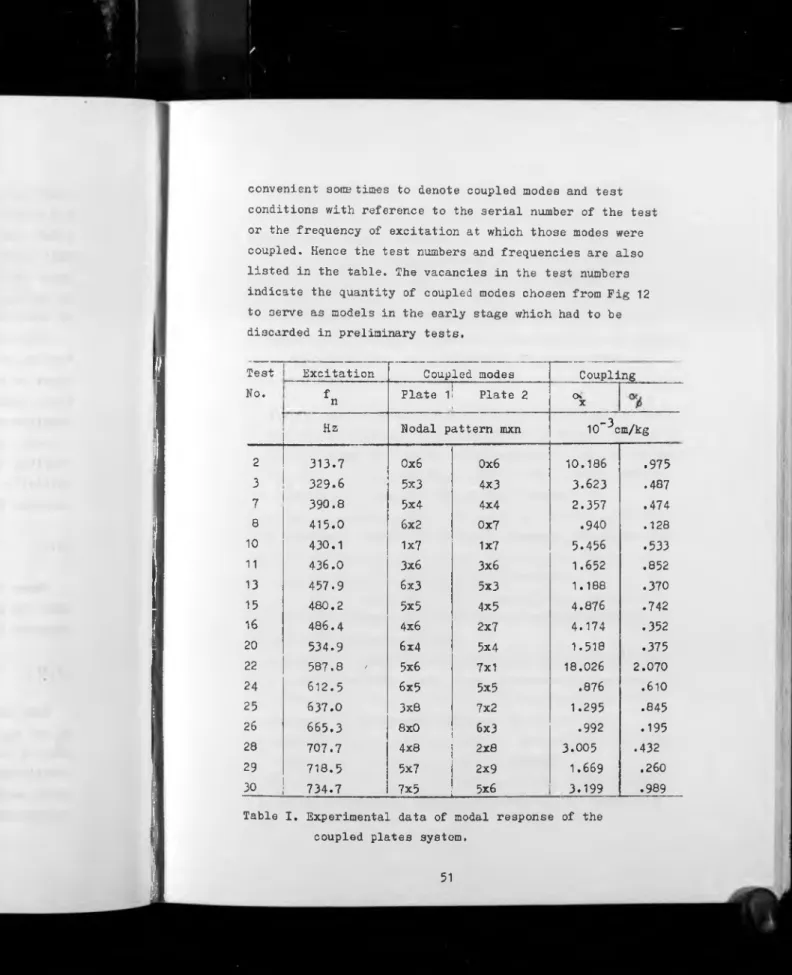
A Thesis Submitted for the Degree of PhD at the University of Warwick
Permanent WRAP URL:
http://wrap.warwick.ac.uk/97439
Copyright and reuse:
This thesis is made available online and is protected by original copyright.
Please scroll down to view the document itself.
Please refer to the repository record for this item for information to help you to cite it.
Our policy information is available from the repository home page.
REPRODUCED
FROM THE
BEST
AVAILABLE
COPY
ABSTRACT.
In this thesis, response distribution in a class of
conservatively coupled plates system is investigated
experimentally. The ratio of the space-average, time-
maximum response of the coupled plate3 is shown to be
proportional to an empiric expression of the space-average
time-maximum rotary and transverse receptances, and the
time-maximum receptance of the point where the disturbing
force is applied, which are parameters open to measurement.
The amount of error of estimating response ratio
through applying the expression is analysed and found to
be small.
A brief survey of potential applications of the results
of this project to practical structures follows, together
with proposed additional work to extend the validity and
applicability of the findings.
Experimental techniques and apparatus are discussed and
described in great detail. An innovation in the experimental
set-up is associated with the construction of non-contacting
transducer, fitted to a scanning rig, employed to detect
response distribution in panel type vibrating elements.
Since the experimental apparatus proved useful for the purpose
of the project, further work is suggested in order to improve
its versatility and develop the rig into an industrial tool,
to fulfil a much needed function in dynamic testing.
It is suggested that the methods developed in the thesis to
estimate response distribution experimentally, have some
advantages over present day methods, which is demonstrated
by comparing the procedures and some of the basic assumptions
Acknowledgement.
I take pleasure to acknowledge the guidance and
assistance given to me by Dr. V. Marples of the
University of Warwick.
Thanks are due to the technical staff of the
School of Engineering Science for their help
whenever requested.
The financial contribution of the Science Research
council towards the construction of the rig and
purchase of the instrumentation is acknowledged
with gratitude.
I wish to thank my wife Ophira for her encouragement
and for typing the thesis.
Table of contents.
1
.
2
.
3. 4. 6.
Description of thesis work
Introduction...
Review of previous work
Energy distribution
Experimental techniques discussion.
Normal modes
Response distribution
Model parameters
Coupling parameters
Errors
An apparatus for studying response distribution
in coupled flat plates...
Specification
Experimental rig
Calibration
Preliminary results
Discussion
Conclusions
Experimental results.
Presentation
Consideration of error
Analysis
Conclusions ...
Response distribution
Validity and extension of finding
Concluding remarks
Appendix ...
Theoretical model
Plate vibration
Types of coupling
Experimental rig usefulness
References
List of symbols
DESCRIPTION OF THESIS WOH
The work reported in this thesis is primarily concerned with
the transmission of structure-borne vibrational energy. The
investigation is mainly experimental, centering on the response
distribution in a pair of conservatively coupled structural
elements.
The ultimate gaol is to establish the response distribution
in a system of 2 coupled elements, to show that the distribution
is proportional to a coupling parameter which is open to measure
ment, and to obtain the characteristics of that relationship.
Determination of the relationship between the coupling parameter
and response ratio facilitates assessment of energy distribution
in a practical situation b y using comparatively simple means.
The thesis opens in section 1 with an introduction of the
problem of the flow of vibrational energy in complex structures.
A short review of previous investigations related to that topic
follows. The review tends to focus on the part of work which
is directly related to the topic of this thesis, namely the
flow of vibrational energy through the coupling. The second
part of the section presents the mathematical formulation of
the flow and sharing of energy which form the basis for this
research.
In section 2 of the thesis,experimental techniques are
discussed. A chart is drawn to aid the planning (Pig 2) and the
ways to attain the parameters outlined. A scheme to detect and
appreciate errors which may be introduced into the results is
worked out.
Section 3 is a self-contained part of the thesis which deals
with the experimental apparatus. An experimental rig,
essentially a measuring device, was constructed to detect
A plate was chosen for a specimen because it is of distributed
mass and elasticity, yet which lends itself to both prediction
and measurement of the dynamic parameters.
The experimental set-up is specified, the mechanical
construction and signal network described and evaluated in
the light of preliminary results.
Records obtained in a series of experiments are presented and
discussed in section 4.
The analysis is greatly aided by an analog 2-degree-of-freedom
model developed in appendix 6 I. Errors in the records of the
response parameters are examined.
Energy distribution is computed from the experimental data for
some selected normal modes.
In section 5, conclusions are presented, which fall into two
main categories. Those related to response (and hence energy)
distribution, and those related to the experimental set-up.
It wa3 shown that response ratio of a conservatively coupled
plate system, sinusoidally excited, is proportional to an empiric
expression of coupling and input receptance.
Finding and techniques employed in this work are compared to
previous work in the field, and some further research is
suggested.
Several different items are contained in the appendix,
(section 6), some of which are off the main interest of the thesis.
A discussion of plate vibration with particular reference to
experimental data on coupled modes and the 2 types of coupling
tested in the course of the work.
The scanning rig usefulness is reviewed in connection with
the variety of applications it had for the purpose of the
1. INTRODUCTION.
’ ' ’
The trend in recent engineering development towards lighter,
m ore complex and rigid structures, together with more powerful
propulsion systems has resulted in increased noise and vibration.
T his is due to the coiabinod effect of reduced damping in
structural members and joints and to higher levels of vibration
excitation.
Dynamically a structure can be described as consisting of a
chain of structural elements of different types linked together
in various ways forming a path for the transmission of
vibrational energy. Some components receive their excitation
directly from a mechanical source or from the environment,
others indirectly through transmission, refferrod to as
structure-borne sound.
Hence all parts of the structure can be excited, even those
remote from the sources. Panels and plate elements play a
particularly important role in that when excited, they couple
well with the surrounding fluid, radiate noise and conversly
are relatively highly susceptible to excitation to vibration
by incident waves.
I.Review of previous work.
One way to tackle this problem is to reduce the flow of
vibrational energy through the structure in order to isolate
the source of energy from the receiving parts. Several
techniques have been attempted. Here we mention a few of them.
Mizutani (1) used small vibration generators to supress some
of the vertical modes of vibration of a ships' hull. In his
theoretical study he assumed the hull and superstructure to
have dynamic characteristics similar to that of a beam.
Adams investigated the effect of inserting parts made of a
damping material, of the appropriate mechanical properties,
on the dynamics of a steel plate (2). The effectiveness of the
treatment depends entirely on the position of the inserts
relative to the vibrational mode shape.
Another method is to reduce the flow of the structure-borne
sound through the coupling which links together constituent
elements. This involves a study of energy-sharing between
coupled subsystems.
The simplest subsystem to study comprises a pair of coupled
structural components, one of which is directly excited, energy
passing through the coupling to the other one, it thus being
set into vibration.
This concept was utilized (3) to estimate vibration
transmission of the spacecraft Mariner '69'. The craft was
assumed to be divided into 4 subsystems coupled together.
A set of 2 coupled subsystems was studied in turn.
The methods used in the investigation, which have been
developed during the last decade, were derived from the theory
of room acoustics, and became known as the statistical energy
approach. In this approach modal energy is taken as the primary
variable, and then coupled oscillator theory is applied to
calculate the flow of energy between coupled structures,
for the latter step to hold, it was assumed that the vibration
characteristics of each substructure are quite similar to the
vibration characteristics of the substructure when it is
isolated from the other substructure.
Lyon and Eichler first used the statistical energy method to
study the response of coupled structures to random excitation
(5). They computed the energy flow in a system connected
by a small linear conservative coupling.(i . e . That neither
generates nor dissipates energy). They showed that the time-
average flow is proportional to the ij.i'eronco in the
average energy stored in the subsystems, and that energy
flows in the direction of the energy gradient. They concluded
that such a coupling t-nds to equipart the energy.
In this approach, the f low of energy from one subsystem to the
other is governed by two kinds of los3 factors.
In a 3tudy of absorption of energy in plates, Heckl suggested
to group losses of energy into distributed and localized
damping (4).
Distributed damping is related to losses of the separate
subsystem through hysteresis in the material, sound emission,
and air pumping. Localized damping is associated with losses
of energy through the boundary owing to coupling to another
element - the coupling loss factor.
Scharton (6) proved the time-average power flow between randomly
excited coupled oscillators is proportional to the time-average
energy difference of the oscillators even for strong coupling.
But this proof was not extended to coupled structures.
He focused on the conceptual difficulty to devise a technique
to divide an elastic system into coupled subsystems in such a
manner that the motion of the coupled structures can be described
in terms of the coupled structure modes.
One of the gheat difficulties in applying the statistical
energy method to predict response levels of coupled structural
elements is to determine the loss factors»
Lyon and Scharton reported detailed investigations of the
v/ays to compute the coupling loss factor (7) and Ungar reviewed
the stato of art (8) in 1966.
Scharton computed a proportionality factor, the coupling rate
factor, in terms of 9 parameters. 3 represent each subsystem
in the coupled but blocked situation (i.e. such that one
subsystem is allowed to vibrate, while the other is held fixed),
and 3 coupling parameters.
It is shown analytically and experimentally, that for sine
excitation the coupling can be negative and energy does not
always flow in the direction of the energy gradient. Thu3 the
tendency towards equipartitioning of energy does not exist in
this case. Ungar stated categorically that the coupling loss
factor can be determined only by experiment, through testing
the structures in the coupled and uncoupled situations.
Rosselli attempted to measure the transmission of random
vibration between conservatively coupled aluminium plates (10).
Measured values were compared with a theoretical prediction,
using the statistical energy approach. Loss factors were
determined in experiment by decay rate technique.
The poor agreement between computed and measured energy flow
seemed to stem partly from errors inherent in the experimental
techniques.
Experimental work carried out alongside the analysis show a
significant amount of divergence from the theoretical predictions
of energy, or response, distribution. This was attributed
mainly to the drawbacks associated with an assessment of the
coupling loss factor in particular.
To ease the problem, it was suggested by Ungar (8) to define
loss factors in terms of quantities of energy instead of
viscous damping. The los3 factor being defined in relation
to energy dissipated in an element, and the coupling loss
factor, to energy flowing to the other element through the
coupling.
This problem was tackled recently by Newland (9) from a
different angle. A different coupling rate factor was
proposed which is related to a new parameter, the rate of
shift of the modal frequency of an oscillator as a result
of the presence of a coupling. Hence power flow is
The amount of energy stored in an element depends, therefore,
upon the quantity of energy a A T being generated at the
source and delivered to that element.
When another element is coupled to that element, it can receive
the energy to maintain it3 motion through the directly excited
element and the coupling only.
Now the amount of energy generated in the source and passed to
the conservatively coupled system, in the steady state, becomes
(I.3 ) T in r AT.J+ A T 2
This amount is fed into the element which is directly excited,
henceforth called the primary element, of which an amount A t^ flows through the coupling to the receiving element.
P rom the view-point of the primary element A T „ i3 lost by the
*-provision of a coupling.
Now one can think of "balance of energy" where the sum total
of energy needed to maintain the motion of a set of coupled
elements, in the steady state, is that flowing from the generator
into the vibrating system,
a t
i-1
where losses in joints are included through being counted as
elements. Prom eq'n 1.2 it is apparent that the losses are
proportional to velocity, so we prefer to deal with kinetic
energy which is proportional to the same parameter.
Sharing of energy is defined as the ratio of modal kinetic
Setting ( 1 . 4 ) M^/Mg and bearing in mind that q c qu) we have,
( q . w j 2
1 2 ' (q2^ 2 )2
and since both elements in the coupled system oscillate at the
same frequency we finally end up with,
(1.5) a y T g . /x(qi/q2 )2
The energy flowing from the generator via the primary element and
the coupling into the receiving element A T ^ is referred to as
the flow of energy and is the only quantity of energy passing
through the coupling
(1 .6 ) 4,T2 = 1/2 C2(q 2w )2
Prom the aforesaid it is clc.ar that the loss of energy in each
element is proportional to the motion of that element. So
vie may exj ress tJie flow of energy as a function of quantities of
energy in ratio form, which may prove more practical in
experimental work. Rearranging eq*n 1.3 we have,
(1.7) a t 2 = ---
----For practical reasons we wish to express the ratio AT^/aT2 in terms of measurable parameters.
x2
(1.8) a T^/AT2 ¥ » i>‘ °2<‘>2>'
Substituting eq'n 1.8 into 1.7, the energy flow becomes,
(1.9) AT, in
1t0l’ l2 /C2’22
11
2. EXPERIMENTAL TECHNIQUES DISCUSSION.
Planning of experimental techniques is guided by the
requirement of parameters to compute eq'ns 1.5 and 1.9 governing
energy distribution, by the search for parameters representing
coupling response, and by the methods adopted to detect and
assess errors in the results.
I. Normal modes
A plate, being of distributed mass and elasticity, is a multi-
mode system. Mode shapes and modal parameters depend on material
properties, body geometry, boundary conditions and frequency of
excitation.
A plate element subjected to transverse sinusoidal excitation
at a natural frequency, vibrates in a normal mode. The motion of
each particl*. of the element consists of a rotary component
and a displacement component perpendicular to the plane of the
plate which are associated with bending waves in the plate.
Points of zero perpendicular motion, are of maximum rotary motion
and are referred to a3 Nodes.
Mapping nodes of a normal mode yields a pattern related to the
mode which is uniquely representative of that particular mode.
Hence a nodal pattern can serve to identify modes.
Pig 1b exhibits a nodal pattern of a normal mode. The pattern
was obtained by sprinkling dry sand on a rectangular plate,
freely suspended, sinusoidally excited at a modal frequency.
Since nodes are points of no transverse motion, (It practice it
would be more precise to say: least motion ) the sand tends to
accumulate along the nodes. The nodal pattern thus obtained is
known as Chladni Pattern.
To a first approximation bending waveforms of vibrating
plates can be assumed to be similar to those of vibrating beams.
The waveform of a vibrating plate will be the product of the
characteristic beam functions for two vibrating beams with the
appropriate end conditions. Thus for a rectangular plate having
4 free idges the approximate waveform assumed will be the
product of the characteristic functions of two beams with free
ends. This is illustrated in Pig 1a by a drawing of the mode
of vibration showing the waveforms of the characteristic beam
functions along the edges. Opposite edges have the same waveform.
Assuming a vibrational mode shape for a given plate and the
boundary conditions, it is possible to calculate the modal
frequency and predict response distribution in nondimensional
units as has been described by Warburton (11) .
A description of an elastic, multi-mode element essentially
incorporates information on the modal density. A metal specimen
possesses a comparatively high modal density. Hence modes are
often close together (see Pig 12) causing an off resonance
excitation of modes adjacent to the normal mode of interest.
In the vibrational mode shape this results in extraneous motion
being superimposed on the normal mode motion and consequently
in a nodal pattern, different from that predicted.
In normal resonance testing to determine natural frequencies
and other modal parameters the method suggested by Kennedy and
Pancu (12) and evaluated by Bishop and Pendered (13) is admirable.
This method requires accurate measurement of the phase between
the disturbing force and the vibrational point-response and
leads to separate the pure mode part of the motion from the
off-resonant contribution. For the purpose of studyin.- energy
distribution separation of modal components is not necessary.
Moreover, such a separation will introduce an appreciable error
into the results because the off-resonant motion stores and
dissipates energy as well as pure mode motion.
However it is then BBcessary to speak in terms of the resonant
state and frequency being defined as that state and frequency
at which maximum displacement response per unit force input
occurs .
Modal parameters are defined in such a manner that the peak
amplitude plot yields damping ratio and resonant frequency.
It has been assumed by investigators of energy distribution
in coupled structures that the mode of vibration of each sub
structure is similar to the mode of vibration of that substructure
when it is not coupled. Hence it is possible to divide any
structure into isolated substructures and then to couple
together modes of these substructures to obtain formulation
of the systems' dynamics ( e._. see ref. 6 p. 53).
Coupled-mode representation of coupled structure vibration
is a crucial question in this work since the philosophy of
planning the experimental techniques is strongly based on the
presence of coupled normal modes in the coupled plate specimen.
Evidently, identifying pairs of modes, coupled together in the
vibrating coupled plates is essentially the basis of our
technique through being employed to determine response
distribution in each plate.
In view of the aforesaid and because the coupled-mode
assumption has never been verified, we prove its validity
by experiment as described in section 3 and analysed in section
6 II. The record displayed in Fig 23 is an explicit indication
to that effect.
The procedure to obtain the dynamic mass and damping
coefficient of the subsystems' modes involves testing each
of the coupled plates being uncoupled in order to determine
those parameters without interference owing to interaction
with the coupled element. Validity of this process is subject to
the assumption that the modal damping and mass of the
uncoupled modes remain approximately unchanged by the provision
of the coupling.
This is true if the mode shapes and bending waveforms of the
coupled and uncoupled subsystems are similar, however distorted.
Clearly, while the stiffness, and hence resonant frequency, are
changed due to edge restraint applied by the impedance of the
other plate owing to the coupling - damping and mass distribution
are expected to change only slightly, and only in the immediate
vicinity of the coupling. Unless the condition of similar mode
shape is met, error is introduced into this latter statement
about damping and mass distribution.
Ways and means to detect and assess the error are dealt with
later in this section.
II. Response distribution
Next, we examine the plate response distribution. In section 1,
stored energy was defined in relation to transverse motion.
The effect of rotary motion on the calculation of modal
frequencies of beams is given by Timoshenko (p. 334 of ref. 14).
A similar calculation provides an idea of the orders of
magnitudes of errors involved in energy considerations, by
ignoring rotary inertia effects. Thus the correction of a
calculated natural frequency of the 10th mode of a beam, 26"
long and 1/8" x1" cros3 section, is .63%, which is insignificant.
Although the 10th beam mode is well above the frequency region
of our interest, it is important to bear in mind that the
errors due to neglecting that effect become significant in
higher modes when the element is subdivided by the nodal
pattern into comparatively small portions. Then not only the
error grows but the nodal lines become closer and closer,
until it invalidates the assumption that the length of the
element is large as compeer ed to the thickness dimension.
For a plate vibration where transverse response is distributed
functions and rotary motion neglected, the energy is stored
and dissipated unevenly over the plate area. Thus we shall
refer henceforth to time-maximum, space-average energy
distribution. Consequently the generalized coordinate q is
replaced by the coordinate of transverse position X, and
velocity X.
This step greatly simplifies the task to obtain response
parameters, at the cost of a small amount of error.
The time-maximum displacement response at a point (x,y)
on a plate vibrating in a normal mode is given by,
(2.1) X(x,y) =r 0(x)j*y)
where 0(x) and pty) are the characteristic beam functions in
x and y directions respectively.
Now the space-average time-maximum plate displacement per
nondi'^cnsional unit response can be obtained,
(2.2) X = Xrms
-
iT
hiJ
J
0 0
X (x,y) dx
1/2
where h and 1 are width and length of the plate.III. Modal parameters.
Damping coeficient of vibrating systems can be determined
from a record of the exponential decay. But it is difficult
if not impossible to use free decay rate technique to determine
the damping factor of multi-mode systems such as plates,
because many modes would be excited and it would be extremely
difficult to determine the response in any single mode and to
identify that mode. The extent of the problem can be estimated
from the modal density of the plot in Pig 12.
It was decided therefore to employ steady state techniques.
For an uncoupled plate, vibrating in a normal mode, the amount
, /.
of the space-average, time-maximum energy dissipated in the mode,
is the time-maximum energy input from the vibration generator,
namely,
t 2 1
F X in^ = 1/2CXC = 7 2c(ii)'
The modal damping, in terms of :f the resonant frequency,
(2.3) C
P X. in
which is an approximation, defining modal damping in a plate
element. The ratio of modal damping as required for eq*n 1.9
can be obtained from the response of the separate plates, each
vibrating in the same normal mode as that of the respective
coupled plate. This statement amounts to C./C„ = C /C, where 1 2 a b
the subscripts 1 and 2 denoting the coupled plates, correspond
to a and b denoting the same plates in the uncoupled state.
Then modal damping ratio becomes,
(2.4) C , / C 2
P X.
a m . a fn.b
P X
n , a b i n ,b “ a
A plate vibrating in a normal mode can be represented by a spring-
mass-dashpot system where the coordinate of motion of the mass
represents an equivalent of the response distribution of the
plate element X. Similarly the distributed mass, stiffness and
damping are represented by equivalent M,k and C respectively,
of the single-degree-of-freedom damped system. Thus modal mass
can be expressed in terms of modal damping, resonant frequency,
and the magnification factor Q. The ratio of the modal mass
of the coupled modes is given by,
2 1^2
y X
C f . r 4Q -1 1 (2.5) f , . _ g _ ]
b n,a 4Q.-1 J
A straightforward implication of eq'n 2.2 in that X is obtained
by integrating the plate response point by point. Thi3 would
be an impractical proposition, and costly. So a technique was
devised, consisting of measurement and computation, which is
based on the concept of plates vibrating in normal modes.
In this technique we record the bending waveform of the plate
vibrating in a normal mode, along an arbitrarily pre-determined
part of the plate, a circle of a fixed diameter and centre.
Such a record is uniquly representative of the vibrational
mode. The mode shape, nodal pattern, and the bending waveform
along the ciicle of a given mode are shown in Pig 1.
The use of the record is twofold, as outlined below. As stated
earlier, given the situation and the mode shape, it is possible
to construct the bending waveform theoretically. In this work
we used the charactristic beam functions given by Warburton
(11), to construct the bending waveforms along a circle for the
same conditions (plate, radius, centre, boundaries) for all
the modes included in the frequency band of interest.
Thu3 we had a catalogue of bending waveforms for each of the
plates. Comparing the recorded bending waveform to the
appropriate catalogue yields the identification of the mode.
A space-average displacement of the complete plate X^ per unit
nondimensional response, is calculated from eq'n 2.2.
Further, a similar average of the displacement along the circle
X t being the average of the displacement of the theoretical
bending waveform, obtained. (See Pig 29).
Since it is possible to measure the value of the recorded
bending waveform mentioned above, an experimental parameter X^,
corresponding to the theoretical parameter X, was determined. t/
The recorded and the theoretically constructed bending
waveforms of the respective normal modes are expected to appear
illustrated in Pig 11.
It follows that the ratio of the recorded and the computed
averages, yields a factor N, referred to in the thesis as the
normalizing factor.
(2.6) N = i j X t
The factor N when accommodating a difference in scale only,
that is when there appears to be a good agreement between the
waveforms, can be thought of as a dimensional factor used to
apply dimensions to the factor X . P
Now the expression for the space-average time-maximum
displacement response of a plate, used in eq'n 2.3 and 2.4,
IV. Coupling parameters
For any given set of 2 subsystems which are subsequently
coupled,the dynamic behaviour of the coupled system is governed
by the coupling conditions.
An assessment of the response distribution in that system, other
than by direct measurement, requires that coupling conditions
be known.
In elastic systems it would be extremely difficult and
experimentally impossible to determine the coupling stiffness,
in the case of an elastic coupling, owing to the interaction
between the constituent coupled mode3.
The method suggested hitherto, described in section 1, suffers
from various drawbacks and need to decouple a given coupled
system to obtain the necessary parameters.
It seems that, as an experimental technique, a more practical
its motion parameters which are open to measurement.
We choose to observe the motion associated with those
bending waves at right angles to the centre line of the
coupling. Bending waves of the 2 coupled modes are joined at
the point of coupling, resulting in superposition of their
motion at that point. Hence the motion at the coupling,
represented by the amplitude and slope of the bending wave,
at that point, varies along the coupling,with the variation
of the waves superimposed on each other.
Exception occurs-, in the particular case, when the spacing
between nodal lines on both sides of the coupling (measured
along the centre line of the coupling), is identical, as
in Pig 23.
This particular case is illustrated in Pig 13b.
Hence slope and amplitude at any point in the coupling are
representative of the coupling motion.
A corrected and somewhat more detailed analysis of the dynamics
of the coupling, derived from experimental data is given in
section 6 III.
Coupling response is measured at a pre-determined set of
points along its centre line. Amplitude X c and slope are
recorded simultaneously at each point.
Records of parameters of the coupling response of the normal
modes that are tested, are subsequently compared against the
recorded parameters of response distribution of the respective
modes.
V. Errors
Several 'watch-dog' measures are taken in this project, to
ensure good control over possible sources of errors.
The validity of eq'n 2.6 and hence 2.7 was subject to an
acceptable agreement between the recorded and theoretically
constructed bending waveforms along the given circle. This
implies that the vibrational mode shape, present in the plate
A a,b c C F f h»l in m,t n M N Q p
Area under bending waveform.
Subscript denoting the separate plates 1 and 2
respectively.
Subscript denoting coupling.
Damping coefficient.
Amplitude of disturbing force.
Circular frequency.
Higher and lower frequencies corresponding to half
power point.
Subscript denoting point of forcing.
Subscript denoting measured and theoretical values.
Subscript denoting resonant.
Mass.
Normalising factor.
Magnification factor.
Radius, or subscript denoting radius of scanning* •
(r,S)Notation of a bending waveform.
Sd Factor of error due to drift.
fr
I:
T
aT
Factor of error due to flanking energy.
Factor of difference between measured and calculated
response ratio.
Factor of error due to poor agreement between bending
waveforms.
Energy stored in a vibrating element.
-
*
i
specimen is similar to the mode shape theoretically
constructed. Then N should remain unchanged for all r, except
near the edges. This implication offers means to detect error
associated with the assessment of N due to distorted mode
shapes.(i.e. such a mode whose nodal pattern differs from the
theoretically constructed pattern). Testing of coupled-modes
to determine the value of N is to be repeated for several
radii. The amount of fluctuations of the values of N thus
obtained is a measure of the distortion of the mode shape.
Note that this method does not provide means for quantitative
evaluation, neither does it indicate which part of the plate is
actually distorted, until bending waveforms are compared.
The procedure serves as a warning scheme.
In section 3 we deal with the problem of all kinds of flanking
energy that may interfere with measurements. The rig is designed
and tested to ensure that energy flows from the vibration
generator into the specimen only. The good isolation of the
structure as a whole depends on the viscoelastic isolating
materials incorporated in the structural components.
The acceleration response of the suspension frame is tested
simultaneously with taking records, and compared against an 2
upper limit of 25 cm/sec . This step is necessary mainly because
the dynamic characteristics of viscoelastic materials may
change with time.
Since the experimental data was recorded during a long period
of time it became necessary to check the repeatability of the
systems behaviour from time to time, for drift in calibration
or in the dynamic response.
The technique adopted here was to periodically re-excite the
system at resonant frequencies which had already been tested,
and compare the modal frecjiency, input receptance and
subsystems' mean receptance at a pre-determined radius, with
it indicates drift in the calibration, which could be checke’d.
In the event that some of the parameters, only, appeared
different then the systems' response has changed.
Ways and means to detect error or failure, related to the
apparatus are discussed in section 3.
Section 2 was summarized into the chart of planning
experimental techniques, Pig 2.
The chart is combined of 3 divisions. The centre part for the
coupled p l a t e s ,sy3ton .n. a part for o ich of tho uncoupled
pi .tes, on both sides.
The flow of the chart follows the sequence of the process to
obtain the parameters, down to the ultimately sought parameters
at the bottom of the chart. The 2 sets of parameters at the
bottom of the chart are those required to accommodate eq'n 1.5
and 1.9, and those required to assess and detect errors.
It is possible to pick a parameter at the final stage, Sfr
say, and follow back (upward) the process by which the
parameter was obtained , thus revealing the parameters which
are an essential part of the process. In the present example
we see that a n expression of X. , X. and f yields X„ .
fr in n ir
One sees straightaway that this parameter can be determined
from the coupled plates system.
The chart facilitates a quick general appreciation of the
effort involved to obtain a given parameter.
Observing the chart it becomes apparent that the techniques
employed to obtain nodal parameters fall into two categories.
While amplitude response distribution X is obtained by testing
the coupled system, determination of modal damping, mass and
stiffness involved testing the subsystems being uncoupled.
As suggested earlier, this is a serious drawback in practical
situations. Hence the main effort in this work is directed to
establish the relationship between the response ratio of the
coupled plates and coupling parameters.
Some of the parameters in the chart are marked with an
asterisk. Those are the parameters obtained directly from
measurement involving no computation.
The aim of such a presentation is to give an overall
appreciation of the amount of experimental data as compared
to the process of analysing systems' dynamics, and the
3. AN APPARATUS FOR STUDYING RESPONSE DISTRIBUTION
IN COUPLED VIBRATING FLAT PLATES.
I. Specifications.
II. E x p e r i m e n t a l rig.
III. Calibration.
IV. Preliminary results
V. Discussion.
The purpose of this section is to describe a research
rig which h.i3 been devised and constructed to provide the
essential tool for the study of energy distribution in
transversly vibrating plates.
The experimental apparatus has been designed to meet the
requirements of the experimental techniques outlined in
the preceding section and presented in the form of a chart
in Fig 2.
The reader will appreciate that the experimental
apparatus introduced in this section is an outcome of the
necessity to compromise between the desirable, more
expensive equipment and a limited financial grant.
Although this gave rise to some time-consuming procedures,
it did not cripple the work as a whole.
The value of the rig for the project is demonstrated by
some typical results, the validity of which is established
by a series of subsidary tests.
Additional laboratory applications and further development
of the rig for specific industrial applications, beyond
the scope of the thesis, are described in section 6 IV.
I. Specification.
The parameters marked with an asterisk in the chart of
F i g 2 can be classified into those measured at a point,
such as frequency and force of excitation, input point
response, and a group of the distributed parameters
comprising coupling and plates response measured over an
area. This classification is evident in the experimental
set up.
I
transducers fitted at a fixed position, whereas the latter
group is obtained from transducers which change their
position, assisted by mechanical means, in a pre-planned
part of the plate system.
F o r the determination of mode shapes and response
distribution the transducer used should b e a non-contacting
one to avoid loading the plate and interfering with the
mode shape by an additional mass. She transducer is made
to move along a circle of constant diameter and pre
determined centre.
The plot of displacement response of the plate vibrating
in a normal mode thus obtained exhibits a representation
of the plate b n d i n g waveform, of the kind shown in Fig 1,
and yields the identification of that mode.
In considering possible structures of a coupling, we
distinguish between three different types, a point coupling
(Fig 2 6 b ) , an elastic distributed coupling (Fig 2 6 a ) , and
a sort of a combination of both, i.e. a series of point
couplings, such as spot welding.
The first 2 cases were tested in the course of the work,
although the elastic one was used in the study of energy
distribution.
The response of an elastic coupling, consisting of the
components of the constituent coupled modes, as described
in F i g 13b is distibuted over the border line between the
two plates and needs to be detected along that line,
referred to as the coupling centre line. As in the case
of measuring plate response, non-contacting transducers are
desirable here for the reasons mentioned. But in order to
describe the dynamic situation at a point of the coupling
in sufficient detail, it i3 necessary to record the slope
and amplitude response. The amplitude can be obtained from
a transr' cer placed at the coupling centre line. In order to
record the slope, the amplitude must be measured at the
points marked in Pig 13b as those related to the measurement
of $ c . This procedure amounts to recording the bending
waveform in the Y-Z plane for amplitude,and in the X-Z
plane to measure the slope.
Since some of the modes displayed amount of instability
in the response, it was necessary to perform simultaneous
measurements of both coupling parameters, to ensure that
they were obtained for the same conditions. This required
a minimum of 3 transducers arranged in the form of an
equilateral triangle.
The procedure of taking records was repeated at each of
15 points, equally spaced along the coupling centre line.
The schematic reconstruction of coupling response shown
in Pig 13b could be derived from such records obtained at
6 points and provided that the constituent coupled modes
were identified.
Any vibtating system is described by its modal densities
and by the modal parameters such as frequency, mass, stiffness
and damping. These depend not only on the material properties
and body geometry but also on subsystem coupling and on
boundary conditions.
In considering coupled rectangular plates there are
basically three possible boundary conditions: clamped,
supported, free, and their 1 2 combinations, which can be
applied to a part or a whole edge.
The provision of a supported edge restraint involves
considerable difficulty in providing sufficient inertia to
keep the edge at rest while introducing no bending moment.
Similarly the provision of a clamped edge restraint is
equally difficult in ensuring zero slope at the edge.
Completely free boundaries also present a difficulty in a
situation where the body must be supported in some way.
Nevertheless, despite the fact that suspension and excitation
at some points of a multi-mode element is bound to interfere
with the shape of the modes due to the manner of suspension,
free boundary condition appears to be the easiest to meet.
In the transverse vibration of plates, points in the
plate undergo small time-dependent displacements in the
direction perpendicular to the plane of the plate. For
any normal mode of vibration, this motion can be described
by a pattern of nodal lines. They are approximately parallel
to the edges in most cases of vibration of rectangular
plates, so that a mode can be identified by the number
of nodal lines m a n d n in the x an d y d i r e c t i o n s respectively.
It would seem that points of nodes in the plate offer
the most suitable dynamic characteristics for suspension
attachment. But as the location of nodes varies with
modes, and sihee f o r practical reasons it is not feasible
to shift the points of suspension attachment according
to the excited mode, this alternative was discarded.
In the case of free boundaries, the corners of a
rectangular plate are of maximum displacement, for all
normal modes.
Yet it was found that the least amount of distortion due
to suspension attachment occurs when the corners are
attached. In order to understand the reason for this to
happen we compare the space-average stiffness of a plate
having 2 adjacent sides freely supported (pinned) and the
2 other sides free, to that of a plate having all sides
freely supported.
The first case is analogous to suspension at the corner of
a free plate and the latter one to suspension elsewhere
away from the edges at an arbitrary mode. Our assumption
that a nodal line is approximated by a pinned boundary
is implied.
It is common knowledge that the space-average stiffness
of the former case ( 2 sides free, 2 pinned) is lower than
the stiffness of the other case. Hence the fixed point
of suspension being attached to the corner of the plate,
accommodates the mode motion in the (comparatively) greater
flexibility of the vicinity of the corner , thus being the
region where mode shape is distorted, as described by
Shapiro (17).
By 'distorted mode' we mean a mode shape, different
from that approximated to by a product of the appropriate
characteristic beam functions.
For a square plate the nodal pattern can be a circle of
a centre matching with the middle of the square, as can be
seen for example in mode 4 / 2 - 2 / 4 in p. 3 7 3 of reference 1 1.
In this case concentric circles are of displacement contours.
Then waveforms of such circles around a circular path, are
represented by plots of straight lines, parallel to the
x axis, bearing n o significance to a particular mode and
consequently yielding no identification.
To prevent the crippling effect of a transducer detecting
a response of the type described, and to facilitate a
concurrent theoretical treatment in terms of normal modes
».¿a-There are several reasons for a plate to display a distorted
mode shape. Distortion of mode shape owing to constructional
design of the rig, such as attachments location and type of
forcing, misalignment, and the like, m a y be of a localized
nature.
It is possible that in this situation, the method designed
to identify normal modes through the bending waveform along
a circle becomes incapacitated as the distortion, however
localized, interferes with part of the circle.
The overall nodal pattern of the mode may still remain
identifiable in terms of m x n nodal lines, which is the case
shown in plate 1 of F ig 24.
The solution appears to be in the technique of mapping
the nodal pattern applying the phenomenon that the phase
angle between the disturbing force and a signal of a
displacement transducer, changes through 180 degrees
(approximately) when the transducer crosses a nodal line (18).
Another reason for distortion, which is inherent in the
specimen and the boundary conditions, can be expressed in
terms of the modal density.
A high modal density as compared to the modal bandwidth
may cause an off-resonant excitation of adjacent modes.
Normally this is likely to result in the motion of one or
more normal modes being superimposed on the mode of interest.
Consequently any point response is the vectorial sum of the
components, at that point, of all the modes being excited.
This is a distributed effect, whose extent depends on the
relative ar.. i i : ~ " t i o n factors and resonant frequencies of
the modes involved.
Naturally, in cases where natural frequencies are so
close together that resonant modes are distorted beyond
recognition these states cannot usefully be treated on the
basis of peak amplitude testing and these have been ignored
both in tests reported here and in subsequent testing to be
reported later.
This is no disadvantage since the purpose is to study power
flow and not the modes of vibrating plate3.
Similarly those resonant conditions having adjacent anti
resonances above the half-power points have been excluded
from consideration, because the peak amplitude plot does not
yield the damping ratio with any accuracy.
Prom this description it is evident that sinusoidal forcing
of the system at constant force amplitude is undertaken.
But in specifying the details of the excitation system it is
necessary to give some consideration to the point at which
the excitation is applied. The ideal point at which to excite
a pa ticular mode is its anti-node*
►
This is, as shown by both Plunkett (15) and Dunn (16), where
the source of excication encounters the least mechanical
impedance.
At any other point the impedance is greater, reaching a maximum
at a node. Exciting the plate at any point other than an anti
node requires higher force input per unit displacement
response since it can give rise to deflection of points
which would otherwise be nodes, to superposition of rigid
body motion on the mode of vibration, to local distortion
in the vicinity of the force input point or to highly distorted
modes due to off-resonant excitation of adjacent modes,
(see p. 3 7 9 of ref.13).
All these effects are easily detectable. Readings of
force level and displacement response can be corrected in
respect of the first two effects but where the latter occurs
the only course of action is to alter the position of
application o f the source, which is a laborious procedure
involving precautions to avoid misalignment.
In a rectangular plate which is freely suspended, all
points along the edges have the maximum displacement for
that beam fuontion for all modes. Hence if the disturbing
force is located close to a corner of the plate, the lowest
mode in which it can be located in a node is that having a
bending wavelength of four times the distance from the
forcing point to the edge.
So, if the location of the force is close enough to the edge
the frequency at which this bending wavelength could be
established will be so hi ,h as to be beyond the range of
interest in the investigation.
For the determination of the mode shape the transducer
used should b e a non-contacting one to avoid leading the
plate and interfering with the mode shape.
II. Experimental rig.
The rig consists of a steel base frame isolated from the
floor by anti-vibrat ; mountings. The base carries a vertical
steel frame • supporting -the specimen , an aluminium plate
1/8" thick a n d about 3'x 5' in size, cut partially to form
a system of two rectangular plates coupled together by an
integral bridge. Fig 3a shows a general view of the rig
and Fig 3b the specimen. It is suspended from steel wires
in tension within the frame, being connected at each
corner of the plates by means of flexible rubber mountings
shown in Fig 4d. This approximates, as closely as it is
possible to do so, the condition of free boundaries.
of energy to the specimen through a flanking path is to be
avoided. Each plate element faces a scanning unit mounted
on the base frame and insulated from it t© anti-vibration
mount s .
The scanning unit, shown in Pig 4a, comprises an arm
carrying the transducer which may be rotated in a plane
parallel to the plate, and mounted on a shaft. The shaft is
made in two parts joined by a soft rubber coupling and
mounted in a pair of air bearings. Both units are driven by
a common electric motor. The selection of air bearings is
dictated by the need to avoid noise generation in, and
transmission through the bearings, and to insulate the part
of the shaft carrying the transducer from the part driven
by the motor.
Coupling response is measured by the set of 3 proximity
transducers mounted as shown in P i g 4c, facing the coupled
plate system its centre line against the coupling centre
line. (The centre line of the unit is marked C.L. above
the top transducer).
This unit is fitted to slide up and down on a steel stem in
a plane parallel to the plane of the plate. A spring loaded
catch, built in the transducer holder unit, locates the unit,
in each of the 15 pre-determined points of measurement.
So that a repeatability of those positions is ensured.
The stem is bolted to a steel base plate which rests on
a soft rubber pad on the floor, thus satisfatory insulation
from floor vibration is achieved.
The insulation using a soft rubber mounting constitutes
a danger of permitting the transducers mounted on the stem
to float relative to the plate surface. In preliminary tests
Vibration Generator
r Jpöwer 7 TÄut omatic j ! Amplifier\ ! Level Regulatorf
...___ “I“...T ...
I I Force !_p: Transducer
Charge Amplifier]
Plate-specimen
! r
i ! •;
Probe 3| ¡Probe 2 1 ; *, *
Pot.
ÏPfôximïtÿ] [Meter
■ H l
-Hl
I!!, Probe 1
Hpot:_.
i'i Tfröxlmxty]]Meter_
"[flIgh"*Pasi”2n3T H i g h Pass 2nd
Order Passive! Order Passive
iFilter Filter
. i ... T55 kHz Notch
Passive Filter!
±
--- --- X....T
| BandpassTunable Filter!
"[Leaking
Full Wave j IFull Wave
Active Active
Rectifier| [Rectifier
[50 kHz Notch
Ipassive Filter!
[Bandpass
Tunable Filterj
Plotter !
"[Leaking
j l n t e r g r a t o r ]
YP
js ïn ë ~ S w ë ip
7
‘l Oscillator_
-»[Frequency ' I Counter :
T d. c^_ SÜ.pgïyT
t DÖübï5-Beam"T _^-j Oscilloscope]
1
VoltmeterElectronicI Electronic ¿Voltmeter !
— requency' I to d.c. ___ ¿Converter
heavy workshop equipment were the only factors of significant
effect on results. «Vith soft rubber pad insulation this
problem was solved and repeatability of records of coupling
response confirmed if the transducers were floating, it
was in a negligible amount only.
A separate stand supports the electromagnetic vibration
generator in a seismic manner with respect to the direction
of forcing. The generator is bolted to the plate through a
piezo-electric force transducer. The physical connection is
made while the arm is scanning care being taken to ensure
that the displacement transducer indicates no change of
mean position while the connection is being made. It is
thereby ensured that no constraint is applied to the plate.
The instrumentation system employed is shown schematically
in Pig 5. A sweep sine oscillator drives the vibration '
generator through a power amplifier and automatic level
regulator. The regulator is fed with a signal from the
piezoelectric force transducer to maintain constant input
force level. The response of the plate, the input point
response, and the coupling response are detected by capacitive
proximity transducers with variable air gap. The vibration
modulates a 50 kHz carrier. The signal contains mains
hum and d.c. drift caused by the bodily swing of the plate.
A set of high pass, notch, and tunable filters discriminates
the signal which is then rectified and smoothed by a
leaking integrator and fed to an x-y plotter to give a
plot of vibration amplitude against transducer scan.
The waveform in the plate is thereby described in a rectified
form as can be seen in P i g 11.
If an average of that waveform is needed a time domain
The f-*tox se^ attenuates both the 50 kHz carrier of the
r-oximity meter and mains hum by 52 db. This is 25 db more
t han the signal attenuation at the lower mode frequencies
of interest and j7db more than the attenuation of higher
m ode frequencies.
To plot the bending waveform the horizontal sweep of
the plotter is driven from a d.c. supply through a poten
tiometer fitted to the shaft of the scanning rig (Pig 4b),
thereby yielding a plot with abscissa proportional to angle
of rotation of transducer scan.
This whole system of scanning rig and instrumentation,
is duplicated as shown in Pig's 3 and 5 so that simultaneous
records of the waveforms on both plate elements can be
made.
To record peak-amplitude plots such as Pig 12, the x
axi s of the plotter is driven from the oscillator through
a frequency-to-d.c. voltage converter. The horizontal sweep
is then proportional to frequency of excitation .on a
linear scale.
Response and force signals are measured by digital
voltmeters and displayed simultaneously on an oscilloscope
in order to have a continous display of the level of signal
distortion. The oscilloscope can also be used to record
vibration decay rates.
Mapping the nodal pattern of the vibrational mode, using
acoustical technique is shown in Pig 6. A condenser
microphone is held facing the plate at a distance of about
1cm from the surface. The signal is fed into the sound
level meter, and then compared against a signal from the
force transducer both on a phase meter and an oscilloscope.
A change through 180 degrees in phase difference between
the signals indicates that the microphone has crossed a
nodal line.
Apart from this manual technique being laborious, a
drawback is inherent in the method, in that when a node
or another point of low displacement response is detected,
the signal generated is neither enough to drive the phase
meter, nor to display the situation clearly on the
oscilloscope. Hence it was necessary to increase and
decrease the gain alternately. It could engage up to a day's
work to map a mode.
The strategic component to check flanking energy is the
frame of suspension of the specimen . Vibrational energy
being detected in the frame indicates that either part of
the energy flows from the generator through the primary
plate and the frame to the driven plate, avoiding the coupling
or that the specimen is excited by extraneous source such
as the motor, or the building, through the frame. This is
monitored by an accelerometer fitted to the frame at the
point of attachment of a suspension chord. A signal
proportional to acceleration drives a voltmeter, which
can be observed above the specimen in Pig 6.
The problem of setting an acceptable upper bond of
frame response needs further clarification.
It is a cumbersome process to establish theoretically the
relation between frame point acceleration and the direction
and magnitude of the flow of vibrational energy through the
frame for every normal mode of interest.
A series of simple tests was undertaken, to determine an
upper limit of a 'strategic' point acceleration ensuring that
the amount of response of the coupled-driven or uncoupled
Voltmeter
Vib r a t or C a l ibrat ing ma ss
Displacement Force
Slop« 40 pCfe/kff
205 25Ó ’ IO"3 U t
♦
245*10"6 ««/■»
less than 5%.
The experimental set up and procedure are similar to those
adopted for measurement of coupled plates response, except
that the specimen in this test consists of separate plates
of the same dimensions as the coupled plates. Response of
both plates was detected simultaneously as plate 'a' was
excited sinusoidally, sweeping through the frequency band
of interest. Each of the 30 normal modes of each plate,
elected to serve as models, was examined. Then response ratio
was compared against acceleration levels of the point
described earlier. The kind of response level of the uncoupled
plates to excitation of plate 'a' can be observed in Pig 27b/1.
It was established that an upper bcifad of that point
2
acceleration of 25 cm/sec , keeps flanking energy well below
the required level at all frequencies.
III. Calibration.
Static calibration of the force transducer can be performed
by loading the transducer with known masses and measuring the
d.c. voltage output. For dynamic calibration known masses
including the mass of an accelerometer can be fixed in front
of the force transducer, the whole being mounted on a
vibration generator, as shown in Pig 7.
A calibration curve obtained by this method is offered
in Pig 8a from which it is evident that a unique character
istic exists for both static and dynamic operation (at least
within the frequency range 300-1200 Hz). The same is true
of the capacitive proximity meter system, static calibration
of which, against some high-accuracy linear measurement
devices presents no problem. Dynamically, it is not possible