ORIGINAL RESEARCH
ADULT BRAIN
Improved Automatic Detection of New T2 Lesions in Multiple
Sclerosis Using Deformation Fields
XM. Cabezas, J.F. Corral,XA. Oliver,XY. Díez,XM. Tintore´,X C. Auger,X X. Montalban,XX. Llado´,XD. Pareto, andXA`. Rovira
ABSTRACT
BACKGROUND AND PURPOSE:Detection of disease activity, defined as new/enlarging T2 lesions on brain MR imaging, has been proposed as a biomarker in MS. However, detection of new/enlarging T2 lesions can be hindered by several factors that can be overcome with image subtraction. The purpose of this study was to improve automated detection of new T2 lesions and reduce user interaction to eliminate inter- and intraobserver variability.
MATERIALS AND METHODS:Multiparametric brain MR imaging was performed at 2 time points in 36 patients with new T2 lesions. Images were registered by using an affine transformation and the Demons algorithm to obtain a deformation field. After affine registration, images were subtracted and a threshold was applied to obtain a lesion mask, which was then refined by using the deformation field, intensity, and local information. This pipeline was compared with only applying a threshold, and with a state-of-the-art approach relying only on image intensities. To assess improvements, we compared the results of the different pipelines with the expert visual detection.
RESULTS:The multichannel pipeline based on the deformation field obtained a detection Dice similarity coefficient close to 0.70, with a false-positive detection of 17.8% and a true-positive detection of 70.9%. A statistically significant correlation (r ⫽0.81,P value⫽ 2.2688e-09) was found between visual detection and automated detection by using our approach.
CONCLUSIONS: The deformation field– based approach proposed in this study for detecting new/enlarging T2 lesions resulted in significantly fewer false-positives while maintaining most true-positives and showed a good correlation with visual detection annotations. This approach could reduce user interaction and inter- and intraobserver variability.
ABBREVIATIONS:BL⫽baseline; CIS⫽clinically isolated syndrome; DSC⫽Dice similarity coefficient; DF⫽deformation fields; FP⫽false-positive; FPf⫽ false-positive fraction; FU⫽follow-up; PD⫽proton density; TP⫽true-positive; TPf⫽true-positive fraction
M
R imaging has become a core paraclinical tool for diag-nosing and predicting long-term disability and treat-ment response in patients with multiple sclerosis. Of particular note, several criteria and strategies have been proposed forprompt identification of suboptimal response in individual pa-tients based on a combination of clinical and MR imaging measures assessed during the first 6 –12 months after treatment initiation.1-6These criteria are related to detection of disease
activity on follow-up brain MR imaging studies compared with baseline scans, defined as either gadolinium-enhancing lesions or new/enlarging T2 lesions. However, detection of active T2 lesions in patients with MS can be hindered by several factors, such as a high burden of inactive T2 lesions, the presence of small and confluent lesions, inadequate repositioning, and high interobserver variability.7Image subtraction after image
registration can overcome these issues by visually cancelling stable disease (lesions that stay the same over time) and pro-viding good visualization and quantification of active T2 le-sions (either positively or negatively).8,9
Techniques for automatic detection of active T2 lesions can be classified into 2 categories: intensity-based and deformation-based approaches.10In the former, successive scans are analyzed
by point-to-point (voxel-to-voxel) comparison, whereas in the
Received October 13, 2015; accepted after revision March 21, 2016.
From the Section of Neuroradiology, Department of Radiology (M.C., J.F.C., C.A., D.P., A`.R.), and Centre d’Esclerosi Mu´ltiple de Catalunya, Department of Neurology/Neuroimmunology (M.T., X.M.), Vall d’Hebron University Hospital, Vall d’Hebron Research Institute, Autonomous University of Barcelona, Barce-lona, Spain; and Visio´ per Computador i Robòtica group (M.C., A.O., Y.D., X.L.), University of Girona, Girona, Spain.
Mariano Cabezas held a European Research Committee for Treatment and Re-search in Multiple Sclerosis/Magnetic Resonance Imaging in MS 2014 fellowship grant. This work has been partially supported by “La Fundacio´ la Marato´ de TV3”, Retos de Investigacio´n grant TIN2014 –55710-R, and an MPC UdG 2016/022 grant.
Paper previously presented in part at: Annual Meeting of the American Society of Neuroradiology and Foundation of the ASNR Symposium, April 25–30, 2015; Chi-cago, Illinois.
Please address correspondence to Mariano Cabezas, PhD, Computer Vision and Robotics Group, Department of Computer Architecture and Technology, Poly-technic School - P-IV Building, University of Girona, 17071 Girona, Spain; e-mail: [email protected], [email protected]
latter, deformation fields obtained by nonrigid registration of the 2 scans are analyzed.
Most of the proposed techniques to detect changes on fol-low-up images use an image-subtraction process that identifies new T2 lesions11-13and include statistical models of intensity
changes between scans or other, more complex, supervised strat-egies. Although segmentation of subtraction images enables quantification of new, enlarging, and resolving MS lesions, auto-mated image analysis that differentiates a true lesion change and noise or artifacts would save considerable time and effort.
Nonrigid registration techniques usually provide a discrete vector field that defines deformations occurring between 2 dif-ferent images. This vector field can be used to detect evolving processes, including new T2 lesions. Several approaches that use deformation fields (DF) to detect positive changes occur-ring in longitudinal MR studies have been reported.14,15These
approaches focus on detecting and explaining processes un-dergoing change (ie, lesions shrinking or growing), but not on detecting new lesions, a measure that is now under consider-ation as a biomarker for monitoring and predicting treatment response.16
The purpose of this study was to improve automated detection of new T2 lesions on successive brain MR images, by using a novel approach that combines subtraction and DF analysis. This new pipeline will be compared with other approaches, in which a threshold is applied or a postprocessing step is incorporated on the basis of intensity rules.
MATERIALS AND METHODS
PatientsWe prospectively analyzed previously acquired data from a cohort of 36 patients with clinically isolated syndrome (CIS) or early relapsing MS (13 women and 23 men; 35.4⫾7.1 years of age) who underwent brain MR imaging in our center for diagnosis or for monitoring disease evolution or treatment response. All patients with CIS and early relapsing MS demonstrated new T2 lesions on the follow-up scans and were diagnosed according to recent def-initions and criteria.17,18 Two brain MR imaging acquisitions
were obtained in each patient, the first within the first 3 months after the onset of symptoms (baseline [BL]) and the second at 12 months’ follow-up after onset (FU). The Vall d’Hebron hospital’s ethics committee approved the study, and written informed con-sent was signed by the participating patients.
MR Image Acquisition
All patients underwent brain MR imaging at BL and FU on the same 3T magnet (Tim Trio; Siemens, Erlangen, Germany) with a 12-channel phased array head coil. The MR imaging protocol included the following sequences: 1) transverse proton density (PD)- and T2-weighted fast spin-echo (TR⫽ 3080 ms/TE ⫽ 21–91 ms, voxel size⫽0.78⫻0.78⫻3.0 mm3), 2) transverse fast T2-FLAIR (TR⫽9000 ms, TE⫽87 ms, TI⫽2500 ms, flip angle⫽ 120°, voxel size⫽0.49⫻0.49⫻3.0 mm3), and 3) sagittal T1-weighted 3D magnetization-prepared rapid acquisition of gradi-ent echo (TR⫽2300 ms, TE⫽2.98 ms, TI⫽900 ms, voxel size⫽ 1.0⫻1.0⫻1.2 mm3).
Expert Analysis
All new and enlarging T2 lesions visually detected on the FU scan were annotated on T2-FLAIR images by using the semiautomated tool included in Jim 5.0 (http://www.xinapse.com/home.php). This task was performed by a trained technician who first detected changes visually by using the BL and FU scan and then delineated them semiautomatically by using a subtraction image and both scans. This task was later confirmed by an expert neuroradiolo-gist. The results of this analysis served as the reference standard for comparisons in the study.
Preprocessing
On both BL and FU PD-weighted images, a brain mask was identi-fied and delineated by using the FSL Brain Extraction Tool (bet2 command) (http://fsl.fmrib.ox.ac.uk/fsl/fslwiki/BET) with the ro-bust center estimation, neck clean-up, and default threshold param-eters. The mask was then applied to the other coregistered images (T2-, T2-FLAIR-, and T1-weighted), and the N4 algorithm from the ITK library (http://www.itk.org/)19was used to correct for bias with
the standard parameters for a maximum of 400 iterations. The last preprocessing step was to normalize BL and FU intensity values by using a histogram-matching approach.
Registration and Subtraction
In each patient, T1- and T2-FLAIR-weighted images from the same study were coregistered to the PD-weighted image by using a 3D affine transformation similar to that in previous works.20
The Mattes Mutual Information cost function was minimized by Regular Step Gradient Descent Optimization (https://itk.org/ Doxygen320/html/classitk_1_1RegularStepGradientDescent Optimizer.html), and B-spline interpolation was applied. This framework was implemented by using ITK.
The same 3D affine-registration framework was also used be-fore subtraction to warp the BL images to the FU space because patients with CIS and early relapsing MS present with small (or no) overall anatomic changes.21The registration was conducted
between both PD-weighted images. After the transformation had been obtained, we applied it to the other images by using B-spline interpolation to subtract the BL PD-, T2-, and T2-FLAIR-weighted images from their corresponding FU images. In the case of BL T2-FLAIR-weighted images, the 2 affine transformations were combined to avoid interpolating more than once.
Affine registration methods are robust to the presence of lesions, and when new lesions appear, deformable models usually show dis-tortions to compensate for the anomalous regions. On the basis of the characteristics of these approaches, we were able to analyze the DF obtained after applying these nonrigid techniques to the registered images. In this study, we applied the multiresolution Demons regis-tration approach22 from ITK initialized with the previous affine
Threshold
New and enlarging T2 lesions appear hyperintense in the subtrac-tion image. However, certain regions outside the white matter may also appear hyperintense due to artifacts, noise, inhomoge-neity, registration errors, or small anatomic differences. Because our goal was to detect new and enlarging T2 WM lesions, we restricted our search to areas within the WM. To define this re-gion, we applied an automated tissue-segmentation algorithm23
to the BL and FU scans. This nonparametric algorithm uses an atlas registered to the T1-weighted image in conjunction with the T1-, T2-, and PD-weighted images. This segmentation was ap-plied before the registration step between the 2 image sets. After reg-istration, a final WM mask was obtained as the union of the 2 WM segmentations in the FU space. After defining WM, we smoothed the subtracted images by using the ITK 3D Gaussian filter (Discrete-GaussianImageFilter; http://www.itk.org/Doxygen/html/classitk_ 1_1DiscreteGaussianImageFilter.html) with a 0.5 SD to reduce the impact of spurious hyperintense regions.20An automated threshold
was then computed for each subtraction image (PD, T2, and T2-FLAIR) and applied separately to obtain 3 initial lesion masks. The thresholds were computed as the mean of the subtraction image within the WM plus 5 SDs to guarantee that only hyperintense re-gions were detected and to maintain a large number of true-positives (TPs), as proposed previously.20Lesions of⬍3 voxels were excluded
to reduce the effects of noise.
Lesion Mask Combination
To differentiate between errors and true lesions in each mask, we used the intersection of the 3 masks (PD, T2, and T2-FLAIR). Because differences in the initial masks might still result in false-positive (FP) detections of 1 or 2 voxels, we also applied the lesion size restriction to the combined mask to reduce this effect.
Afterward, the 2 different postprocessing approaches were used independently in order to compare them.
Postprocessing Based on Intensity
While the aforementioned restrictions usually exclude a large num-ber of FPs, they do not completely eliminate this problem. As has been reported,20some FPs can arise from low intensities in the BL
images, caused, for example, by skull-stripping errors. To reduce the effect of these factors and to include local information, we applied a set of suggested intensity-based rules to the BL and FU images20:
● Global rule: To avoid regions with a low intensity, candidate lesions with a mean value underbasal⫺2basalare discarded, wherebasalandbasalare the mean and SD of the basal inten-sities inside the WM ROI.
● Basal neighborhood ratio: New lesions should appear as WM in the basal image. To ensure that, we compute a ratio between the neighboring pixels of the candidate lesions (lesion/neighbors). If this ratio is⬍0.9, we discard the candidate lesion. That usu-ally means that there is a dark spot that might appear as a hy-perintensity in the subtraction image.
● Follow-up neighborhood ratio: Similarly, new lesions should ac-tually be lesions in the follow-up image. To ensure that, we com-pute the same ratio. If this ratio is⬍1, the candidate lesion has a lower intensity profile than its neighboring area, so we discard it.
Postprocessing Based on Deformation Fields
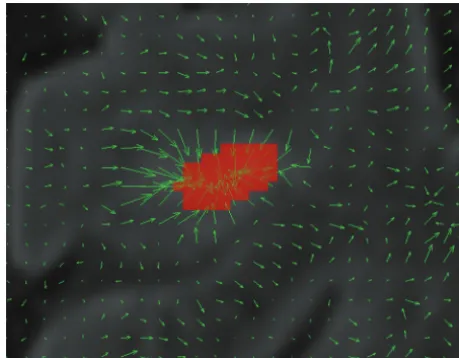
The Demons algorithm provides DF representing a transfor-mation from the target image (FU scan) to the source image (BL scan). To compensate for hyperintense lesions, the DF go from outside the lesion to its center (shrinking it), as is illus-trated inFigs 1and2. Vectors within and in the vicinity of the lesion have a higher modulus than those in other regions of the image. Moreover, no sinking patterns with independent be-havior between neighboring vectors are observed far from lesions.
To be able to model and automatically detect this behavior, we defined 3 regional metrics computed from the DF inside each candidate lesion:
● Divergence15: This vector operator is defined as the volume
density of the outward flux of a vector field from an infinitesi-mal volume around a given point. Given a continuously differ-entiable vector fieldFជ, the divergence at a given point is equal to the scalar-valued function:
divFជ⫽⭸Fx ⭸x ⫹
⭸Fy ⭸y ⫹
⭸Fz ⭸z.
In our case,
divDF⫽G共x兲x⫹G共y兲y⫹G共z兲z,
whereG(i)jis thejcomponent of the gradient in thei compo-nent of the vector field volume.
For new T2 lesions, deformations have an inward flux that is represented by a negative value (div DFof⬍0). Therefore, we excluded lesions that had a positive mean value.
● Jacobian14: We used the Jacobian operator to analyze the DF at
each candidate lesion. Values of⬍1 represent a shrinking pro-cess. Regions with a higher value were excluded.
[image:3.594.302.532.47.226.2]puted the scalar product between the DF vector and this concentric vector. Concentric vector fields should have an absolute mean value close to 1; therefore, we excluded all
candidate lesions with an absolute value lower than 0.75. This value indicates that the deformation vector and the concentric vector have a maximum angle of 15°.
Evaluation and Statistical Analysis
To validate use of the DF and the benefits they provide when automatically detect-ing new T2 lesions, we compared the pro-posed pipeline to a state-of-the-art ap-proach20with detection-based measures.
In this approach, a lesion is considered TP if it overlaps a ground truth lesion, FP is a detected lesion with no overlap, and FN is a lesion that has not been detected.
The TP fraction (TPf) and FP fraction (FPf) are the ratio measures of TP versus ground truth lesions and FP versus all le-sions found, respectively. Therefore, per-fect detection would be 100% TPf and 0% FPf. To complement and summarize these measures, we also computed the Dice sim-ilarity coefficient (DSC):
FIG 2. Example of the deformation field for 2 sections. The first image does not contain lesions and presents large deformations with no clear sinking patterns, while in the second image with a lesion, all thearrowsinside the lesion point to the center.
[image:4.594.54.376.94.279.2] [image:4.594.52.532.327.696.2]DSC⫽ 2⫻TP 2⫻TP⫹FP⫹FN.
Furthermore, we also performed an evaluation of the actual overlap between lesions by using the volumetric DSC.
Finally, we also included the average surface distance measure from the MICCAI MS Lesion Segmentation Challenge 2008 (http://www.ia.unc.edu/MSseg/).24The border voxels of
segmen-tation and reference are determined. For each voxel along one border, the closest voxel along the other border is determined (by using unsigned Euclidean distance in real-world distances). All these distances are stored, and their average is computed. This value is zero for a perfect segmentation.
A statistical analysis was performed to evaluate the significance of the results obtained. To determine the performance of each key step in our pipeline, we conducted 3 sets of experiments, each focusing on a different aspect. The naïve approach consisted of applying the threshold defined in the “Materials and Methods” section to each subtraction image. We also applied different post-processing approaches to the initial masks separately, and finally, we compared the results of the threshold mask combination to our proposal and a state-of-the-art approach.
First, we performed a Lilliefors test on the measures evaluated and their differences. Due to the number of pipelines evaluated and the statistically proved non-normal distribution of the mea-sures, pair-wisettests were inappropriate. Hence, permutation tests20,25were used to determine significant differences among
applying a threshold, using intensity and neighborhood rules, and using DF. Permutation tests yield the mean () and SD () of the fraction of times that the difference in a given measure for a given method is smaller than the remaining methods, with aPvalueⱕ
.05. The methods were then ranked by the mean and SD of the method with the highest measured value. Methods in the same rank had similar results, whereas methods in different ranks showed sig-nificant differences.
We also performed a Wilcoxon rank sum test among the DSC, TPf, and FPf results for each independent image after the threshold was applied. Finally, the Pearson correlation was used to analyze the manual annotations and the auto-matic detections obtained with our approach.
RESULTS
The mean results for new T2 lesion detection and segmentation by using each of the approaches are summarized inTable 1. The DSC results with our approach were 0.68 in terms of detection (re-gions) and 0.52 in terms of segmentation (volume). Moreover, we obtained the lowest average surface difference (7.89 mm) in con-trast to the joint threshold (13.07 mm) and with intensity rules (30.80 mm). While the volumetric agreement was lower, it was high enough to validate our detection definition of 1 voxel overlap.
Impact of Postprocessing per Image
Our first set of experiments consisted of applying a threshold to PD-weighted, T2-weighted, and T2-FLAIR-weighted images sep-arately. We compared this naïve approach with a state-of-the-art approach26based on intensity and spatial rules and the DF rules
presented here on each image.
According toTable 1, application of a threshold alone missed some ground truth lesions and resulted in a large number of FPs. Lowering the threshold to include all ground truth detections would be counterproductive because of the number of FPs. In terms of sensitivity alone, both PD-weighted and FLAIR subtrac-tions yielded similar results.
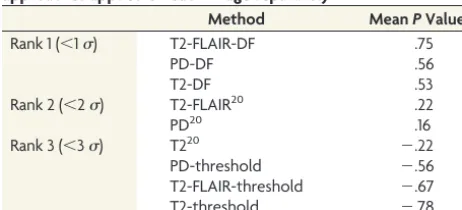
Rankings obtained by statistical permutation testing for the DSC are summarized inTable 2. Negative values indicate lower performance than the method with the highest DSC value. Rank 1 only included approaches that relied on the DF after applying a threshold, whereas rank 2 included approaches that used intensity and neighborhood rules for the PD and T2-FLAIR subtractions. Rank 3 included all methods based on thresholds with a negativePvalue. Because ranking between the approaches differed, we can conclude that there was a sig-nificant difference between using DF and intensity/neighbor-ing rules.
[image:5.594.53.378.56.192.2]Paired rank sum testing between strategies revealed no signif-icant difference in DSC or TPf among the 3 image subtractions, thus indicating that all 3 images provided similar sensitivity for lesion detection. However, we obtained significant differences for FPf, suggesting that FP detection differed among the images. This difference supports our idea of combining the masks obtained for each subtraction.
Table 1: Lesion detections obtained for our data base using various approaches
Image Method ASD TPf FPf DSC (Lesions) DSC (Volume)
PD Threshold 25.80 92.28 93.18 0.11 0.31
Intensity rules20 21.90 80.61 83.01 0.24 0.35
DF 19.91 73.18 77.02 0.30 0.37
T2 Threshold 25.22 93.89 95.88 0.07 0.25
Intensity rules20 22.22 64.09 86.35 0.17 0.25
DF 17.76 81.79 80.84 0.26 0.34
T2-FLAIR Threshold 27.22 90.24 92.79 0.10 0.26
Intensity rules20 21.17 78.34 80.77 0.25 0.31
DF 21.14 81.22 77.11 0.30 0.33
Combination Threshold 13.07 91.05 85.61 0.22 0.45
Intensity rules20 30.80 51.62 35.87 0.46 0.37
Proposal 7.89 70.93 17.80 0.68 0.52
Note:—ASD indicates average surface distance.
Table 2: Permutation test ranking of DSC values for the approaches applied on each image separatelya
Method MeanPValue
Rank 1 (⬍1) T2-FLAIR-DF .75
PD-DF .56
T2-DF .53
Rank 2 (⬍2) T2-FLAIR20 .22
PD20 .16
Rank 3 (⬍3) T220 ⫺.22
PD-threshold ⫺.56
T2-FLAIR-threshold ⫺.67
T2-threshold ⫺.78
a
[image:5.594.53.284.229.334.2]Impact of the Lesion Mask Combination
When the initial masks for each image were analyzed indepen-dently, almost all new T2-WM lesions were detected. However, FP detections were visually different among the images in most cases and, therefore, highly related to the image being visualized.
To validate the assumption that combining the masks signifi-cantly improves the results, we performed a second set of experi-ments and comparisons by using rank sum testing between the lesion mask after applying a threshold to each image indepen-dently and the intersection of all 3 masks. Significant differences were found for FPf and DSC (P⬍.05) but not for TPf. Again, this finding suggests that combining all masks reduces the number of FPs without significantly affecting TP detections.
Pipeline Comparison
We also performed an analysis of the last group inTable 1(mask combination in the 3 different strategies). In this case, we ob-tained significant differences (P⬍.05) for all 3 measures (DSC, TPf, and FPf) between the intersection mask and the 2 approaches based on postprocessing. This result indicates that the DSC im-provement was due to the considerable decrease in FPs detrimen-tal to the number of TPs. This is the usual trade-off encountered when dealing with postprocessing techniques, in which some TPs are excluded (eg, due to image artifacts) to reduce the number of FPs. We also found significant differences (P⬍.05) in all 3 mea-sures between the 2 automatic approaches (our proposal and that of Ganiler et al20), reinforcing the notion that our DF strategy
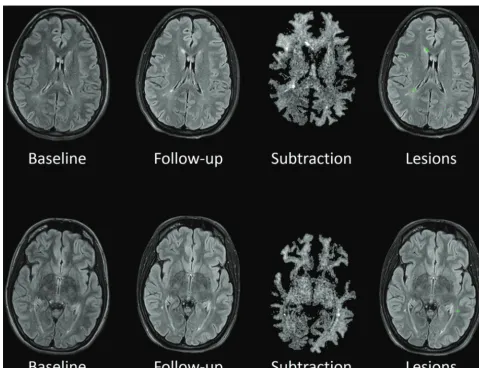
yields better performance. Qualitative examples of the results ob-tained with our proposal are shown inFig 3.
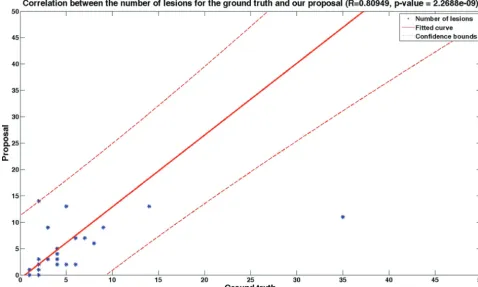
A significant correlation (r⫽0.81,P⫽2.2688e-09) was found between annotations based on visual detection and our auto-mated approach for detecting new T2 lesions (Fig 4). We then analyzed the effect of the 3 DF-based measures and found that they all had a similar impact in most cases; however, some FPs were only detected by one of them, with no apparent pattern.
Lesion Analysis per Volume
[image:6.594.53.532.49.336.2]Finally, we analyzed lesion detection by groups of similar size. Table 3summarizes the results before and after postprocessing by using the deformation field obtained. As expected, lesions with a small size (between 3 and 10 voxels) have a low detection rate (42.86%). Due to their small size, the deformation field cannot fully capture them and they are discarded during the postprocess-ing step. As the volume increases, the deformation field presents a clearer pattern that we can detect with the rules presented in this article. Even though for lesions of a medium size (between 11 and 50 voxels) the TPf is still lower than 50% (48.57%), this value increases for large lesions of⬎50 voxels (77.42%). Moreover, the TPf decreases from 69.23% before postprocessing to 23.08% with lesions of⬍7 voxels.
[image:6.594.300.532.391.437.2]FIG 4. Correlation between the number of ground truth lesions and the number of automatically detected ones (Pearson coefficient⫽0.81,P⫽ 2.2688e-09).
Table 3: Analysis of the TPf before and after postprocessing with deformation fields for different sizesa
Image Method 3–10 11–50 50+
Combination Combination (threshold)
71.43 72.38 95.16
Proposal 42.86 48.57 77.42
a
DISCUSSION
New/enlarging T2 lesion count is a common measure used to monitor and predict treatment response in patients with MS.1-6
Trained radiologists perform this task by visual analysis of 2 suc-cessive MR images, a time-consuming task associated with high interobserver variability.7 The pipeline proposed in this study
may be of value for assisting or even replacing visual analysis for detecting active MS lesions on T2-weighted images.
The method is completely autonomous and automated and does not require user input or a training set. Furthermore, the process is computationally fast because it mainly relies on sub-traction and registration. With an optimized Demons algorithm, it takes only minutes to segment all new T2 lesions in a single patient, with a low number of FP detections.
We obtained significant results with a data base of 36 patients, and we also tested our algorithm without any modification with a small clinical trial dataset. This dataset had a reduced number of images (n⫽10) that were provided by 3 different centers. Even though promising results were obtained with this initial test (DSC for lesions⫽0.79, DSC for volume⫽0.60, TPf⫽74.15, FPf⫽ 9.61), an exhaustive analysis with a larger number of patients should be performed to prove that the method performs similarly with different acquisition setups.
However, currently, it is not possible to detect new black holes (even though a postprocessing step could be included to differen-tiate between new lesions and new black holes by using the T1-weighted images).
Current studies are working on the definition and implemen-tation of a new “no evidence of disease activity” treatment.6,27
This decision model relies on, among others, the detection of new/enlarging T2 lesions as a biomarker and requires a high spec-ificity and sensitivity because the number of FPs could suggest an undesirable change in treatment. Therefore, reducing the number of FPs when using automatic tools is a key factor. However, cur-rent subtraction techniques usually rely on intensity information, which can misguide detection due to local inhomogeneities or small changes. While these FPs can be reduced by using spatial information, a registration technique that overfits a free-form de-formation incorporates this local inde-formation and provides better insight into changes occurring due to development of a new lesion or one that changes in size.
Automated algorithms usually obtain better scores when le-sion count or lele-sion volume is high, but they often have shortcomings when the lesion volume or volume change is small.11-13,20We also compared ours to a current state-of-the-art
technique that has been validated with 1.5T imaging. 3T imaging provides better resolution and a higher signal-to-noise ratio, from which registration techniques can benefit. Therefore, to demon-strate that DF provide a better means to differentiate subtraction artifacts and true disease activity (in terms of lesions), we used 3T imaging, in which DF provide a better understanding of evolving processes.
CONCLUSIONS
We have presented a new automated pipeline to detect new brain T2 lesions and positive changes in disease activity in patients with clinically isolated syndrome or early relapsing multiple sclerosis.
This technique relies on DF information and provides more reli-able measurement of changes occurring between 2 successive MR images than other currently available approaches. Significant dif-ferences in accurate lesion detection were found between this technique and other current approaches, and a strong correlation and higher overlap were seen between our approach and visual lesion detection. These findings indicate that the proposed technique may be of value for application in clinical studies inves-tigating disease activity, monitoring, and treatment effects, pro-viding a decrease in user interaction and likely a reduction in inter- and intraobserver variability.
Disclosures: Mariano Cabezas—RELATED:Grant: Magnetic Resonance Imaging in MS (MAGNIMS),Comments: MAGNIMS/European Research Committee for Treatment and Research in Multiple Sclerosis (ECTRIMS) Fellowship 2014. Further information can be found at http://www.ectrims.eu/wp-content/uploads/2013/04/ECTRIMS-MAGNIMS-MRI-fellowship-awardees_for-website_2015.pdf. Mar Tintore´— UNRE-LATED:Board Membership: Genzyme, Roche, Biogen, Novartis, Teva, Merck, Sanofi, Almirall, Bayer;Consultancy:Biogen;Grants/Grants Pending: Genzyme,* Roche,* Biogen,* Novartis,* Teva,* Merck,* Sanofi,* Almirall,* Bayer*;Payment for Lectures (including service on Speakers Bureaus): Genzyme, Roche, Biogen, Novartis, Teva, Merck, Sanofi, Almirall, Bayer;Payment for Manuscript Preparation: Biogen; Pay-ment for DevelopPay-ment of Educational Presentations: Biogen. Cristina Auger— UN-RELATED:Payment for Lectures (including service on Speakers Bureaus): Novartis, Stendhal America, Biogen. Xavier Montalban—UNRELATED:Consultancy: Actelion, Almirall, Bayer, Biogen, Genzyme, Merck, Novartis, Octapharma, Receptos, Roche, Sanofi-Genzyme.* Deborah Pareto—UNRELATED:Payment for Lectures (including service on Speakers Bureaus): Novartis, Genzyme. A`lex Rovira—UNRELATED: Con-sultancy: Biogen Idec, Genzyme, Novartis, Olea Medical;Payment for Lectures (in-cluding service on Speakers Bureaus): Biogen Idec, Stendhal America, Genzyme, Novartis, Olea Medical;Payment for Development of Educational Presentations: Novartis, Stendhal America, Genzyme, Biogen. *Money paid to the institution.
REFERENCES
1. Río J, Castillo´ J, Rovira A, et al.Measures in the first year of therapy predict the response to interferon beta in MS.Mult Scler2009;15: 848 –53CrossRef Medline
2. Sormani MP, De Stefano N.Defining and scoring response to IFN- in multiple sclerosis. Nat Rev Neurol 2013;9:504 –12 CrossRef Medline
3. Sormani MP, Río J, Tintore` M, et al.Scoring treatment response in patients with relapsing multiple sclerosis. Mult Scler 2013;19: 605–12CrossRef Medline
4. Prosperini L, Mancinelli CR, De Giglio L, et al.Interferon beta failure predicted by EMA criteria or isolated MRI activity in multiple scle-rosis.Mult Scler2014;20:566 –76CrossRef Medline
5. Freedman MS, Selchen D, Arnold DL, et al; Canadian Multiple Scle-rosis Working Group.Treatment optimization in MS: Canadian MS Working Group updated recommendations.Can J Neurol Sci2013; 40:307–23CrossRef Medline
6. Stangel M, Penner IK, Kallmann BA, et al.Towards the implemen-tation of ‘no evidence of disease activity’ in multiple sclerosis treatment: the multiple sclerosis decision model.Ther Adv Neurol Disord2015;8:3–13CrossRef Medline
7. Altay EE, Fisher E, Jones SE, et al.Reliability of classifying multiple sclerosis disease activity using magnetic resonance imaging in a multiple sclerosis clinic.JAMA Neurol2013;70:338 – 44CrossRef Medline
8. Moraal B, Wattjes MP, Geurts JJ, et al.Improved detection of active multiple sclerosis lesions: 3D subtraction imaging.Radiology2010; 255:154 – 63CrossRef Medline
9. Moraal B, van den Elskamp IJ, Knol DL, et al.Long-interval T2-weighted subtraction magnetic resonance imaging: a powerful new outcome measure in multiple sclerosis trials.Ann Neurol2010;67: 667–75CrossRef Medline
sclerosis lesions in serial brain MRI.Neuroradiology2012;54:787– 807CrossRef Medline
11. Battaglini M, Rossi F, Grove RA, et al.Automated identification of brain new lesions in multiple sclerosis using subtraction images.
J Magn Reson Imaging2014;39:1543– 49Medline
12. Elliott C, Arnold DL, Collins DL, et al.Temporally consistent prob-abilistic detection of new multiple sclerosis lesions in brain MRI.
IEEE Trans Med Imaging2013;32:1490 –503CrossRef Medline
13. Sweeney EM, Shinohara RT, Shea CD, et al.Automatic lesion inci-dence estimation and detection in multiple sclerosis using multi-sequence longitudinal MRI.AJNR Am J Neuroradiol2013;34:68 –73
CrossRef Medline
14. Rey D, Subsol G, Delingette H, et al.Automatic detection and seg-mentation of evolving processes in 3D medical images: application to multiple sclerosis. Med Image Anal 2002;6:163–79 CrossRef Medline
15. Thirion JP, Calmon G.Deformation analysis to detect and quantify active lesions in three-dimensional medical image sequences.IEEE Trans Med Imaging1999;18:429 – 41CrossRef Medline
16. Vrenken H, Jenkinson M, Horsfield MA, et al; MAGNIMS Study Group.Recommendations to improve imaging and analysis of brain lesion load and atrophy in longitudinal studies of multiple sclerosis.J Neurol2013;260:2458 –71CrossRef Medline
17. Lublin FD, Reingold SC, Cohen JA, et al.Defining the clinical course of multiple sclerosis: the 2013 revisions.Neurology2014;83:278 – 86
CrossRef Medline
18. Polman CH, Reingold SC, Banwell B, et al.Diagnostic criteria for
multiple sclerosis: 2010 revisions to the McDonald criteria.Ann Neurol2011;69:292–302CrossRef Medline
19. Tustison NJ, Avants BB, Cook PA, et al.N4ITK: improved N3 bias correction. IEEE Trans Med Imaging 2010;29:1310 –20 CrossRef Medline
20. Ganiler O, Oliver A, Diez Y, et al.A subtraction pipeline for auto-matic detection of new appearing multiple sclerosis lesions in lon-gitudinal studies.Neuroradiology2014;56:363–74CrossRef Medline
21. Diez Y, Oliver A, Cabezas M, et al.Intensity based methods for brain MRI longitudinal registration: a study in multiple sclerosis pa-tients.Neuroinformatics2014;12:365–79CrossRef Medline
22. Thirion JP.Image matching as a diffusion process: an analogy with Maxwell’s demons. Med Image Anal 1998;2:243– 60 CrossRef Medline
23. Cabezas M, Oliver A, Roura E, et al.Automatic multiple sclerosis lesion detection in brain MRI by FLAIR thresholding. Comput Methods Programs Biomed2014;115:147– 61CrossRef Medline
24. Styner M, Lee J, Chin B, et al.3D segmentation in the clinic: a grand challenge II: MS lesion segmentation.MIDAS J2008;1– 6
25. Menke J, Martinez TR.Using permutations instead of Student’s t distribution for p-values in paired-difference algorithm compari-sons.In:Proceedings of the 2004 IEEE International Joint Conference of Neural Networks,Budapest, Hungary. July 25–29, 2004
26. Dancey C, Reidy J.Statistics without Maths for Psychology: Using SPSS for Windows.New York: Prentice Hall; 2004
27. Tintore M, Rovira A`, Río J, et al. Defining high, medium and low impact prognostic factors for developing multiple sclerosis.Brain