ORIGINAL RESEARCH
ADULT BRAIN
Differentiation of Low- and High-Grade Gliomas Using High
b-Value Diffusion Imaging with a Non-Gaussian
Diffusion Model
XY. Sui,XY. Xiong,XJ. Jiang,XM.M. Karaman,X K.L. Xie,XW. Zhu, andXX.J. Zhou
ABSTRACT
BACKGROUND AND PURPOSE:Imaging-based tumor grading is highly desirable but faces challenges in sensitivity, specificity, and diagnostic accuracy. A recently proposed diffusion imaging method by using a fractional order calculus model offers a set of new parameters to probe not only the diffusion process itself but also intravoxel tissue structures, providing new opportunities for noninvasive tumor grading. This study aimed to demonstrate the feasibility of using the fractional order calculus model to differentiate low- from high-grade gliomas in adult patients and illustrate its improved performance over a conventional diffusion imaging method using ADC (orD).
MATERIALS AND METHODS: Fifty-four adult patients (18 –70 years of age) with histology-proved gliomas were enrolled and divided into low-grade (n⫽24) and high-grade (n⫽30) groups. Multi-b-value diffusion MR imaging was performed with 17 b-values (0 – 4000 s/mm2) and was analyzed by using a fractional order calculus model. Mean values and SDs of 3 fractional order calculus parameters (D,, and) were calculated from the normal contralateral thalamus (as a control) and the tumors, respectively. On the basis of these values, the low-and high-grade glioma groups were compared by using a Mann-WhitneyUtest. Receiver operating characteristic analysis was performed to assess the performance of individual parameters and the combination of multiple parameters for low- versus high-grade differentiation.
RESULTS: Each of the 3 fractional order calculus parameters exhibited a statistically higher value (Pⱕ.011) in the low-grade than in the high-grade gliomas, whereas there was no difference in the normal contralateral thalamus (Pⱖ.706). The receiver operating characteristic analysis showed that(area under the curve⫽0.853) produced a higher area under the curve thanD(0.781) or(0.703) and offered a sensitivity of 87.5%, specificity of 76.7%, and diagnostic accuracy of 82.1%.
CONCLUSIONS: The study demonstrated the feasibility of using a non-Gaussian fractional order calculus diffusion model to differentiate low- and high-grade gliomas. While all 3 fractional order calculus parameters showed statistically significant differences between the 2 groups,exhibited a better performance than the other 2 parameters, including ADC (orD).
ABBREVIATIONS:AUC⫽area under the curve; FROC⫽fractional order calculus; ROC⫽receiver operating characteristic; WHO⫽World Health Organization
G
liomas are the most common primary brain tumors seen in adults, accounting for approximately one-third to one-half of all cases diagnosed1and 82% of malignant brain tumors.2Ac-cording to the latest classification by the World Health
Organiza-tion (WHO), gliomas can be divided into 4 grades, spanning a broad spectrum of biologic aggressiveness.3Accurate grading of
gliomas is essential to patient management, not only for selecting the most effective therapy for malignant tumors but also for avoiding unnecessary aggressive treatment for low-grade tumors before malignant transformation, maximizing the quality of life for patients.
MR imaging has been widely used for the initial diagnosis of brain tumors. Its role for tumor grading, however, is less
estab-Received November 25, 2015; accepted after revision February 22, 2016. From the Center for MR Research (Y.S., Y.X., M.M.K., X.J.Z.) and Departments of Bioengineering (Y.S., X.J.Z.), Radiology (K.L.X., X.J.Z.), and Neurosurgery (X.J.Z.), Uni-versity of Illinois at Chicago, Chicago, Illinois; and Department of Radiology (Y.X., J.J., W.Z.), Tongji Hospital, Tongji Medical College, Huazhong University of Science and Technology, Wuhan, Hubei, China.
Yi Sui and Ying Xiong contributed equally and share the first authorship. This work was supported, in part, by the National Natural Science Foundation of China (grant number: 30870702), the National Program of the Ministry of Science and Technology of China during the “12th Five-year Plan” (grant No. 2011BAI08B10), and the National Institutes of Health (grant No. 1S10RR028898).
Paper previously presented in part at: Annual Meeting of the Radiological Society of North America, November 30 to December 5, 2014; Chicago, Illinois.
Please address correspondence to Xiaohong Joe Zhou, PhD, Advanced Imaging Center, Suite 103, 2242 West Harrison St, Chicago, IL 60612; e-mail: [email protected] or Wenzhen Zhu, MD, Department of Radiology, Tongji Hospital, 1095 Jiefang Ave, Wuhan, Hubei 430030, China; email: [email protected]
Indicates open access to non-subscribers at www.ajnr.org
Indicates article with supplemental on-line photos.
lished.4Conventional MR imaging techniques, including
precon-trast T1-weighted, T2-weighted, T2-weighted FLAIR, and post-contrast T1-weighted imaging, have limited sensitivity (eg, 72.5%) and specificity (eg, 65.0%) for differentiating low- and high-grade gliomas.4,5Perfusion imaging (eg, CBV) can improve
the sensitivity to⬎90%,6but the specificity (eg, 57.5%) remains
inadequate and is subject to the choice of CBV threshold values, depending on tumor types.7-9With the ability to reveal tumor
metabolic changes, MR spectroscopy has also been used for tumor grading.6,10,11The long data-acquisition times, poor spatial
reso-lution, and magnetic susceptibility perturbations at specific loca-tions (eg, near the sinus and the skull) have hindered its wide-spread clinical application.6,10,11Because of the aforementioned
challenges and limitations faced by MR imaging/MR spectros-copy, tissue biopsy remains the criterion standard for tumor clas-sification and grading, despite its sampling errors, invasiveness, and inability to evaluate residual tumor tissue after cytoreductive surgery.5
During the past 2 decades, diffusion imaging based on ADC has been evaluated for tumor grading.12-14Despite the potential,
several studies indicate that ADC values overlap considerably among different tumor grades in both adult15-17and pediatric
patients.14,18-20The ADC values of tumor tissues are obtained by
characterizing the diffusion MR imaging signals with a monoex-ponential function, also known as a Gaussian diffusion model, which assumes that the diffusion process within a voxel is homo-geneous.21Unlike low-grade gliomas, high-grade gliomas have an
increased degree of tissue heterogeneity,22,23which is not
ade-quately captured by ADC. To overcome this limitation, a number of non-Gaussian diffusion models24-32have been developed to
extract tissue microstructural information, including tissue het-erogeneity, beyond what ADC can provide. The fractional order calculus (FROC) model,26,29for example, can produce a set of
parameters, including diffusion coefficientD(in square milli-meters/second), fractional order derivative in space, and a spa-tial parameter(in micrometers). These parameters provide ad-ditional avenues to probing not only the diffusion process itself (D) but also the intravoxel tissue heterogeneity () that can be used to improve tumor characterization.26,29,33In this study, we
demonstrate the feasibility of using a new set of parameters from the FROC model to improve MR imaging– based differentiation of low- and high-grade gliomas in adult patients.
MATERIALS AND METHODS
PatientsThe institutional review board of the performing hospital (Tongji Hospital, Wuhan, China) approved this prospective study, and written informed consent was obtained from all participating pa-tients. Fifty-six adult patients (18 –70 years of age) with an initial diagnosis of gliomas were recruited and underwent multi-b-value diffusion MR imaging before biopsy or surgical treatment. Two patients were excluded from the analysis due to excessive motion. Among the 54 patients included in the study, histopathology re-vealed 24 low-grade gliomas, including 1 pilocytic astrocytoma (WHO I), 2 oligodendrogliomas (WHO I and II), 20 astrocyto-mas (WHO II, predominantly diffuse tumors), 1 ganglioglioma (WHO II), and 30 high-grade gliomas, including 2 anaplastic
oli-godendrogliomas (WHO III), 10 anaplastic astrocytomas (WHO III), and 18 glioblastoma multiformes (WHO IV), according to the WHO guideline of 2007.3
Image Acquisition
All MR imaging examinations were performed on a 3T scanner (MR750; GE Healthcare, Milwaukee, Wisconsin) with a 32-chan-nel phased-array head coil. The imaging protocol included pre-contrast T1-weighted FLAIR, T2-weighted FLAIR, T2-weighted PROPELLER, and multi-b-value diffusion-weighted sequences, followed by postcontrast T1-weighted imaging. Susceptibility-weighted imaging was performed on selected patients when the conventional sequences were inadequate to characterize hemor-rhage within tumors. In all sequences, an FOV of 24 cm and a section thickness of 5 mm were used. The parameters specific to each anatomic imaging sequence were the following: T1-weighted FLAIR: TR/TE⫽1750/32.4 ms, TI⫽860 ms, flip angle⫽90°, and matrix size⫽320⫻320; T2-weighted PROPELLER: TR/TE⫽ 4260/102 ms, echo-train length⫽32, and matrix size⫽320⫻ 224; T2-weighted FLAIR: TR/TE⫽8400/150 ms, TI⫽2100 ms, echo-train length⫽26, and matrix size⫽256⫻256. The DWIs were produced by using a single-shot echo-planar imaging se-quence with 17 b-values (01, 201, 501, 1001, 2001, 4001, 6001, 8001,
10001, 12001, 16001, 20002, 24002, 28002, 32004, 36004and 40004
s/mm2, in which the subscript denotes the number of averages).
At each b-value, a Stejskal-Tanner diffusion gradient was succes-sively applied along the x-, y-, and z-axes to obtain a trace-weighted image to minimize the influence of diffusion anisot-ropy. The key data acquisition parameters were TR/TE⫽3025/ 94.5 ms, sensitivity encoding acceleration factor⫽2, separation between 2 diffusion gradient lobes⌬ ⫽38.6 ms, duration of each diffusion gradient␦⫽32.2 ms, matrix size⫽160⫻160 (recon-structed with a 256⫻256 matrix), and scan time⫽4 minutes 30 seconds.
Image Analysis
Equation 1 was used to fit the intensity (S) of the multi-b-value diffusion images voxel-by-voxel, according to the FROC diffusion model26,29:
1) S⫽S0exp
冋
⫺D2共 ⫺1兲共␥Gd␦兲2冉
⌬⫺2 ⫺1 2 ⫹1␦
冊册
, whereS0is the signal intensity without diffusion weighting,Gdisthe diffusion gradient amplitude, and␦and⌬are defined earlier. Theparameter (dimensionless; 0⬍ ⱕ1) is a fractional order derivative with respect to space, and(in units of micrometers) is a spatial constant to preserve the nominal units of the diffusion coefficient D(in square millimeters/second). In the fitting,D
(which reflects the intrinsic diffusivity) was estimated by a mono-exponential model by using the data acquired at lower b-values (ⱕ1000 s/mm2), in an attempt to makeDequivalent to
conven-tional ADC. AfterDwas determined,andwere subsequently obtained from a voxelwise nonlinear fitting by using a Levenberg-Marquardt algorithm34with all b-values.
with 8 and 15 years of clinical experience, respectively) blinded to the histology grades. Guided by the high-resolution anatomic im-ages, regions of hemorrhage, cystic change, and/or necrosis were excluded. In the solid region of tumors, the enhancing compo-nents and the nonenhancing (or not-so-obvious enhancing) components were measured and averaged. The ROI-based image analysis was performed with customized software developed in Matlab (MathWorks, Natick, Massachusetts).
Statistical Analysis
The mean and SD ofD,, andfor each patient were calculated from the normal contralateral thalamus and the tumor ROIs, re-spectively. On the basis of these values, the low-grade and high-grade glioma groups were compared by using a Mann-Whitney
Utest with a statistical significance set atP⬍.05.
To investigate the potential value of using combinations of the FROC parameters (D,, and) for differentiation of low- and high-grade gliomas, we employed a logistic regression model: 2) P0⫽exp(a0⫹a1D⫹a2 ⫹ a3)/[1⫹exp(a0⫹a1D
⫹a2 ⫹a3)],
wherea0is a constant, anda1,a2,anda3are the regression
coeffi-cients forD,, and, respectively. The regression coefficients were estimated by using a maximum-likelihood method.35
Re-ceiver operating characteristic (ROC) analysis was performed to
determine the area under the ROC curve (AUC) for assessing the performance of tumor differentiation by using each of the 3 FROC parameters individually and the combination of FROC parameters represented byP0. The best cutoff values in the ROC
analysis were determined by using the Youden index. To deter-mine the generalizability of the proposed method, we used a hold-out cross-validation algorithm by applying the logistic regression model, Equation 2, on a “training dataset” and a “test dataset” (randomly and equally split from the samples). The Pearson cor-relation coefficients were then determined between the predicted values and the “true” histopathologic results. All statistical analy-ses were performed by using SPSS software (IBM, Armonk, New York).
RESULTS
Comparison among Representative Patients in Each Group
Figure 1shows a set of axial images from a representative patient (oligodendroglioma, WHO I) in the low-grade glioma group, in-cluding T2-weighted EPI (Fig 1A), and the FROC maps (color images in Fig 1B–D). The precontrast and postcontrast T1-weighted FLAIR, precontrast T1-weighted FLAIR, and T2-weighted PROPELLER images are available in On-line Fig 1. The
D,, andmaps (Fig 1B–D, respectively) all exhibited higher values in the tumor than in the surrounding brain parenchyma.
Figure 2shows a set of axial images from a representative patient
FIG 1.A 41-year-old female patient with a low-grade glioma (oligodendroglioma, WHO grade I). T2-weighted EPI atb⫽0 with the tumor ROI encircled in green (A), and FROC parameter maps ofD(B),(C), and(D) with the tumor ROIs indicated by the black contours (see On-line Fig 1 for a complete set of images, including axial precontrast T1-weighted FLAIR, postcontrast T1-weighted FLAIR, precontrast T2-weighted FLAIR, and precontrast T2WI PROPELLER images). Compared with the patient with glioblastoma multiforme inFig 2, all 3 FROC parameters exhibited higher values. a.u. indicates arbitrary units. The color scale in (B) is expressed in square micrometers/millisecond.
[image:3.594.53.531.48.169.2] [image:3.594.53.532.231.353.2](glioblastoma multiforme, WHO IV) in the high-grade glioma group by using a layout similar to that ofFig 1. The FROC param-etersD,, and(Fig 2B–D, respectively) were considerably lower compared with those inFig 1B–D, leading to a distinct difference between the high- and low-grade tumors. Additional anatomic images are available (On-line Fig 2).
Group Comparison Based on the FROC Parameters
After calculating the mean values of the FROC parameters from each tumor ROI, we obtained the means and SDs from each pa-tient group; they are listed inTable 1. BecauseDis the mathematic equivalent to the conventional ADC (see “Materials and Meth-ods”), an agreement of⬎96% was observed betweenDfrom the FROC model and ADC from a monoexponential fitting by using 2 b-values (b⫽0 and 1000 s/mm2), as is typical in clinical studies.
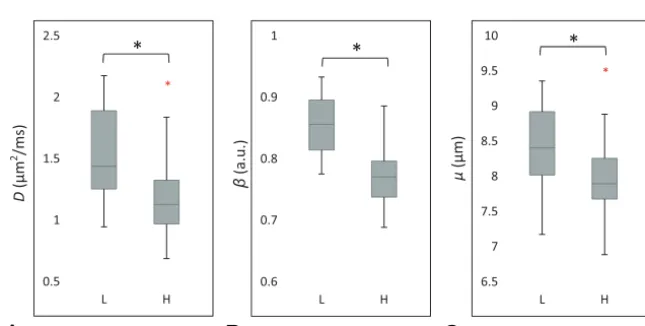
Thus, ADC andDare used interchangeably in this study. Com-parison of the FROC parameters between the 2 tumor groups is shown in a set of boxplots (Fig 3). Consistent with the represen-tative cases inFigs 1and2, the group analysis exhibited statisti-cally higher values (Pⱕ.011) in the low-grade than the high-grade gliomas for each of the 3 FROC parameters. In comparison, the internal control by using a normal contralateral thalamus showed no significant differences (Pⱖ.706) in the FROC param-eters between the 2 patient groups, as summarized inTable 1.
ROC Analysis
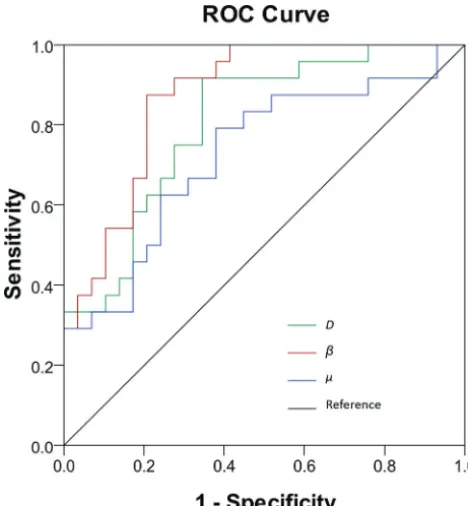
Figure 4illustrates the ROC curves using individual FROC pa-rameters for differentiating low- (positive) from high-grade (neg-ative) gliomas. BecauseDandwere strongly correlated (see the results inFig 5),was excluded from the logistic regression to avoid overweighting. The constant and regression coefficients ofDandwere 19.936,⫺0.012, and⫺24.145, respectively (see Equation 2), and the correspondingP0was used in ROC
anal-ysis to represent the combination ofDand.Table 2 summa-rizes the cutoff values with the corresponding sensitivity, spec-ificity, accuracy, positive and negative predictive values, and asymptotic significance (P value). Although D offered the highest sensitivity (91.7%), its specificity was the lowest (63.3%), leading to moderate accuracy (77.5%). The sensitiv-ity was noticeably improved byor the combination ofand
D,which resulted in the best accuracy (82.1%). The AUC val-ues of the ROC analyses together with their 95% confidence intervals and standard errors are given inTable 3. The param-eterhad a higher AUC (0.853) thanD(0.781) or(0.703), indicating a better performance for glioma differentiation. The combination ofDanddid not improve the sensitivity, spec-ificity, accuracy, or AUC compared with.
The cross-validation analysis showed that the Pearson corre-lation coefficients between the predicted values and the “true” histopathologic results were 0.529 (P⬍.01) for the training set and 0.625 (P⬍.01) for the test set. The significance test for the difference between the 2 correlations (FisherZ-test) resulted in a
Pvalue of .617, suggesting that the training and test datasets did not produce statistically different correlations.
The scatterplots inFig 5illustrate the possible (or lack of) correlation among the FROC parameters using all patient data. A very strong correlation betweenDandwas observed (Fig 5A) with a Pearson correlation coefficient ofr⫽0.930 (P⬍.001). In contrast, a noticeably weaker correlation was seen betweenDand
(r⫽0.766,P⬍.001). InFig 5B, the best cutoff values ofDand
are indicated by the vertical (red) and the horizontal (green) lines, respectively. The oblique black line inFig 5Bcorresponds to the cutoff probability ofP0⫽.662 for the combination ofDand.
The close proximity between the black and green lines is a reflection of the fact that Dhas a considerably smaller role thanin the equationP0⫽exp(19.936⫺
0.012D⫺24.145) / [1⫹exp(19.936⫺ 0.012D⫺24.145)].
DISCUSSION
We have investigated the feasibility of using a set of novel FROC diffusion parameters to differentiate low- from high-grade gliomas in adults and dem-onstrated thatD,,andexhibited sig-nificant differences between the 2 tumor groups. When used individually,  outperformed the other 2 parameters. These results are important because they demonstrate that new parameters from the FROC diffusion model can
contrib-A
B
C
[image:4.594.52.284.382.476.2]FIG 3. Boxplots of FROC parametersD(A),(B), and(C) between the low- (L) and high-grade (H) gliomas.Boxesrepresent the 25th and 75th percentiles with the median indicated by themiddle linein the box. Verticalend barsdenote the range of data except for the outliers (ie, values larger than the 75th percentile or smaller than the 25th percentile) represented by ared asterisk. Theblack asterisk indicates a significant difference (P⬍.05) between the low- and high-grade gliomas.
Table 1: FROC parameters of gliomas and normal contralateral thalamus of patients with low-grade and high-grade gliomas
D(m2/ms)  (m)
Gliomas
LG 1.54⫾0.35 0.85⫾0.05 8.43⫾0.63 HG 1.19⫾0.36 0.77⫾0.06 8.01⫾0.59
Pvaluea ⬍.001 ⬍.001 .011
NCTH
LG 0.76⫾0.06 0.78⫾0.03 7.33⫾0.38 HG 0.76⫾0.04 0.78⫾0.03 7.34⫾0.33
Pvaluea .876 .706 .890
Note:—NCTH indicates normal contralateral thalamus; LG, low-grade; HG, high-grade.
a
[image:4.594.54.377.513.676.2]ute positively to glioma differentiation and extend the capability of diffusion imaging beyond conventional ADC.
During the past 2 decades, ADC has been applied to differen-tiating a number of brain tumors,14,16,18,36including gliomas.
Al-though the sensitivity of using ADC to detect neoplastic changes
has been demonstrated, considerable overlap in ADC values exists between low- and high-grade brain tumors,14,16,17compromising
the specificity and diagnostic accuracy. The suboptimal performance of ADC for tumor grading originates, at least in part, from the use of a Gaussian diffusion model (ie, the monoexponential model), which assumes a homogeneous diffusion process in the tumor, despite overwhelming evidence of tumor heterogeneity.37-39In the presence
of heterogeneity, non-Gaussian diffusion models can be more effec-tive in characterizing the complex diffusion process, particularly at high b-values (eg, bⱖ1500 s/mm2).15,21-32,36,40
Like other non-Gaussian diffusion models, the FROC diffusion model provides new parameters complementary to ADC. In the FROC model, correlation betweenand intravoxel tissue heteroge-neity has been suggested in several studies on phantoms and tissue specimens.26,29,41,42This correlation is also supported by in vivo
studies indicating that tissues with a smaller-value exhibit a larger degree of intravoxel heterogeneity.22,27,33,43Tissue heterogeneity is
also a contributing factor to the WHO tumor grading system.44
Thus, theparameter may provide a link between an MR imaging measurement and WHO grades. The lowervalues (ie, a high degree of intravoxel heterogeneity) seen in high-grade gliomas (Figs 2and3) are consistent with the increased degree of tissue heterogeneity due to the presence of edema, necrosis, hemorrhage, microcalcification, and so forth. This observation is also consistent with a recent study on pediatric brain tumors33,43in which high-grade tumors showed
sig-nificantly lowervalues compared with their low-grade counter-parts. Further studies on well-controlled excised tissues are needed to directly establish and validate the correlation between diffusion het-erogeneity suggested byand structural heterogeneity revealed by histopathology.
Kwee et al27 recently studied
high-grade gliomas by using an alternative non-Gaussian diffusion model based on a stretched-exponential formulism.28
Although this model is similar to the FROC model, the stretched-exponential is developed empirically instead of using the fractionalized Fick diffusion equa-tion. The heterogeneity index␣in the stretched-exponential model resembles
in this study. The␣ value for high-grade gliomas was reported to be 0.58⫾ 0.08, which is lower than⫽0.77⫾ 0.06 in our study. This finding is most likely due to the different diffusion times (⌬) used in these studies.45Compared
with the study of Kwee et al, our study produced a noticeably smaller SD in because of the relatively large number of b-values used. Although a minimum of 4 b-values is needed to obtain the 3 FROC parameters, a larger number of b-values improves the robustness of the nonlinear fitting, particularly when the SNR is low.
Using all the patient data in this study, we observed a strong linear corre-lation betweenDand(Fig 5A).
Be-FIG 4.ROC curves for(in red),D(in green), and(in blue) for differentiating low- and high-grade gliomas. Thediagonal lineserves as a reference.
A
B
[image:5.594.52.286.117.370.2]FIG 5. Scatterplots ofDversus(A) andDversus(B) from all patients (theblue diamonds represent low-grade and thered trianglesdenote high-grade gliomas). A very strong correlation betweenDand(A) (Pearson correlation coefficientr⫽0.930;P⬍.001) and a weaker correlation betweenDand(B) (Pearson correlation coefficientr⫽0.766;P⬍.001) are illustrated.B, The dashed linesindicate the cutoff values forD(red),(green), and the combination ofDand (black; linear equation:⫽0.000497D⫹0.798).
Table 2: Cutoff, sensitivity, specificity, diagnostic accuracy, and asymptotic significance (Pvalue) usingD,,, and a combination ofDandfor differentiating low- (positive) from high-grade (negative) gliomasa
Cutoff Sensitivity Specificity Accuracy PPV NPV PValue
D 1.189 91.7% 63.3% 77.5% 66.7% 90.5% ⬍.001
 0.797 87.5% 76.7% 82.1% 75.0% 88.5% ⬍.001
7.969 79.2% 60.0% 69.6% 61.3% 78.3% .0059
D⫹ 0.657 87.5% 76.7% 82.1% 75.0% 88.5% ⬍.001
Note:—PPV indicates positive predictive value; NPV, negative predictive value.
[image:5.594.55.375.415.559.2] [image:5.594.54.378.659.714.2]cause has been related to the dimension of free diffusion space,26the correlation inFig 5Areflects the classic relationship
between the diffusion rate and mean free length.was less corre-lated withDor. This weaker correlation can be exploited to improve specificity and diagnostic accuracy because these 2 pa-rameters act more independently. In this study, we have seen ev-idence suggesting thatis more dominant thanDfor differenti-ating low- from high-grade gliomas because the combination of withDdid not improve the performance compared with using alone. This finding suggests the important role of tumor hetero-geneity in various tumor grades.
Our study has several limitations. First, despite the improve-ment offered by the FROC model in glioma grading, the sensitiv-ity, specificsensitiv-ity, and diagnostic accuracy remain suboptimal. An extension of the FROC model to quantifying temporal heteroge-neity, as demonstrated recently,42,43suggests new opportunities
to further improve the performance. These non-Gaussian diffu-sion imaging techniques may eventually help in complementing surgical biopsy in situations in which tissue biopsy is difficult or risky. Second, the number of patients enrolled in the study is moderate. As such, we did not attempt to further distinguishing glioma subtypes or individual grades. Finally, limited by the SNR, the highest b-value attempted in this study was 4000 s/mm2,
though an even higher b-value may further improve the reliability of extracting the FROC diffusion parameters.26,29,45
CONCLUSIONS
We have demonstrated the feasibility of using high-b-value diffu-sion MR imaging with the FROC diffudiffu-sion model to improve differentiation between low- and high-grade gliomas. In particu-lar, the new parameteroffers a higher diagnostic accuracy than using the diffusion coefficient (Dor ADC) alone and is the most useful and dominant parameter among the 3 FROC parameters for differentiating glioma grades. Although the focus of this study is on gliomas, the non-Gaussian diffusion imaging approach demonstrated herein is expected to have applications in other disease processes that involve tissue-heterogeneity changes.
ACKNOWLEDGMENTS
The authors are grateful to Drs Keith R. Thulborn, Kejia Cai, and Frederick C. Damen for helpful discussions.
Disclosures: Yi Sui—UNRELATED:Employment: GE Healthcare,Comments: joined GE Healthcare after the work was done. Xiaohong Joe Zhou—RELATED:Grant: Na-tional Institutes of Health grant No. 1S10RR028898*;UNRELATED:Consultancy: Ho-rizon Medical Physics Services,Comments: consulting fees and ownership;Grants/ Grants Pending:National Institutes of Health Grant No. 1R21EB023050 – 01,* AbbVie
Pharmaceuticals,*Comments: federal or industrial grant support;Royalties:Elsevier Publishing,Comments: royalty payment for a book I coauthored. *Money paid to the institution.
REFERENCES
1. Ostrom QT, Gittleman H, Liao P, et al.CBTRUS statistical report: primary brain and central nervous system tumors diagnosed in the United States in 2007–2011.Neuro Oncol2014;16(suppl 4):iv1– 63 CrossRef Medline
2. Omuro A, DeAngelis LM. Glioblastoma and other malignant gliomas: a clinical review. JAMA 2013;310:1842–50 CrossRef Medline
3. Louis DN, Ohgaki H, Wiestler OD, et al.The 2007 WHO classifica-tion of tumours of the central nervous system.Acta Neuropathol
2007;114:97–109Medline
4. Upadhyay N, Waldman AD.Conventional MRI evaluation of glio-mas.Br J Radiol2011;84(Spec No 2):S107–11CrossRef Medline 5. Law M, Yang S, Wang H, et al.Glioma grading: sensitivity,
specific-ity, and predictive values of perfusion MR imaging and proton MR spectroscopic imaging compared with conventional MR imaging.
AJNR Am J Neuroradiol2003;24:1989 –98Medline
6. Poussaint TY, Rodriguez D.Advanced neuroimaging of pediatric brain tumors: MR diffusion, MR perfusion, and MR spectroscopy.
Neuroimaging Clin N Am2006;16:169 –92, ixMedline
7. Law M, Young RJ, Babb JS, et al.Gliomas: predicting time to pro-gression or survival with cerebral blood volume measurements at dynamic susceptibility-weighted contrast-enhanced perfusion MR imaging.Radiology2008;247:490 –98Medline
8. Young GS, Setayesh K.Spin-echo echo-planar perfusion MR imag-ing in the differential diagnosis of solitary enhancimag-ing brain lesions: distinguishing solitary metastases from primary glioma. AJNR Am J Neuroradiol2009;30:575–77CrossRef Medline
9. Hirai T, Murakami R, Nakamura H, et al.Prognostic value of perfu-sion MR imaging of high-grade astrocytomas: long-term follow-up study.AJNR Am J Neuroradiol2008;29:1505–10Medline
10. Schneider JF, Confort-Gouny S, Viola A, et al.Multiparametric dif-ferentiation of posterior fossa tumors in children using diffusion-weighted imaging and short echo-time 1H-MR spectroscopy. J Magn Reson Imaging2007;26:1390 –98Medline
11. Ishimaru H, Morikawa M, Iwanaga S, et al.Differentiation between high-grade glioma and metastatic brain tumor using single-voxel proton MR spectroscopy.Eur Radiol2001;11:1784 –91Medline 12. Kang Y, Choi SH, Kim YJ, et al.Gliomas: histogram analysis of
ap-parent diffusion coefficient maps with standard- or high-b-value diffusion-weighted MR imaging– correlation with tumor grade.
Radiology2011;261:882–90CrossRef Medline
13. Raab P, Hattingen E, Franz K, et al.Cerebral gliomas: diffusional kurtosis imaging analysis of microstructural differences.Radiology
2010;254:876 – 81CrossRef Medline
14. Rumboldt Z, Camacho DL, Lake D, et al.Apparent diffusion coeffi-cients for differentiation of cerebellar tumors in children.AJNR Am J Neuroradiol2006;27:1362– 69Medline
15. Bian W, Khayal IS, Lupo JM, et al.Multiparametric characterization of grade 2 glioma subtypes using magnetic resonance spectro-scopic, perfusion, and diffusion imaging. Transl Oncol2009;2: 271– 80Medline
16. Maier SE, Sun Y, Mulkern RV.Diffusion imaging of brain tumors.
NMR Biomed2010;23:849 – 64CrossRef Medline
17. Yamasaki F, Kurisu K, Satoh K, et al.Apparent diffusion coefficient of human brain tumors at MR imaging.Radiology2005;235:985–91 Medline
18. Bull JG, Saunders DE, Clark CA.Discrimination of paediatric brain tumours using apparent diffusion coefficient histograms.Eur Ra-diol2012;22:447–57CrossRef Medline
19. Poretti A, Meoded A, Huisman TA.Neuroimaging of pediatric pos-terior fossa tumors including review of the literature.J Magn Reson Imaging2012;35:32– 47CrossRef Medline
[image:6.594.53.285.80.137.2]20. Porto L, Jurcoane A, Schwabe D, et al.Differentiation between high
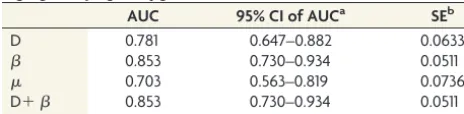
Table 3: AUC values of the ROC analyses with their 95% confidence intervals and standard errors using D,,, and a combination of D andfor differentiating low- (positive) from high-grade (negative) gliomas
AUC 95% CI of AUCa SEb
D 0.781 0.647–0.882 0.0633
 0.853 0.730–0.934 0.0511
0.703 0.563–0.819 0.0736
D⫹ 0.853 0.730–0.934 0.0511
Note:—SE indicates standard error.
a
Binomial exact CIs.
b
SEs were computed by the method of DeLong et al46
and low grade tumours in paediatric patients by using apparent diffusion coefficients. Eur J Paediatr Neurol 2013;17:302– 07 CrossRef Medline
21. Le Bihan D.The ‘wet mind’: water and functional neuroimaging.
Phys Med Biol2007;52:R57–90Medline
22. Pfister S, Hartmann C, Korshunov A.Histology and molecular pa-thology of pediatric brain tumors.J Child Neurol2009;24:1375– 86 CrossRef Medline
23. Gauvain KM, McKinstry RC, Mukherjee P, et al.Evaluating pediatric brain tumor cellularity with diffusion-tensor imaging.AJR Am J Roentgenol2001;177:449 –54Medline
24. Le Bihan D.Intravoxel incoherent motion perfusion MR imaging: a wake-up call.Radiology2008;249:748 –52Medline
25. Jensen JH, Helpern JA, Ramani A, et al. Diffusional kurtosis imaging: the quantification of non-Gaussian water diffusion by means of magnetic resonance imaging.Magn Reson Med2005;53: 1432– 40Medline
26. Magin RL, Abdullah O, Baleanu D, et al.Anomalous diffusion ex-pressed through fractional order differential operators in the Bloch-Torrey equation.J Magn Reson2008;190:255–70Medline 27. Kwee TC, Galba´n CJ, Tsien C, et al.Intravoxel water diffusion
het-erogeneity imaging of human high-grade gliomas.NMR Biomed
2010;23:179 – 87CrossRef Medline
28. Bennett KM, Schmainda KM, Bennett RT, et al.Characterization of continuously distributed cortical water diffusion rates with a stretched-exponential model. Magn Reson Med 2003;50:727–34 Medline
29. Zhou XJ, Gao Q, Abdullah O, et al.Studies of anomalous diffusion in the human brain using fractional order calculus.Magn Reson Med
2010;63:562– 69CrossRef Medline
30. Ozarslan E, Basser PJ, Shepherd TM, et al.Observation of anomalous diffusion in excised tissue by characterizing the diffusion-time de-pendence of the MR signal.J Magn Reson2006;183:315–23Medline 31. Yablonskiy DA, Bretthorst GL, Ackerman JJ.Statistical model for diffusion attenuated MR signal.Magn Reson Med2003;50:664 – 69 Medline
32. Bar-Shir A, Cohen Y.High b-value q-space diffusion MRS of nerves: structural information and comparison with histological evidence.
NMR Biomed2008;21:165–74Medline
33. Sui Y, Wang H, Liu G, et al.Differentiation of low- and high-grade pediatric brain tumors with high b-value diffusion-weighted MR imaging and a fractional order calculus model.Radiology2015;277: 489 –96Medline
34. Press WH, Teukolsky SA, Vetterling WT, et al.Numerical Recipes 3rd Edition: The Art of Scientific Computing. New York: Cambridge Uni-versity Press; 2007:799 – 806
35. Menard SW.Applied Logistic Regression Analysis.Thousand Oaks, California: Sage Publications; 2001:1–120
36. Khayal IS, McKnight TR, McGue C, et al.Apparent diffusion coeffi-cient and fractional anisotropy of newly diagnosed grade II glio-mas.NMR Biomed2009;22:449 –55CrossRef Medline
37. Janiszewska M, Beca F, Polyak K.Tumor heterogeneity: the Ler-naean hydra of oncology?Oncology (Williston Park)2014;28:781– 82, 784Medline
38. Burrell RA, McGranahan N, Bartek J, et al.The causes and conse-quences of genetic heterogeneity in cancer evolution.Nature2013; 501:338 – 45CrossRef Medline
39. Marusyk A, Almendro V, Polyak K.Intra-tumour heterogeneity: a looking glass for cancer?Nat Rev Cancer2012;12:323–34CrossRef Medline
40. Grinberg F, Farrher E, Kaffanke J, et al.Non-Gaussian diffusion in human brain tissue at high b-factors as examined by a combined diffusion kurtosis and biexponential diffusion tensor analysis.
Neuroimage2011;57:1087–102CrossRef Medline
41. Magin RL, Akpa BS, Neuberger T, et al.Fractional order analysis of Sephadex gel structures: NMR measurements reflecting anomalous diffusion. Commun Nonlinear Sci Numer Simul2011;16:4581– 87 Medline
42. Ingo C, Magin RL, Colon-Perez L, et al.On random walks and en-tropy in diffusion-weighted magnetic resonance imaging studies of neural tissue.Magn Reson Med2014;71:617–27CrossRef Medline 43. Karaman MM, Sui Y, Wang H, et al.Differentiating low- and
high-grade pediatric brain tumors using a continuous-time random-walk diffusion model at high b-values.Magn Reson Med2015 Oct 31. [Epub ahead of print]CrossRef Medline
44. Rosenblum MK.The 2007 WHO Classification of Nervous System Tumors: newly recognized members of the mixed glioneuronal group.Brain Pathol2007;17:308 –13Medline
45. Zhou XJ, Gao Q, Sirinivasan G, et al.Dependence of fractional order diffusion model parameters on diffusion time.In:Procedures of the Annual Meeting of the International Society for Magnetic Resonance in Medicine,Honolulu, Hawaii. April 18 –24, 2009