Promoting Lean Team Effectiveness:
How Team Dynamics Affect Lean Performance Outcomes
Irene E. Overbeek
University of Twente, The Netherlands
Advisors University of Twente: Prof. Dr. C.P.M. Wilderom
Dr. H.A. van Vuuren
Advisor House of Performance: MSc. (PhDc) D. H. van Dun
2
Promoting Lean Team Effectiveness:
How Team Dynamics Affect Lean Performance Outcomes
Irene Overbeek, University of Twente, The Netherlands
Abstract
Based on team-effectiveness theory, this study focuses on the dynamics of Lean teams and their members. Our
aim was to discover which team dynamics have a positive effect on shop-floor Lean team performance. After
extensive pre-testing and fine tuning in three rounds, a behavioral-dynamics survey was held among the 431
members of 31 Lean teams. Further, each’ teams leader (N=34) and department head (N=39) rated team
performance, customer satisfaction and a new measure of general Leanness. Our findings indicate that at an individual level, innovation and team cohesion are predictive of Lean team performance outcomes. Further, educational level and the number of months working with Lean were predictive of Lean team performance outcomes.
The research marks a preliminary step in determining the team dynamics for successful implementation and sustaining of Lean. However, larger-scale quantitative hypotheses-testing studies for exploring Lean team dynamics are recommended, combined with qualitative approaches such as video-registered behavioral observations, given their additional value over respondents’ self-reports.
Keywords: Lean team dynamics, Continuous improvement, group dynamics, team effectiveness, affective states, cognitive states, self-assessment, Lean behaviors.
Introduction
3 dramatically over the years (see, e.g. Bhasin & Burcher, 2006; Bicheno & Holweg, 2009; Shook, 2010; Zu, Robbins, & Fredendall, 2010). However, many Lean efforts fail. Already, several researchers have proposed that success of Lean does not lie in simply implementing best practice tools and methods (Ballé, 2005; Bhasin & Burcher, 2006). Instead, these tools and methods are built upon a culture of Continuous Improvement (CI), which has to be instilled in the individuals within organizations. Knowledge of this cultural side of Lean would help organizations to successfully implement and sustain Lean, and thus enhance their performance (Aloini, Martini, & Pellegrini, 2011; Bessant, Caffyn, & Gallagher, 2001; Van Dun & Wilderom, 2012). Already, various researchers have tried to identify behavioral dynamics that constitute such a succesful Lean culture (most notably, Bessant, et al., 2001; Caffyn, 1999; De Lange-Ros & Boer, 2001; Jørgensen, Boer, & Gertsen, 2003; Ni & Sun, 2009). Most of these studies focused on the organizational level, and little attention has been paid yet to the Lean team dynamics in shop-floor team settings (Van Dun & Wilderom, 2012). However, shop-floor teams are considered the starting point for Lean implementation (Boer & Gertsen, 2003; Edmondson, Dillon, & Roloff, 2007), since much of the value of a product or service is created at the bottom of the organization pyramid (see e.g. Womack & Jones, 2003). Further, team-based working has increasingly become the norm in organizations (De Dreu & Weingart, 2003).
For the above reasons, we designed an online survey, which we used to discover which team dynamics contribute to Lean team performance in a shop-floor setting. With team dynamics, we refer to the patterns of interaction between Lean team members.The existence of a reliable measure of team dynamics in shop-floor Lean teams may stimulate more research in this increasingly important area of study. Thus, our guiding research question is:
4
Effective Lean Team Dynamics
In this section, we first discuss the team level as a unit of analysis. Then, we reflect on existing Lean team self-assessments found in literature. Next, we address the input-mediator-output-input (IMOI) model for determining the effectiveness of teams. Based on this IMOI approach, we review the team dynamics that are relevant to the Lean team context.
Defining Lean Teams
In literature, several definitions of teams can be found. In this study, the focus is on teams who work according to the following five Lean principles: (1) Identification of customer value, (2) Classification of all the necessary steps of the value stream, to highlight non-value-adding waste, (3) Creation of an uninterrupted production flow, (4) Production that meets customer demands, and finally (5) Striving for perfection by continuously searching for and eliminating waste (Hines, et al., 2004; Van Dun & Wilderom, 2012). Further, the focus is on work teams. Kozlowski and Bell (2003, p. 334) defined work teams in such a way that it properly captures the type of teams we aim to investigate in this study:
“collectives who exist to perform their organizationally relevant tasks, share one or more common goals, interact socially, exhibit task interdependencies, maintain and manage boundaries, and are embedded in an organizational context that sets boundaries, constrains the team, and influences exchanges with other units in the broader entity”.
5 the value of a product or service is created in the bottom of the organization pyramid (see e.g. Womack & Jones, 2003). Imai (1997) explicitly called for involvement of shop-floor teams in Lean by referring to it as ‘Gemba’, which can be translated as ‘the real place’, where improvement ideas must be formulated and implemented. Since, according to the fifth Lean principle, Lean teams are continuously looking for ways to improve their effectiveness, it is likely that such teams share team dynamics identified in the much more established field of team/group effectiveness. In the following section, we first address current Lean/ CI assessment tools. Then, we will discuss the IMOI model for determining the effectiveness of teams, followed by a review of the main team dynamics found in team effectiveness literature. Further, we included theory on TQM, CI, Kaizen and self-managed teams. Literature on TQM, CI and Kaizen is relevant because of their close relatedness to Lean; all have equal goals of continuous improvement and waste reduction (Andersson, Eriksson and Torstensson, 2006; Powel, 1995; Cua, Kone & Schroeder, 2001). Further, successful Lean teams are argued to be self-managing (Delbridge, Lowe & Oliver, 2000), as employee involvement is considered to be the key to Lean success (Imai, 1997). This is why we consider literature on self-managed teams to be relevant in a Lean team context as well.
Lean Assessment Tools
7 In the next chapter, we draw on literature from Lean, team effectiveness, TQM, CI, Kaizen and self-managing teams to identify the cognitive, affective and behavioral dynamics that are important for shop-floor Lean team performance.
The IMOI Model of Team Effectiveness
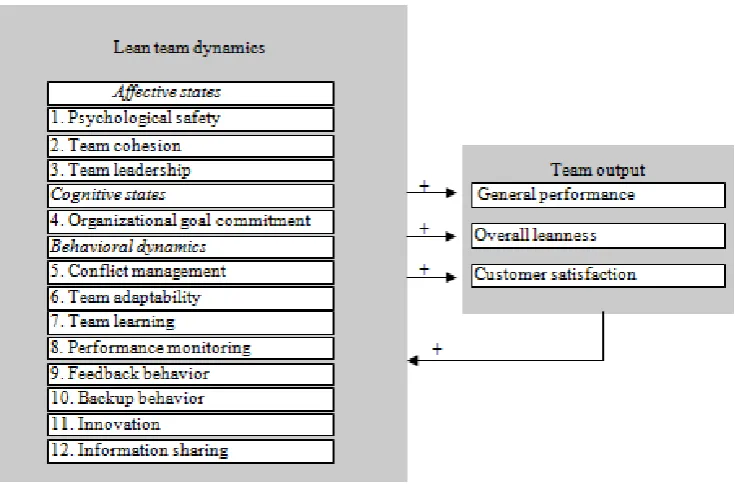
8 Figure 1
The Mediating Lean Team Dynamics of Interest to our Study.
Lean Team Dynamics
9 The affective and cognitive states are based on a recent literature review on Lean team dynamics by Van Dun and Wilderom (2012), and include the following: Psychological safety, team cohesion, and organizational goal commitment. Further, team leadership was included as an affective state (Kozlowski and Ilgen, 2006); Marks, Mathieu and Zaccaro, 2001; Salas, Sims and Burke, 2005).
An overview of the included team dynamics can be found in Figure 1. Below, we first address the affective states, followed by the cognitive states. Lastly, the behavioral dynamics are discussed.
Affective States
1. Psychological safety: Psychological safety in a team involves the shared belief that the team is a safe context for interpersonal risk-taking (Edmondson, 1999). In psychologically safe climates, team members are able to apply behaviors such as feedback, information sharing, experimenting, asking for help, and discussing errors (Edmondson, 1999). This is because they believe that if they make a mistake, others will not penalize them or think less of them for it, which gives team members the confidence to take the risks associated with the behaviors described above (Edmondson, 1999). In Lean team research, psychological safety has not been addressed yet. However, Rothenberg (2003), Emiliani (1998) and Jackson and Mullarkey (2000) did study trust levels in Lean teams, which they found to be higher than in similar non-Lean teams. Further, trust has been linked to successful TQM implementation (Emery, Summers, & Surak, 1996). Rothenburg (2003) argued that without trust, employees will not contribute to the continuous improvement of company work practices, whilst this is a key aspect of Lean. Since a psychologically safe environment entails trust, we expect psychological safety to be important for Lean team performance.
10 2. Team cohesion: Team cohesion is defined as “the tendency for a group to stick together and remain united in the pursuit of its instrumental objectives” (Tekleab, Quigley, & Tesluk, 2009). Team cohesion is mostly affective, since it focuses on the extent to which individuals feel positive about their team members. A large amount of meta-analyses have been conducted regarding the relationship between cohesion and performance (Beal, Cohen, Burke, & McLendon, 2003; Carron, Colman, Wheeler, & Stevens, 2002). From these meta-analyses, the general conclusion appears to be that cohesion is significantly moderately and positively correlated to team performance. The moderate link between team cohesion and performance may be found for three reasons. First, one important caveat to current team cohesion-performance research is the fact that no attention has been paid to specific types of teams, which makes it difficult to apply results to a specific team type (Chioccio & Essiembre, 2009). Second, it has been suggested that a high level of team cohesion might lead to groupthink, which may compromise the quality of team decision making and problem solving (Tekleab, et al., 2009). Van Dun and Wilderom (2012) suggested that in a Lean team setting, groupthink causes team members to conform to a certain mindset with fixed and narrow assumptions, which might hold back any further performance improvement or learning. Therefore, groupthink is likely to be especially harmful in a Lean team setting. As such, team cohesion might be a hygiene factor, instead of a motivational factor (see Herzberg, 1968); it provides an essential foundation for team performance, but is not contributing to it in itself. We therefore expect that in Lean teams, the relation between team cohesion and performance is nonlinear: Team cohesion contributes to team performance, but only to a certain degree; if team cohesion is too high, the effect on performance is negative:
11 3. Team Leadership. The team leader is of vital importance in enabling effective teamwork (Day, Gronn, & Salas, 2004). Team leaders can have a positive influence on affective, behavioral and cognitive dynamics (Zaccaro, Rittman, & Marks, 2001), for instance; they can create and support a teams’ social climate (Ganster, Fusilier, & Mayes, 1986; Morgeson, DeRue, & Karam, 2010), which entails psychological safety and team cohesion; and they can promote team learning and adaptation among team members (Edmondson, 1999). A team leader’s positive influence on these dynamics requires dyadic relationships of high-quality between team leaders and their team members (Graen & Uhl-Bien, 1995). Such type of relationship between team leader and team member is known as high Leader-member exchange (LMX). It was found that performance increased when team leaders develop high-qua lity relationships with all their team members (Graen & Uhl-Bien, 1995). We expect that team leadership is important for shop-floor Lean teams as well. This may sound as a paradox, since effective Lean teams are considered to be self-managing (Delbridge, Lowe & Oliver, 2000). However, in self-managing team literature, it is argued that a team leader can help a team to manage itself (Manz & Sims, 1987). Similarly, Ooi, Arumugam, Teh, & Chong (2008) concluded that it is a Lean leader’s task to empower his or her direct reports to express their ideas. Therefore, we propose the following:
H3: Team leadership is positively related to Lean team performance.
Cognitive States
12 outcomes (Aloini, et al., 2011; Bessant, et al., 2001; Caffyn, 1999; Delbridge, 1995; Zeitz, Johannesson, & Ritchie, 1997). Bessant et al. (2001) and Caffyn (1999) suggested that members of advanced Lean teams show a high level of awareness of both company goals and strategic performance measures. Aloini et al (2011) argued that Lean team members assess their proposed improvements against strategic objectives to ensure consistency. Further, Lean team members “use the the organisation’s strategy and objectives to focus and prioritise their improvement activities” (Aloini, et al., 2011, p. 646). Van Dun and Wilderom (2012) hypothesized that before Lean is able to take root in a team, its members need to subscribe on a cognitive level to the company’s strategic continuous improvement goals.
A team-effectiveness literature review by Meyer, Stanley, Herscovitch, and Topolnytsky (2002) showed that affective commitment to an organization has a strong relationship with organization-relevant outcomes (such as performance and attendance), as well as with employee-relevant outcomes (such as stress). One form of such affective commitment is organizational goal commitment. Given the fact that organizational goal commitment is a form of affective commitment, we expect that the abovementioned positive outcomes also apply to organizational goal commitment. Further, since organizational goal commitment has already been suggested to be positively related to Lean team performance, we propose the following:
13
Behavioral Dynamics
Below, we discuss the five behavioral dynamics as derived from Kozlowski and Ilgen (2006); Marks, Mathieu and Zaccaro (2001); Salas, Sims and Burke (2005) and Van Dun and Wilderom (2012): conflict management, adaptability, team learning, performance monitoring and backup behavior; complemented with, feedback and innovation.
5. Conflict Management: Conflict can be defined as “perceived incompatibilities or discrepant views among team members” (Jehn & Bendersky, 2003, p. 189). The effective management of such conflicts is associated with several positive relational outcomes, such as higher team cohesion (Tekleab, et al., 2009) and mutual trust (Van de Vliert, Euwema, & Huismans, 1995).Further, Jehn (1997) found that in groups were conflicts are discussed in the open, members willingly discuss problems. Openly discussing problems in such a manner is useful for problem solving (De Dreu & van de Vliert, 1997; Jehn, 1995) and thus may help in finding possibilities for improvement, which is an important aspect of Lean. Further, conflict management may be an important antidote for groupthink (Chen, Liu, & Tjosvold, 2005), which we already identified as being harmful for Lean team performance (Van Dun and Wilderom, 2012). Therefore, we expect the following:
H5: Conflict management is positively related to Lean team performance.
14 teams (Kozlowski & Ilgen, 2006; Salas, et al., 2005). Further, Beale (2007) identified labor flexibility as a factor underlying employee willingness to adopt the Lean work approach.
Continuously adapting to a changing environment is the foundation of continuous improvement, which is the fifth Lean principle (Hines, et al., 2004). Therefore, we expect that adaptability contributes to the performance of effective Lean teams.
H6: Team adaptability is positively related to Lean team performance.
7. Team learning: For a team to be able to improve, it needs to acquire knowledge and information. The acquisition of knowledge and information has to do with team learning. Team learning represents a dynamic, ongoing process “of reflection and action, characterized by asking questions, seeking feedback, experimenting, reflecting on results, and discussing errors or unexpected outcomes of actions” (Edmondson, 1999, p. 353). Team learning is typically found in effective teams (Kozlowski & Ilgen, 2006, Edmondson, 1999; Edmondson et al., 2007; Van den Bossche, Gijselaers, Segers, & Kirschner, 2006). It is likely that this behavior is important in Lean teams as well, since CI is based on continuous learning processes that take place sequentially (Bartezzaghi, Mariano, & Verganti, 2004; Bessant, Caffyn, Gilbert, Harding, & Webb, 1994; Edmondson, 1999). Indeed, Caffyn (1999) and Aloini et al (2011) propose that in a CI setting, individuals learn from experiences and ensure this learning is incorporated into the organization.
15 8. Performance Monitoring: Performance monitoring –also labelled as ‘mutual performance monitoring’- entails actively keeping an eye on the activities and performance of other team members (Marks, Mathieu, & Zaccaro, 2001). Initially, performance monitoring was referred to as ‘team monitoring’, together with ‘feedback’ and ‘backup behavior’ (e.g., Marks, et al., 2001). However, more recent work has tended to treat performance monitoring, feedback and backup behavior as separate constructs (see, e.g., Marks & Panzer, 2004). Van Dun et al. (2011) suggested that effective Lean teams may be composed of members who maintain a high awareness of team functioning. Such awareness enables individuals to recognize inadequate performance or mistakes from team members (Bessant et al., 2001). Further, performance monitoring is likely to enable Lean team members to anticipate on events, or to find new areas for improvement. Therewith, we expect that performance monitoring contributes to Lean team performance.
H8: Performance monitoring is positively related to Lean team performance.
9. Feedback Behavior: By openly discussing work-related information, team members can address errors and lapses, and solving those may ultimately lead to higher team performance. Indeed, Aloini et al (2011) found that in a CI setting, people provide each other with positive feedback; they do not blame each other when something goes wrong, instead, they look for reasons why. Such feedback can lead to learning behavior and goal accomplishment (Kozlowski & Ilgen, 2006). As already discussed, we expect team learning to be essential for Lean team performance. Therefore, we propose the following:
16 10. Backup behavior: Backup behavior is defined as “the discretionary provision of resources and task-related effort to another member of one’s team that is intended to help that team member obtain the goals as defined by his or her role” (Porter et al., 2003, p. 391). The general consensus is that backup behavior, and similar concepts such as workload sharing and helping behavior (Podsakoff & MacKenzie, 1997), are positively correlated to team performance (Porter, et al., 2003). However, it has also been suggested that a large amount of backup behavior can be counterproductive as it masks underlying problems by only fixing symptoms (Bicheno & Holweg, 2009). Indeed, Barnes et al. (2008) found a high amount of back-up behavior to be negatively related to team performance. We therefore expect that in Lean teams, the relation between backup behavior and team performance is nonlinear: Backup behavior contributes to team performance, but only to a certain degree; if backup behavior is too high, the effect on performance is negative:
H10: An inverted U-relation exists between backup behavior and Lean team performance.
17 TQM culture practice, and found innovation outcomes improved significantly over the course of a TQM program.
We expect that teams which are oriented towards innovation increase their probability of finding innovative solutions to their operational problems, which likely contributes to higher Lean team performance. Therefore, we expect the following:
H11: Innovation is positively related to Lean team performance.
12. Information Sharing: A final behavioral dynamic that is considered to be a key characteristic of effective teams is information sharing (see, e.g., Bunderson & Boumgarden, 2010). Information sharing constitutes the process where individuals mutually exchange their (tacit and explicit) information in the support of their coordinating behaviors (adapted from De Vries, Van Den Hooff, & De Ridder, 2006; Kozlowski & Ilgen, 2006). Information sharing is an important precondition for team learning to occur, since the sharing of information exposes team members to a larger and richer pool of ideas and data (Argote, Gruenfeld, & Naquin, 1999). Already, Aloini et al (2011) found that in a CI setting, individuals and teams at all organizational levels share their learning experiences.
Closely related to this exposure is the expectation that information sharing leads to higher innovativeness (De Vries, et al., 2006), and avoidance of errors (Johnson, Hollenbeck, Humphreys, & Ilgen, 2006), all of which likely contribute to team performance. Van Dun and Wilderom (2012) suggested that information sharing contributes to Lean team performance as well: they argued that “intra-team sharing of work-related information […] may have a performance enhancing effect” (Van Dun & Wilderom, 2012, p. 128). Further, they argued information sharing enables team members to work to full capacity (Van Dun & Wilderom, 2012). Therefore, we propose the following:
18 In the next section, we elaborate how we tested the hypotheses on the affective, behavioral and cognitive dynamics with a newly designed survey instrument, mostly consisting of previously developed scales from team effectiveness literature.
Methodology
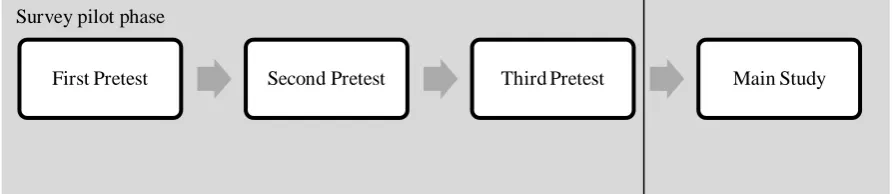
[image:18.595.70.517.541.638.2]In order to obtain a well-founded explication of affective, behavioral and cognitive dynamics of highly effective Lean teams, we developed an online survey. For this purpose, we performed three pretests (see Figure 2), for which we will now provide a short overview. The goal of the pretest rounds was to ensure that the used constructs and items were sufficiently valid and reliable to use in the main study. In every pretest round, we performed reliability analyses, and subsequently deleted or replaced redundant items or added items if necessary. After having developed an online survey, we used the survey in the main study to examine the Lean teams dynamics and their effects on Lean team performance. In the following section, we separately describe the sample, procedure and our data-analysis strategy for each of the four subsequent steps in the research process.
Figure 2
Research Rounds
Survey pilot phase
19
First Pretest
Below, the properties of the first pretest are discussed. First, we address the sample, followed by the procedure of data collection. Lastly, the measures from the first pretest are explicated.
Sample
We started with a widely distributed call for the (self-) nomination of effective Lean teams. We used an article on a major Dutch managerial website for this purpose and announced it in a management-executive journal as well as in various active Dutch (online and offline) networks for Lean managers. This resulted in about 30 teams, from which we selected five teams that met the following criteria: 1) The team implemented a continuous improvement strategy more than one year prior to this study; 2) The team continuously enhances their own work habits; 3) The team established stable growth in the following quantitative performance measures: employee satisfaction; customer satisfaction; and financial results. This pretest was an exploratory step, as we wanted to identify the behavioral dynamics in five high-performing Lean teams.
20 Table 1
Description of the Five Selected High-Performing Lean Teams
Type of
organization Main team task
Lean Maturity (in months)
Team size (incl. team leader)
Gender Employment
M F
Full-time
part-time
Truck Manufacturing Assembling trucks 147 11 89% 11% 67% 33%
Retail Manufacturing Assembling small
consumer products
87 6 89% 0% 100% 0%
Mail Distributor Sorting irregular
mail by hand
26 13 11% 89% 10% 90%
Health Insurance Handling claims of
private persons
19 36 36% 64% 68% 32%
Tax Administration Monitoring taxes 12 10 56% 44% 44% 56%
Procedure of data collection
The teams’ department head was asked if he and his team would like to participate. Next, we distributed a survey among the team members. The first page of the survey consisted of an introduction of the research, a statement ensuring anonymity of the results, and the duration for filling in the survey (20 minutes). After reading the first page, respondents could fill out the questionnaire. After filling in the survey, respondents handed us the survey.
Measures
21 Conflict management was measured using a four-item scale of Tekleab et al (2009, p. 198). A typical example of this scale is “Our team knows what to do when a conflict occurs between team members”.
Backup behavior was assessed using a six-item scale by Seers (1989, p. 125) (e.g. “Helps orient new people even though it is not required”).
Team learning was measured using a scale of Edmondson (1999, p. 383), consisting of 5items (e.g. “We regularly take our time to think of ways to improve the work process”).
We measured team leadership with the leader-member exchange scale by Graen and Uhl-Bien (1995, p. 237), consisting of seven items (e.g. “Our team leader understands our job problems and needs”).
Adaptability was assessed with a four-item scale of Angle and Perry (1981, p. 14) (e.g. “People in this team do a good job in keeping up with changes in new equipment and new ways of doing things”).
Information sharing was measured using a scale from De Vries et al (2006, p. 131), consisting of eight items (e.g. “When team members need certain knowledge they ask other team members for it”).
Team cohesion was measured using a five-item scale of Chin, Salisbury, Pearson, & Stollak (1999, p. 752) (e.g. “I see myself as part of this group”).
Team performance was measured with a four-item scale of Van den Bossche et al (2006, p. 507) (e.g. “We are satisfied with the performance of our team”).
Further, we assessed general Leanness, which is a self-designed output variable, consisting of three items (Van Dun, Van Eck, Van Vuuren, & Wilderom, 2011) (“How do you judge the level of continuous improvement within your team?”).
22 Woodard, Blaiwes, & Salas, 1986, p. 72) (e.g. “called attention to a mistake made by another member without being negative”). All constructs, except for ‘General Leanness’, were measured on a 7-point Likert scale, ranging from ‘strongly disagree’ (1) to ‘strongly agree’ (7). General Leanness was assessed using a five-point Likert scale, ranging from ‘strongly disagree’ (1) to ‘strongly agree’ (5). All items were randomized for each respondent, in order to prevent response set bias.
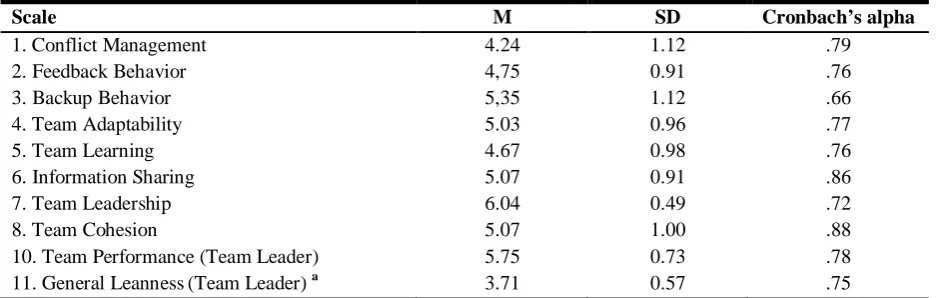
[image:22.595.65.538.421.570.2]Descriptive statistics (M and SD) and coefficient alphas for each variable are shown in Table 2. All scales were sufficiently reliable (α > 0.7). We further included questions about the respondent, including gender; age; team tenure; organization tenure; educational level; and job position.
Table 2
Results from the First Pretest Round
Scale M SD Cronbach’s alpha
1. Conflict Management 4.24 1.12 .79
2. Feedback Behavior 4,75 0.91 .76
3. Backup Behavior 5,35 1.12 .66
4. Team Adaptability 5.03 0.96 .77
5. Team Learning 4.67 0.98 .76
6. Information Sharing 5.07 0.91 .86
7. Team Leadership 6.04 0.49 .72
8. Team Cohesion 5.07 1.00 .88
10. Team Performance (Team Leader) 5.75 0.73 .78
11. General Leanness(Team Leader) a 3.71 0.57 .75
Note. Diagonal entries represent scale reliabilities. N = 5 Lean work teams, consisting of 55 team members and 5 team leaders.
a
General Leanness was measured on a 5-point scale.
Second Pretest
23 since we had newly identified this construct in the literature. Below, we will discuss the new sample and the adjustments made to the first survey version.
Sample
The second pretest was conducted amongst a work team in a major Dutch health-insurance company. The team was approached via Lean consultants of a management consulting firm specialized in Lean. The team consisted of 87 shop-floor employees, who worked with Lean for two months. All team members (response rate = 100%, N = 87) participated in the pretest. 20% of the respondents was male (80% female), and 46% worked full-time (54% part-time). On average, they worked in the team for 11.3 years (σ = 7.47), and in the organization for 21.4 years (σ = 9.60).
Procedure of data collection
The teams’ department head was asked if he and his team would like to participate. Next, team members were sent a link to an online survey by two Lean consultants. The first page of the survey consisted of an introduction of the research, a statement ensuring anonymity of the results, and the duration for filling in the survey (30 minutes). After reading the first page, respondents could fill in the survey. The pretest was conducted as part of a Lean implementation project by two Lean consultants. The two Lean consultants presented the results from the pretest to the participating team with a personal comparative feedback profile in terms of team dynamics.
Measures
24 five items from the ‘organizational citizenship behavior’ scale (Smith, Organ, & Near, 1983), which measures ‘altruism’. Next, we rephrased the following item from the ‘backup behavior’ scale (translated to Dutch) “Ons team is flexibel in het veranderen van werktaken, om het voor anderen makkelijker te maken” into “Teamleden zijn flexibel in het veranderen van werktaken, om het voor andere teamleden makkelijker te maken” to improve face validity. Since we had no scores from team leaders, we could not check alpha’s for team performance and general Leanness.
Further, we added a scale to measure ‘psychological safety’ (e.g. “If you make a mistake on this team, it is often held against you.”) (Edmondson, 1999, p. 382), as we had newly identified this construct in the literature and wanted to include the construct in the analysis.
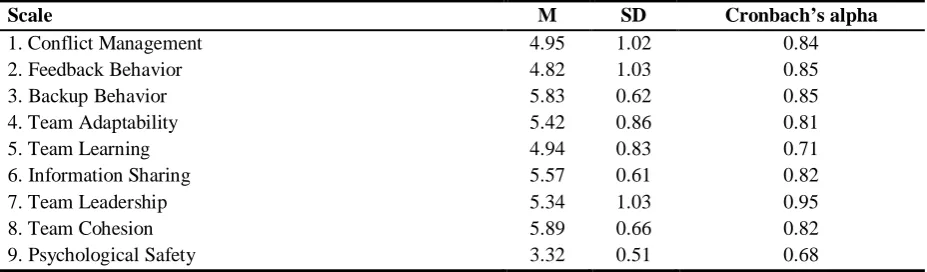
[image:24.595.67.531.534.670.2]Descriptive statistics (M and SD) and coefficient alphas for each variable are shown in Table 3. Apart from psychological safety, all scales were reliable (α > 0.7). Psychological safety had an alpha of .68, which we considered acceptable given the small sample.
Table 3
Results from the Second Pretest Round
Scale M SD Cronbach’s alpha
1. Conflict Management 4.95 1.02 0.84
2. Feedback Behavior 4.82 1.03 0.85
3. Backup Behavior 5.83 0.62 0.85
4. Team Adaptability 5.42 0.86 0.81
5. Team Learning 4.94 0.83 0.71
6. Information Sharing 5.57 0.61 0.82
7. Team Leadership 5.34 1.03 0.95
8. Team Cohesion 5.89 0.66 0.82
9. Psychological Safety 3.32 0.51 0.68
25
Third Pretest
On the basis of the second pretest, we again made some adjustments to the survey. First of all, we added a scale to measure performance monitoring. Further, we developed a new survey for the team’s department in order to avoid common method bias resulting from team members assessing their own performance. Finally, we retranslated the measures from English to Dutch following the translation/back-translation method (Brislin, 1970), since we wanted to ensure fundamental conceptions were retained in the first translation. Below, the adjustments to the second survey are discussed, as well as the new sample.
Sample
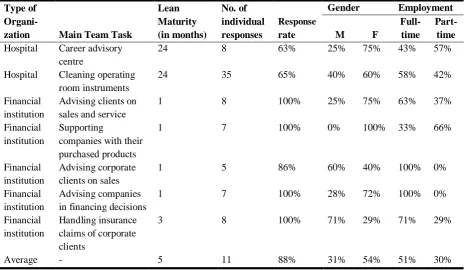
26 Table 4
Descriptions of the Seven Participating Lean Teams
Type of
Organi-zation Main Team Task
Lean Maturity (in months) No. of individual responses Response rate
Gender Employment
M F
Full-time
Part-time
Hospital Career advisory
centre
24 8 63% 25% 75% 43% 57%
Hospital Cleaning operating
room instruments
24 35 65% 40% 60% 58% 42%
Financial institution
Advising clients on sales and service
1 8 100% 25% 75% 63% 37%
Financial institution
Supporting
companies with their purchased products
1 7 100% 0% 100% 33% 66%
Financial institution
Advising corporate clients on sales
1 5 86% 60% 40% 100% 0%
Financial institution
Advising companies in financing decisions
1 7 100% 28% 72% 100% 0%
Financial institution
Handling insurance claims of corporate clients
3 8 100% 71% 29% 71% 29%
Average - 5 11 88% 31% 54% 51% 30%
Procedure of data collection
A link to the online survey was sent to the team leader or department head, who distributed the survey amongst the team members. In order to ensure response rates were high, the team leaders or department heads were asked to encourage team members to fill out the survey.
The first page of the survey consisted of an introduction of the research, a statement ensuring anonymity of the results, and the duration for filling in the survey (30 minutes). After reading the first page, respondents can fill in the survey.
27
Measures
The survey measures were largely comparable to pretest rounds one and two. However, on the basis of the second pretest, we made some further adjustments. First of all, we added a scale from De Jong & Elfring (2010, p. 549; based on Langfred, 2000) in order to measure performance monitoring (e.g. “In this team we check whether everyone is doing what is expected of him/her.”). As argued in our literature review, performance monitoring is recently regarded as being distinct from backup and feedback behavior (e.g.,Marks & Panzer, 2004), which is why we measure these three variables with separate scales. Further, we replaced the team cohesion scale of Chin et al. (1999) by a scale of task cohesion (e.g. “This team is united in trying to reach its goals for performance.” (Van den Bossche, et al., 2006, p. 505) and social cohesion (e.g. “We like our team”) (Van den Bossche, et al., 2006, p. 505). Finally, we rephrased three negatively formulated items of which respondents in previous rounds had pointed out they had trouble with understanding and answering them.
Moreover, we developed a new survey for the team’s department heads (see Appendix IV). Department heads’ were asked about the teams’ performance, customer satisfaction and general Leanness. This way, we were able to avoid common method bias resulting from team members assessing their own performance. Customer satisfaction was measured with a measure consisting of two items of Edmondson’s scale (Edmondson, 1999, p. 382) (e.g. “Those who receive or use the work this team does often have complaints about our work”) and two items from Wong and Tjosvold (2002, p. 104) (e.g. “The customer is satisfied with our response time”). Team performance was measured using a three-item scale adapted from Aubé and Rousseau (2005, p 204) (e.g. “This team is productive”). For general Leanness, we used the same three-item scale as in the team member survey.
28 conceptions were retained in the first translation. We therefore had an expert who was not involved in the study retranslate all scales from English to Dutch. Differences in both translations were examined and discussed. Then, the items were back-translated into the original language by a professional translator who was not involved in the study. Finally, we checked whether the back-translation matched the contents of the original items, which was the case.
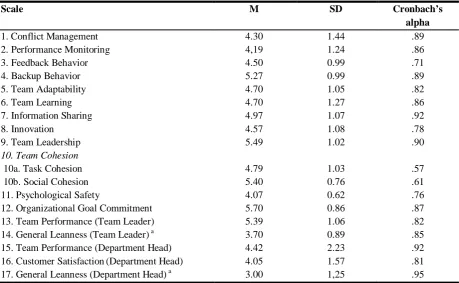
[image:28.595.70.530.429.712.2]Descriptive statistics (M and SD) and coefficient alphas for all variables are shown in Table 5. All scales were highly reliable (α > 0.7), with the exception of the newly added scales ‘social cohesion’ (α = .61) and ‘task cohesion’ (α = .57). Hence, apart from task cohesion and social cohesion, we were confident enough to use the scales in our main study.
Table 5
Results of the Third Pretest Round
Scale M SD Cronbach’s
alpha
1. Conflict Management 4.30 1.44 .89
2. Performance Monitoring 4,19 1.24 .86
3. Feedback Behavior 4.50 0.99 .71
4. Backup Behavior 5.27 0.99 .89
5. Team Adaptability 4.70 1.05 .82
6. Team Learning 4.70 1.27 .86
7. Information Sharing 4.97 1.07 .92
8. Innovation 4.57 1.08 .78
9. Team Leadership 5.49 1.02 .90
10. Team Cohesion
10a. Task Cohesion 4.79 1.03 .57
10b. Social Cohesion 5.40 0.76 .61
11. Psychological Safety 4.07 0.62 .76
12. Organizational Goal Commitment 5.70 0.86 .87
13. Team Performance (Team Leader) 5.39 1.06 .82
14. General Leanness (Team Leader) a 3.70 0.89 .85
15. Team Performance (Department Head) 4.42 2.23 .92
16. Customer Satisfaction(Department Head) 4.05 1.57 .81
17. General Leanness (Department Head) a 3.00 1,25 .95
Note. N = 7 Lean work teams, consisting of 67 team members and 11 team leaders.
a
29
Main Study
Below, we will consecutively address the sample, procedure, instrumentation and data analysis of our main study.
Sample
The main study was conducted amongst members of 31 shop-floor teams with differing Lean experience (ranging from 1 to 120 months, 28.41 months on average). These teams had not yet participated in our pretests. From the team members (N = 504, including team leaders), 59% was male (41% female) and 70% worked fulltime (30% part-time). On average, they worked for 5.70 years in the team (σ = 6.25) and 13.50 years in the organization (σ =11.06). The 31 teams covered a diverse set of 15 organizations, active in the public sector, production firms and commercial firms. The average response rate was 84%. Non-response bias was partially controlled for by asking team leaders and their department heads afterwards, in a face-to-face feedback session, whether they suspected non-response had resulted from differences in certain opinions or other characteristics between team members. This was not the case. A full overview of the participating teams can be found in Appendix II.
Procedure of data collection
30
Instrumentation
After extensive testing and fine-tuning of the online survey in three pretest rounds, we were confident that the survey was an appropriate instrument to measure Lean team dynamics. On the basis of the third pretest, however, we made a final adjustment to the survey: The ‘task cohesion’ and ‘social cohesion’ measures that were added in the third pretest were replaced by the ‘team cohesion’ measure used in the first and second pretest, since both the ‘task cohesion’ (α = .57) and ‘social cohesion’ (α = .61) scales proved unreliable. The final survey instrument can be found in Appendix III.
31 Table 6
Reliabilities, Means and Standard Deviations per Construct of the Main Study
a
We calculated Pearsons correlation as the ‘general Leanness’ scales consisted of two items only.
Analysis
All independent variables were measured at the individual level. Nevertheless, since the hypotheses were formulated at the team level, individual ratings on the variables need to be aggregated to the team level. Further, all variables were directed to the team level via the referent-shift consensus composition. In order to check whether data aggregation was justified, we assessed agreement among scores from team members. James (1982) suggested agreement can be assessed measuring two intraclass correlation coefficients (ICCs): ICC (1) and ICC (2). ICC (1) indicates the extent of agreement among ratings from members of the same team, whilst ICC (2) indicates whether teams can be differentiated on the variables of interest (James, 1982). An acceptable range for ICC (1) values is between .00 and .50 (Bliese, 2000). ICC (2) values equal to or higher than .50 are satisfactory, equal to or larger than .70 are good (Klein et al., 2000). Based on the aggregated scores, partial correlations between the variables were measured. Next, a regression analysis is conducted in order to examine the
Scale M SD Cronbach’s alpha
1. Conflict Management 4.63 1.16 .87
2. Performance Monitoring 4.60 1.16 .90
3. Feedback Behavior 4.93 .97 .80
4. Backup Behavior 5.53 .87 .89
5. Team Adaptability 5.25 .93 .82
6. Team Learning 4.97 1.00 .81
7. Information Sharing 5.36 .84 .90
8. Innovation 5.04 .94 .71
9. Team Leadership 5.49 1.03 .93
10. Team Cohesion 5.50 .85 .83
11. Psychological Safety 5.24 .91 .69
12. Organizational Goal Commitment 5.65 1.01 .92
13. Team Performance, Department Head 5.13 1.04 .73
14. Customer Satisfaction , Department Head 5.16 .74 .73
15. General Leanness, Department Head a 3.30 1.05 .77a
16. Team Performance , Team Leader 5.58 .97 .67
32 relation between the independent variables and Lean team performance. Further, we checked for the relation of the variables of interest with the following control variables: Years of working with Lean, educational level, male/female ratio and team size. In order to prevent common method bias, we measured the relation between team members’ scores on team dynamics; whilst the output variables were assessed by the department heads and team leaders’ scores. Next, we tested for curvilinear relations for main effects of team cohesion on Lean team performance outcomes by including the quadratic term in the regression equation. Finally, we conducted a stepwise regression analysis to examine the hypothesized relations at the individual level, together with questions about the respondent.
Results
In this chapter, the research questions are addressed, as well as the psychometric qua lities of the survey. We begin with reporting the ICC (1) and ICC (2) values for the constructs. Then, normality assumptions for the scales are checked. Next, our hypotheses are tested by respectively performing correlation and regression analysis. Finally, a stepwise regression analysis will be conducted to explore the data at the individual level.
Inter-team member agreement
33 test hypotheses 6 (Team adaptability is positively related to Lean team performance) and 10 (An inverted U-relation exists between backup behavior and Lean team performance) (see Table 9).
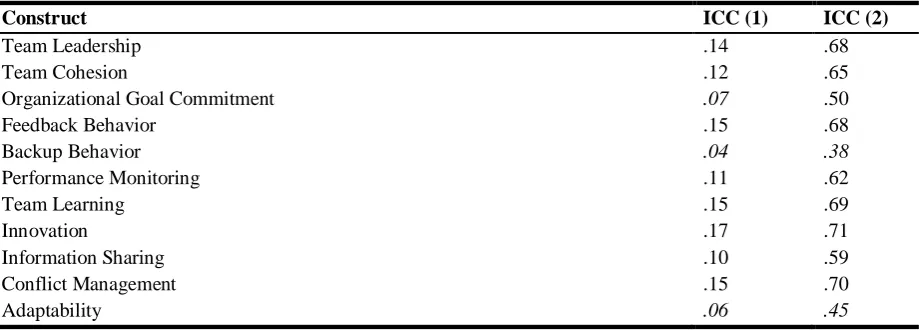
Table 7 ICC Values
Construct ICC (1) ICC (2)
Team Leadership .14 .68
Team Cohesion .12 .65
Organizational Goal Commitment .07 .50
Feedback Behavior .15 .68
Backup Behavior .04 .38
Performance Monitoring .11 .62
Team Learning .15 .69
Innovation .17 .71
Information Sharing .10 .59
Conflict Management .15 .70
Adaptability .06 .45
Note. N = 462. ICC (1) determines the level of agreement among ratings from team members within the same
team. ICC (2) estimates the reliability of mean differences across teams (between group variance).
Checking normality assumptions
All scales were normally distributed, with skewness and kurtosis ranging between -2.00 and 2.00). Hence, no scales were discarded.
Correlation Analysis
34 However, several of the independent variables are significantly positively correlated (see Table 8). Team leadership positively correlates with team cohesion (r = .70, p < .05).
Team cohesion positively correlates with organizational goal commitment (r = .61, p < .01), innovation (r = .65, p<.01), information sharing (r = .48, p<.05), conflict management (r = .78, p<.01). Organizational goal commitment positively correlates with team cohesion (r = .58, p<.01), organizational goal commitment (r = .51, p<.05), information sharing (r = .51, p<.05), and conflict management (r = .78, p<.01). Feedback behavior positively correlates with team leadership (r = .61, p<.01), organizational goal commitment (r = .79, p<.01), performance monitoring (r = .65, p<.01), team learning (r = .48, p<.05), organizational goal commitment (r = .48, p<.05), innovation (r = .46, p<.05), information sharing (r = .49, p<.05), and conflict management (r = .69, p<.01).
35 Table 8
Means, Standard Deviations, and Correlations, Based on Aggregated Data
Notes. Diagonal entries represent scale reliabilities (Cronbach’s alphas). N = 31 Lean work teams.
Correlations were significant (2 tailed) at the following levels: *p < .05; **p < .01.
a
General Leanness was measured on a 5-point scale: all the other non-control variables were assessed on a 7-point scale.
b
We calculated Pearsons correlation as the ‘general Leanness’ scale consisted of two items only.
M SD 1 2 3 4 5 6 7 8 9 10 11 12 13 14 15 16 17
1. Team Leadership 5.48 .46 (.93)
2. Team Cohesion 5.49 .44 .70** (.83)
3. Org. Goal Commitment 5.66 .41 .61** .58** (.92)
4. Feedback Behavior 4.91 .50 .74** .50* .79** (.80)
5. Performance Monitoring 4.61 .60 .42 .18 .47 .65** (.91)
6. Team Learning 5.02 .54 .34 .40 .48* .48* .09 (.81)
7. Innovation 5.08 .52 .40 .65** .51* .46* -.07 .80** (.71)
8. Information Sharing 5.41 .37 .30 .48* .51* .49* .17 .74** .78** (.90)
9. Conflict Management 4.67 .62 .73** .78** .78** .69** .25 .47* .64** .46* (.87)
10.General Leanness
(Dep. Heads’ Score)a 3.37 .97 .17 .26 .00 -.05 .01 .12 .08 .03 .10 (.77)
11.Customer Satisfaction
(Dep. Heads’ Score) 5.07 .77 .13 .13 .13 .27 .18 .37 .29 .14 .13 .31 (.73)
12.Team Performance
(Dep. Heads’ Score) 5.17 .97 .06 .18 .02 .01 .02 .28 .20 .13 -.06 .64** .59** (.73)
13.General Leanness
(Team Leaders’ Score) a 3.51 .60 .13 .11 .36 .19 .26 .28 .18 .00 .23 .45* .45* .36 (.54)
b
14.Educational Level 15.00 9.55 .00 .09 -.19 -.36 -.18 .09 -.03 -.03 -.10 .25 -.22 .05 -.16
-15.Male/Female Ratio .60 .30 .33 .23 .32 .36 .22 -.07 .04 -.04 .53* .14 .21 -.15 .12 -.28
-16.Team Size 2.30 .46 .15 -.25 .08 .18 .11 -.34 -.35 -.40 -.09 -.11 .26 -.06 -.08 -.32 .31
-36
Curvilinear relationships
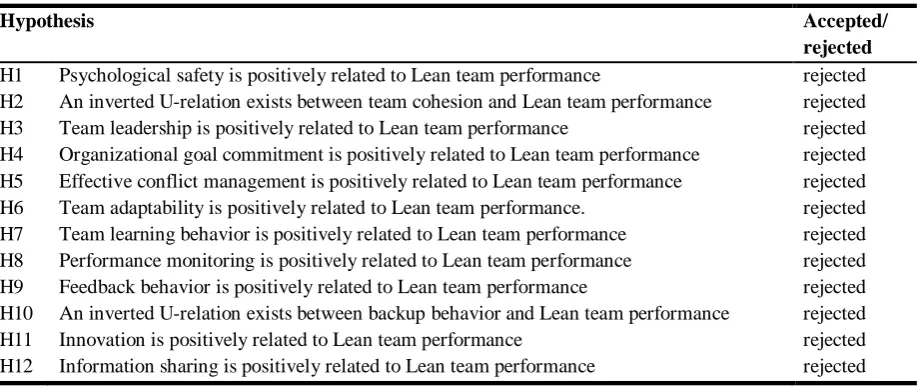
[image:36.595.71.531.338.531.2]Apart from the expected linear relations, we expected an inverted U-relation between team cohesion and Lean team performance outcomes. We tested for curvilinear relations between team cohesion on the outcome variables team performance (department heads’ score), customer satisfaction (department heads’ score), general Leanness (department heads’ score) and general Leanness (team leaders’ score). However, we found no evidence of a relation between team cohesion and team performance outcomes. Hence, hypothesis 2 is rejected.
Table 9
Overview of the Accepted and Rejected Hypotheses
Hypothesis Accepted/
rejected
H1 Psychological safety is positively related to Lean team performance rejected
H2 An inverted U-relation exists between team cohesion and Lean team performance rejected
H3 Team leadership is positively related to Lean team performance rejected
H4 Organizational goal commitment is positively related to Lean team performance rejected
H5 Effective conflict management is positively related to Lean team performance rejected
H6 Team adaptability is positively related to Lean team performance. rejected
H7 Team learning behavior is positively related to Lean team performance rejected
H8 Performance monitoring is positively related to Lean team performance rejected
H9 Feedback behavior is positively related to Lean team performance rejected
H10 An inverted U-relation exists between backup behavior and Lean team performance rejected
H11 Innovation is positively related to Lean team performance rejected
H12 Information sharing is positively related to Lean team performance rejected
Individual-Level Data Exploration
Since no significant team-level correlations were found between the independent and the dependent variables, we decided to further explore the data at the individual level: by examining the main variables and their relations with Lean team performance outcomes, together with questions about the respondent.
37 Leanness was predicted by innovation (R2adj = .02, F(1,308) = 6.18, p=.01) (β = .14, t(308) = 2.49, p =.01, see Table 13). However, the effect size is small (Cohen & Cohen, 1988). Further, we found two control variables to be predictive of Lean team performance outcomes: the number of months working with Lean and educational level. The number of months working with Lean was predictive of department heads’ scores on teams’ general Leanness (R2adj = .05, F(3,303) = 5.78, p <.0 1) (β = .15, t(303) = 2.62, p <.01, see Table 12), team performance (R2adj = .12, F(1,303) = 40.76, p<.01, see Table 10) (β = .35, t(303) = 6.38, p <.01), and customer satisfaction (R2adj = .03, F(1,303) = 9.20, p <.01) (β = .17, t(303) = 3.03, p <.01, see Table 11). Further, educational level was predictive of department heads’ scores on general Leanness (R2adj = .05, F(3,303) = 5.78, p <.01) (β = .15, t(303) = 2.68, p <.01, see Table 12). However, effect sizes are again small, ranging from .02 to .05 (Cohen & Cohen, 1988). Only the relation between the number of months working with Lean and team performance demonstrated a medium effect size (Cohen & Cohen, 1988).
We also looked at the hypothesized curvilinear relations between backup behavior and team cohesion on Lean team performance outcomes at the individual level. However, the relations were unsignificant.
Table 10
Summary of Stepwise Regression Analysis for Variables Predicting Department Heads’ Score of Team performance (N = 303)
Variable B SE B β
Step 1
Months with Lean .35 .01 .35*
[image:37.595.64.533.624.669.2]38 Table 11
Summary of Stepwise Regression Analysis for Variables Predicting Department Heads’ Score of Customer Satisfaction (N = 303)
Variable B SE B β
Step 1
Months with Lean .00 .00 .17*
[image:38.595.67.531.334.483.2]Note. R2 = .03 for Step 1 (ps < .05). *p < .05.
Table 12
Summary of Stepwise Regression Analysis for Variables Predicting Department Heads’ Score of General Leanness (N = 303)
Variable B SE B β
Step 1
Months with Lean .00 .00 .13*
Step 2
Months with Lean .01 .00 .15*
Educational Level .20 .08 .14*
Step 3
Months with Lean .01 .00 .15*
Educational Level .21 .08 .15*
Team Cohesion .16 .07 .13*
Note. R2 = .01 for Step 1; ∆R2 = .02 for Step 2; ∆R2 = .02 for Step 2 (ps < .05). *p < .05.
Table 13
Summary of Stepwise Regression Analysis for Variables Predicting Team Leaders’ score on General Leanness (N = 308)
Variable B SE B β
Step 1
Innovation .07 .14 .14*
[image:38.595.66.528.611.657.2]39
Discussion
In this study, we explored the affective, cognitive and behavioral dynamics within shop-floor Lean teams in relation to their performance. From the individual-level results, it appears that team cohesion and innovation are positively related to shop-floor Lean team performance. On the team level, we found no team dynamics contributing to Lean team performance. Below, we will first discuss why we found no evidence at the team level for the hypothesized relations between the team dynamics identified in our study and Lean team performance outcomes. Then, we will address the found individual-level relations between team dynamics and Lean team performance outcomes.
Team-Level Relations between Team Dynamics and Lean Team Performance Outcomes
40 for the high intercorrelations would be that the variables in fact are conceptually related. This would make further research warranted into the uniqueness of each of the team dynamics.
A second explanation for the lack of team-level results stems from our aggregation of the data. Although we aggregated the data, ICC (2) values for conflict management, performance monitoring, feedback behavior, team learning and innovation, team leadership and information sharing and adaptability were moderate. The moderate ICC (2) scores means the correlation between team-level variables is weakened, thereby hindering the detection of team-level relations (Klein, et al., 2000).
The absence of team-level relations might further be caused by a loss of statistical power due to data aggregation in general: Our initial sample of 431 individual responses was aggregated to a much smaller sample of 31 shop-floor teams. Hence, we would welcome larger scale studies into the self-reported Lean team dynamics.
Individual-Level Explorative Results
For the individual-level analysis, we looked at the hypothesized relations with Lean team performance outcomes, as well as relations with control variables. From this analysis, some interesting findings were distilled. First of all, we hypothesized an inverted-U relation of team cohesion with Lean team performance. We expected high levels of team cohesion to be detrimental to Lean team performance, as it can cause groupthink (Tekleab, et al., 2009; Van Dun and Wilderom, 2012). However, at the individual level we solely found evidence for a linear relation between team cohesion and department heads’ score of general Leanness. This linear relation suggests high cohesion levels do not necessarily lead to groupthink.
41 Leanness. This relation is likely to originate from the fact that CI efforts in a Lean team lead to a high level of change orientation in terms of both CI and innovation (Van Dun and Wilderom; 2012; Bessant, et al., 2001).
The control variable ‘number of months working with Lean’ was predictive of department heads’ scores on teams’ general Leanness, team performance and customer satisfaction. This relation sounds logical; a team which works with Lean for a longer period of time is likely to have more Lean experience (Gertsen, 2001). This experience is expected to lead to higher performance by making a greater contribution of Lean to performance (Gertsen, 2001). Further, one principle of Lean is identification of customer value (Hines, et al., 2004). Since teams which work with Lean for a longer period of time have more experience with Lean, they are likely to have a clearer image of customers’ needs, which makes it easier to satisfy customers.
42 point is the fact that in mature Lean teams, individuals “seek out opportunities for learning / personal development” (Bessant, et al., 2001, p. 73). A follow-up study might test this proposed relation between training and Lean team performance.
Limitations
Despite the strengths of some aspects of this study (no common method bias, objective department head scores on team performance, established validity for all measures), the present study also has a number of limitations, which are discussed below.
The 31 teams participating in our study differed in their Lean maturity; however, they all worked with Lean principles, which means they had decided to commit themselves to Lean. This similarity between the teams might give rise to a restriction of range bias. Such bias might have caused a low variability in our data, which makes it harder to detect causal relations between the input and outcome variables (Anastasi, 1976). Therefore, we recommend that in future research, non-Lean teams are studied as well.
43 team-specific outcomes to the team leaders and department heads, and asked them to what extent they thought the survey findings reflected their day-to-day team dynamics. Their positive responses illustrate the ecological or practical validity of our survey instrument. However, in further research, one could further control for this self-awareness bias by adding other scales or research methods to the current survey such as systematic team observation. This would provide a richer dataset on which firmer conclusions can be made.
Another limitation concerns the fact that each organization applies their own bundle of Lean tools (Shah & Ward, 2003). We did not explicitly examine the used tools in each team, whilst perhaps each tool has different effects on Lean team dynamics. However, whilst Lean tools might not be applicable to each context, the principles of Lean are universal and can be applied to many disciplines (Radnor, Walley, Stephens, & Bucci, 2006 ). We therefore assume that creating a Lean culture requires the same team dynamics across industries. However, a follow-up study might want to test this assumption, by controlling for the set of specific Lean tools that had been applied by the focal shop-floor Lean teams.
Our study was of cross-sectional nature. Therefore, we were unable to view how patterns of affective and cognitive states and behavioral dynamics develop over time. Thus, it would be worthwhile to examine the Lean team dynamics in a longitudinal design in order to gain a deeper understanding of them.
44
Future research suggestions
From the discussion and limitations of our study, we already addressed a number of avenues for future research. Below, some additional research directions are included that are unrelated to our discussion and limitations.
In this study, we solely applied team dynamics, or the mediating variables of the IMOI model of team effectiveness to a Lean team setting (Ilgen, et al., 2005). However, in future research it would be interesting to examine the effects of input variables on Lean team performance as well, as these inputs are suggested to greatly affect a Lean team’s dynamics (Van Dun and Wilderom, 2012). Input variables that are proposed to be important in a Lean team setting concern higher-level leader support, structural and strategic clarity, human resource policy and resource abundance (see Van Dun and Wilderom, 2012).
Another interesting future research path concerns taking a multilevel approach to testing our hypotheses. Already, we looked at both the individual and team level. However, a multilevel approach would allow for the simultaneous examination of group-level and individual-level factors. For a further reading on multilevel analysis, we refer to Hox and Kreft (1994), Snijders and Bosker (1999), and Kozlowski and Klein (2000).
Finally, our study was conducted in the Netherlands. However, cultural differences are found to be important determinants of behavior (Baum et al., 1993). Therefore, it would be interesting to compare our findings with those from culturally diverse contexts, so as to generate a more general perspective on Lean team dynamics.
Conclusion
45 determining the team dynamics that are important for successful implementation and sustaining of Lean. Whilst our team-level assessment did not lead to any significant relations between the team dynamics and Lean team performance outcomes, we did find some interesting results at the individual level. At this level, it appeared that both team cohesion and innovation significantly contribute to Lean team performance, as well as educational level and the number of months working with Lean.
By integrating Lean theory with the much more established team effectiveness theory, we paved the path for further advancing the Lean team research area. Further, the self-assessment survey and the insights from testing the hypotheses at the individual-level may enrich existing Lean maturity models and self-assessment tools (see e.g., Aloini, et al., 2011; Beale, 2007; Bessant, et al., 2001; Boer, Berger, Chapman, & Gertsen, 2000; Caffyn, 1999; Jørgensen, Boer, & Gertsen, 2003). However, we welcome larger, quantitative, hypotheses-testing studies for exploring team dynamics important for Lean team success. This could be done by means of subjective self-report measures, combined with objective research approaches such as video-analysis or workplace observations. Such a combination would provide richer data on which more solid conclusions could be made.
Practical implications
Our best practice orientation towards the affective, behavioral and cognitive dynamics of effective Lean teams may help both Lean managers and consultants in creating an effective Lean team culture. We discovered that innovation and team cohesion are likely to contribute to Lean team performance, as well as a higher educational level and the number of months working with Lean. Below, the practical implications of these findings are discussed.
46 are dealt with in a productive manner. Previous team-effectiveness research provides guidance for creating such a culture. First of all, teams that open-mindedly discuss their work-related opinions and that are committed to cooperative goals are better capable to constructively handle conflicts (Tjosvold & Tjosvold, 1995). Training of Lean team members may also help in developing cooperative conflict management skills. For instance, such training may include communicating the differences between constructive and destructive conflict management, providing guidelines for recognizing destructive conflict spirals, and openly acknowledging issues (Shaw, Zhu, Duffy, Scott, Shih & Susanto, 2011).
We further found a positive relation between innovation and Lean team performance. In team effectiveness literature, several recommendations can be found regarding the stimulation of team innovation. We expect these recommendations apply to Lean teams as well. First of all, team initiative and experimentation should be rewarded (Vera & Crossan, 2004). Further, managers can influence team improvisation by establishing boundaries and minimal constraints within which team members are free to experiment and take risks (Vera & Crossan, 2004). Lastly, managers and Lean consultants should initiate or encourage the regular reflection on the team’s objectives, strategies, and processes in order to create a “team-level intellectual product that initiates change” (Drach-Zahavy & Somech, 2001, p. 121).
47 one can -if possible- best hire a higher-educated person, since this is likely to improve Lean team performance.
48
References
Aloini, D., Martini, M., & Pellegrini, L. (2011). A structural equation model for continuous improvement: a test for capabilities, tools and performance. Production Planning & Control, 22(7), 628-648.
Andersson, R., Eriksson, H., & Torstensson, H. (2006). Similarities and differences between TQM, six sigma and lean. The TQM Magazine, 18(3), 282-296.
Angle, H., & Perry, J. (1981). An empirical assessment of organizational commitment and organizational effectiveness. Administrative Science Quarterly, 26, 1-14.
Argote, L., Gruenfeld, D., & Naquin, C. (1999). Group Learning in Organizations. In Turner (Ed.), Groups at Work: Advances in Theory and Research. Hillsdale: Lawrence Erlbaum.
Arnold, J. A., Arad, S., Rhoades, J. A., & Drasgow, F. (2000). The empowering leadership questionnaire: the construction and validation of a new scale for measuring leader behaviors. Journal of Organizational Behavior, 21, 249-269.
Aubé, C., & Rousseau, V. (2005). Team Goal Commitment and Team Effectiveness: The Role of Task Interdependence and Supportive Behaviors. Group Dynamics: Theory, Research, and Practice, 9(3), 189-204.
Ballé, M. (2005). Lean attitude. Manufacturing engineer, 84(2), 14-19.
Baregheh, A., Rowley, J., & Sambrook, S. (2009). Towards a multidisciplinary definition of innovation. Management Decision, 47(8), 1323 - 1339.
Barnes, C. M., Hollenbeck, J. R., Wagner, D. T., DeRue, D. S., Nahrgang, J. D., & Schwind, K. M. (2008). Harmful help: The costs of backing-up behavior in teams. Journal of Applied Psychology, 93(3), 529-539.
Bartezzaghi, E., Mariano, C., & Verganti, R. (2004). Continuous improvement and inter-project learning in new product development International Journal of Technology Management, 14(1), 116-138.
Beal, D. J., Cohen, R. R., Burke, M. J., & McLendon, C. L. (2003). Cohesion and
performance in groups: A meta-analytic clarification of construct relations. Journal of Applied Psychology, 88, 989-1004.
Beale, J. (2007). Employee motivation to adopt Lean behaviours: Individual-level
antecedents. Paper presented at the Production and Operations Management Society 18th Annual Conference, Dallas, Texas U.S.A.
49 Bessant, J., & Caffyn, S. (1997). High-involvement innovation through continuous
improvement. International Journal of Technology Management, 14(1), 7-28. Bessant, J., Caffyn, S., & Gallagher, M. (2001). An evolutionary model of continuous
improvement behaviour. Technovation, 21(2), 67-77.
Bessant, J., Caffyn, S., Gilbert, J., Harding, R., & Webb, S. (1994). Rediscovering Continuous Improvement. Technovation, 14(1), 17-29.
Bhasin, S., & Burcher, P. (2006). Lean viewed as a philosophy. Journal of Manufacturing Technology Management, 17(1), 56-72.
Bicheno, J., & Holweg, M. (2009). The Lean toolbox: The essential guide to Lean transformation (4th ed.). Buckingham: PICSIE Books.
Bliese, P. D. (2000). Within-group agreement, non- independence, and reliability:
Implications for data aggregation and analysis. In K. J. Klein & S. W. J. Kozlowski (Eds.), Multilevel theory, research and methods in organizations: Foundations, extensions and new directions. (pp. 349- 381). San Francisco: Jossey-Bass.
Boer, H., Berger, A., Chapman, R., & Gertsen, F. (2000). CI changes: From suggestion box to organisational learning : Continuous improvement in Europe and Australia.
Aldershot: Ashgate Publishing.
Boer, H., & Gertsen, F. (2003). From continuous improvement to continuous innovation: a (retro)(per)spective. International Journal of Technology Management, 26(8), 805-827.
Bresó, I., Gracia, F. J., Latorre, F., & Peiró, J. M. (2008). Development and validation of the Team Learning Questionnaire. Comportamento Organizacional e gestao, 14(2), 145-160.
Brislin, R. W. (1970). Back-translation for cross-cultural research. Journal of Cross-cultural Psychology, 1, 185-216.
Bunderson, J. S., & Boumgarden, P. (2010). Structure and learning in self-managed teams: Why "bureaucratic" teams can be better learners. Organization Science, 21(3), 609-624.
Caffyn, S. (1999). Development of a continuous improvement self-assessment tool.
International Journal of Operations & Production Management, 19(11), 1138-1153. Carron, A. V., Colman, M. M., Wheeler, J., & Stevens, D. (2002). Cohesion and performance
in sport: A meta analysis. Journal of Sport and Exercise Psychology, 24, 168-188. Carter, S. M., & West, M. A. (1998). Reflexivity, effectiveness and mental health in BBC