The Calibration and Optimisation of
Speed-Dependent Automatic Zooming
November 2003
Andrew Wallace
Department of Computer Science and Software Engineering
University of Canterbury, Christchurch, New Zealand
Abstract
Speed Dependent Automatic Zooming (SDAZ) has already been shown to be an effective navi-gation technique for document browsing. We investigate here three further aspects of SDAZ. We begin with an analysis of the existing methods of document navigation. We present a taxonomy of document navigation goals and examine how these goals are supported by the current naviga-tion techniques. Our focus here is on how SDAZ fits in with existing techniques and how it can assist in the support of these different goals. Our second area of investigation, which is the main focus of this work, is on the issues surrounding the calibration of SDAZ systems. The extent of the difficulty of obtaining an optimal system has not been made clear in the previous literature. We discuss in detail the implementation and fine-tuning issues surrounding SDAZ systems, with a view to obtaining an optimal implementation. Finally, using our SDAZ system we perform a small formal evaluation comparing SDAZ to rate-based scrolling. SDAZ is a modified rate-based system, and our evaluation shows it is superior to a standard rate-based system, and therefore proves that the modifications are worthwhile.
Acknowledgements
Contents
1 Introduction 3
2 Related Work 5
2.1 Previous Work on SDAZ . . . 5
2.2 Orders of Control . . . 6
2.3 Fitts’ Law . . . 6
2.4 Physiological Analyses . . . 7
3 Document Navigation: Goals and Support Mechanisms 9 3.1 Our Classification of Document Navigation . . . 9
3.2 The Place of Current Methods within this Classification . . . 10
3.3 The Place of SDAZ within this Classification . . . 11
3.4 Using SDAZ with Complementary Methods . . . 11
4 Calibrating SDAZ 13 4.1 Control Equations and Constants . . . 13
4.1.1 The Threshold Constant . . . 14
4.1.2 Zoom Formula . . . 15
4.1.3 Falling Rate . . . 20
4.1.4 The Hunting Effect . . . 20
4.1.5 Three Unevaluated Ideas . . . 21
4.2 Human-System Interaction . . . 22
4.2.1 Zoom Location . . . 22
4.2.2 Speed Indication . . . 25
4.2.3 Mouse Buttons . . . 26
4.3 Final Settings . . . 27
5 Formal Evaluation 28 5.1 Goals . . . 28
5.2 Participants and Apparatus . . . 29
5.3 User Tasks . . . 29
6 Results and Discussion 31 6.1 Fitts’ Law Models of the Systems . . . 31
6.2 SDAZ vs Rate-Based . . . 33
6.3 The Accuracy of the Earlier Calibration . . . 34
6.4 The Use of Modal vs Dragging mouse interaction . . . 34
6.5 The Effects of Previous Experience . . . 35
6.6 The IoD tested on both documents . . . 36
Chapter 1
Introduction
Scrolling is one of the most common tasks performed when writing, editing or browsing a document. As it is done so often, even a small improvement results in a significant overall saving in time. Hence, if it is not optimised, a large amount of time and money is being wasted on the mundane task of scrolling. This provides a strong motivation to ensure that the methods we are using are indeed the best. In a study of five hours of web use, Byrne, John, Wehrle & Crow (1999) observed that users spent 40 minutes scrolling. They commented that “An obvious case where widget design could make a difference is scrolling.”
The traditional techniques used in document navigation are panning, a scrollbar, and keyboard based scrolling. Modern Windows operating systems have standardised the concept of a new type of scrolling system: rate-based scrolling. In Windows XP, pressing the middle mouse button inside a window that has a scrollbar invokes rate-based scrolling. It has therefore become important to understand how rate-based scrolling complements the existing scroll techniques, and how to optimise rate-based systems.
Rate-based scrolling is an alternative approach where the displacement of the mouse from the point where scrolling began is mapped to the speed of scrolling. Thus, the further the mouse is moved when in scrolling mode, the faster the document scrolls. This method successfully provides smooth scrolling within large documents. However, rate-based scrolling suffers from a limitation on its speed. Attempting to scroll very rapidly means that the information becomes blurred. This imposes a relatively low maximum limit on the speed of scrolling.
A solution to this problem which attempts to retain all the advantages of the rate-based system is Speed Dependent Automatic Zooming (SDAZ). The concept of SDAZ was first investigated by Igarashi & Hinckley (2000) who suggested that the system invoke an automatic zoom-out once the scrolling speed exceeded a predefined velocity. The zoom-out reduces the problem of blurring as the document may be scrolled more rapidly without the information moving across the screen as quickly. SDAZ thus retains the advantages of rate-based scrolling while removing the problems associated with rapid scrolling, hence allowing the rapid acquisition of targets that are a great distance away.
The major difficultly surrounding SDAZ is its calibration. Implementing an SDAZ system requires the developer to make a number of non-trivial decisions regarding the functioning of the system. We had initially thought to compare SDAZ to other forms of scrolling, but were immediately plagued with the problem of calibration — the difficultly of which had not been clearly stated in the previous literature.
Fitts’ Law (Fitts 1954) has been a well recognised formula for modelling the acquisition of visible targets in computer interfaces since the work of MacKenzie (1991). However, Hinckley et al. proposed that this model could be extended to model scrolling — where the targets being acquired are not initially visible. They believe that the Fitts’ Law parameters of distance and tolerance are suitable for being used to provide experimenters with a practical method to quantify scrolling techniques. We have adopted their paradigm for our formal evaluation of SDAZ.
Chapter 2
Related Work
The related work done on this topic falls into four main categories:
• Previous work on SDAZ.
• Orders of Control
• Fitts’ Law studies.
• Physiological analysis.
2.1
Previous Work on SDAZ
Igarashi & Hinckley (2000) identified the problem of disorientation caused by rapid scrolling, and proposed Speed-Dependent Automatic Zooming (SDAZ) as an attempt to solve this. An SDAZ system couples an automatic zoom control with scrolling in such a way that when the user scrolls rapidly, the system automatically zooms-out to reduce blurring. Igarashi & Hinckley created several applications that used SDAZ to scroll: a web browser, a map browser, a sound editor, an image viewer, and a dictionary viewer. They concluded that the sound editor, image viewer and dictionary viewer were unsuccessful and not worth pursuing further as applications for SDAZ because SDAZ did not appear appropriate for applications of that nature. However, they believed that the web browser and map browser were worth further investigation — though their informal preliminary evaluation of the systems showed no significant difference between SDAZ and scrollbars.
The idea that there are potential gains to be made by coupling zooming and scrolling has already been validated by Fisheye systems. Gutwin & Skopik compared performance of three types of Fisheye systems with two normal scrolling systems at path following, and found the performance of the Fisheye systems to be significantly better. This shows that there are potential gains to be made by coupling the concepts of scrolling and zooming.
Cockburn & Savage (2003) picked up on the ideas of Igarashi & Hinckley and performed a more formal evaluation of SDAZ and scrollbars on a document browser and a map browser. They found SDAZ to be a 22% faster on the document browsing tasks, which involved the locating of pictures and headings. On the map browsing task they found that participants were 43% faster using SDAZ to locate targets. Their analysis of user preferences also indicated that participants preferred the SDAZ system to the standard scrollbar system.
maximum scroll rate at full magnification was probably somewhere between 1.5 and 2.7 pages per second, with the optimum likely being much closer to 1.5. We also investigated our theory that in SDAZ systems the magnification could be altered automatically in such a way as to always keep information on the screen for a fixed length of time regardless of the scroll speed. Our data, however, did not support this idea and suggested that the desirable on-screen-time of data is dependent on magnification. Our results did serve to validate the fundamental idea of SDAZ — our data showed that incorporating zooming “allows for much more rapid navigation through the document space while maintaining the same level of user comfort.”
2.2
Orders of Control
Computer control systems generally fall into one of two categories: position control, or rate control (Zhai, Smith & Selker 1997). Position control, also known as zero order control, maps the device’s displacement to displacement with the system being controlled. For example, a scrollbar is a zero order control system as there is a linear relationship between the position of the mouse when dragging the scroll thumb and the position within the document. Rate control, also known as first order control, maps the input device’s displacement to velocity within the controlled system. For example, in rate-based scrolling the distance the mouse moves corresponds to the speed at which the document scrolls. The relationship can be modelled by a first order differential equation, hence the name “first order control” (Poulton 1974).
One known advantage of position control systems is that they support reversible actions better (Balakrishnan, Baudel, Kurtenbach & Fitzmaurice 1997). It is very easy, for example, for a user to grab the scroll thumb to go up a couple of pages to check something and then come straight back to where they were working before very rapidly. Balakrishnan et al. point out that this is not as easy to do with a rate control system. Our analysis in Section 3.1 and our experimental results (see Chapter 6) agree strongly with this.
It seems to be accepted that for such tasks as navigation in large spaces, rate control systems are better (Balakrishnan et al. 1997). Zhai et al. point out that when scrolling through a large document space it is desirable to control not only the position of the document but also the rate of the information flow so that the user can comfortably scan the document, and suggest that a rate control system would be superior to a position control system for doing this. They argue that with a position control device, the user may not be able to control the speed of movement continuously and that physical constraints (such as reaching the edge of the mouse pad) would mean the user has to stop scrolling and the re-engage when scrolling over a long distance.
The SDAZ system proposed by Igarashi & Hinckley and examined by Cockburn & Savage is a rate control system. SDAZ can thus be viewed as a modified version of rate-based scrolling. Therefore the natural comparison to perform with SDAZ is to compare it to a standard rate-based system, with the question in mind of “do the modifications make it superior to the standard system?” Though Cockburn & Savage demonstrated that SDAZ was superior to standard position control systems, it does not necessarily validate the idea behind SDAZ as it has not been compared to rate control systems. Therefore our evaluation of SDAZ seeks to compare it directly to a standard rate-based system — we also include scrollbars in our evaluation for completeness, but they are not the focus of our comparison.
2.3
Fitts’ Law
Fitts’ Law states that the time for target acquisition is linearly dependent on the Index of Difficulty (IoD):
T =a+bIoD (2.1)
The IoD, which is measured in bits, is calculated as a logarithm of the ratio of distance to target over target width:
IoD = log2( D
W + 1)
Guiard et al. (1999) suggested that Fitts’ Law could be extended from a model of visible target acquisition to a model of navigation in general. In particular, they had in mind the ability to model multi-scale pointing systems. Multi-scale target acquisition is where the user is provided with two controls (usually scrollbars) one of which performs fine-grained movements within the navigation space and the other course-grained movements. Therefore to locate the target, the user first moves the course-grained bar to approximately the right position and then makes minor adjustments with the finer-grained control. Such controls are usually used where the information space is very large compared to the level of accuracy required. In a large information space (for example a thousand page document), a normal scroll thumb becomes very small and moving it one pixel can jump multiple pages through the document, making navigation extremely difficult. The relevance of Guiard et al.’s research to our work is the idea that Fitts’ Law can be used to accurately model scrolling.
Hinckley et al. (2002) took this idea a step further and proposed “a formal experimental paradigm designed to help evaluate scrolling techniques” using Fitts’ Law as the basis for this paradigm. They believe that the Fitts’ Law parameters of distance and tolerance are suitable for being used to provide experimenters with a practical method to quantify scrolling techniques. They propose the use of the standard “reciprocal tapping task” (Fitts 1954) where the user moves back and forth several times between the two targets as rapidly as possible. After discarding the data from the first couple of taps (as the user is still getting a feel for where the target is) the mean time it took for each distance is calculated for each scrolling system. A graph can then be plotted comparing time against IoD for each system, which should give a linear relationship according to Equation 2.1. This can yield interesting comparisons between scrolling systems — for example, one system might be better for short distances and another better for long distances.
2.4
Physiological Analyses
It is worth having some idea of exactly what causes fast moving objects to blur. The contents of this section are dealt with at greater length in our earlier work (Wallace et al. 2004).
Blurring occurs when information is moving too rapidly across the retina of our eyes for our visual systems to process properly. A comfortable image velocity is around 2 degrees per second (Kelly 1979), though a person with good sight can tolerate an image retinal velocity of up to 3 deg/s without blurring occurring (Morgan & Benton 1989). The human eye has a built-in functionality whereby it naturally tracks moving objects, thereby reducing their retinal velocity and stopping blurring. This is known as smooth-pursuit eye movement (Eckert & Buchsbaum 1993). The use of smooth-pursuit eye movement allows us to watch objects that are moving in excess of 9 deg/s (Eckert & Buchsbaum 1993), perhaps even up to 100 deg/s (Blohm & Schreiber 2002), as the tracking of the target reduces the retinal image velocity to a manageable level.
Blurring is caused, therefore, when the smooth-pursuit system cannot be used properly. In document scrolling, for example, this can occur because the user must fix on a feature of the document and start following it as it moves across the screen with their smooth-pursuit system in order to identify what it is. By the time they have identified it and found that it is not the piece of information they are looking for and jumped their eyes back to another prominent feature, other information may have scrolled off the screen. The user will likely then give up trying to track all the targets and hence just see the information on the screen as a blur.
smooth-pursuit mechanism to activate (Rashbass 1959), and the image must then be stabilised on the retina for 100–125ms before it can be identified (Burr (1980), Card et al. (1987)).
The situation in document scrolling is more complex however. There is the presence of multiple prominent moving features on the display at once, and the fact that information is continually disappearing of one edge of the screen and more is appearing on the other.
Chapter 3
Document Navigation: Goals and
Support Mechanisms
Some forms of document navigation are performed effectively by current methods, while others are not as well catered for. It is worth examining different types of document navigation in order to gain an understanding of the strengths and weaknesses in current methods of navigation and to obtain insight into just how the addition of SDAZ functionality would complement the standard techniques.
3.1
Our Classification of Document Navigation
We are not aware of any existing taxonomies of different navigation actions. We therefore propose the following characterisation of the different types of document navigation:
• Spatial-Locate
This is where the user knows where in their document their target is. For example “I want to look at a page which I remember is about one-third of the way through this document.” This is analogous to picking up a book and knowing approximately which section of the book you want to open it at.
• End-Point
This is where it is desirable to navigate to the very start or very end of the document. This might often form the first part of a two part navigation action. For example, “I want to go to the page that is two pages from the end of the document”.
• Pagination
This is where the user wants of make minor adjustments to the information displayed on their screen. For example the user might be focusing on an item near the bottom of the screen and want to centre the screen on that location, or perhaps to look at the previous page.
• Search-For
This is where the user remembers a certain phrase that occurs somewhere in the document and wish to navigate to that occurrence, or all occurrences thereof.
• Page-Locate
• Reacquire
This is where the user wishes to return to their last location. An example of this would be the “Back” button on a web-browser. In document navigation this action would occur if the user was editing a section of a document and wanted to quickly check another relevant section before jumping back to the section they were editing.
• Zooming
This is where the user wishes to change the magnification of the document, either to zoom-in and view it in finer detail in order to read small print or a detailed diagram, or to zoom-out to obtain a more general overview, or to return to the normal level.
• Paging
This is where the user is reading or skim-reading the document and wants to keep the part they are examining on the centre of the screen as they move slowly and linearly through the document.
• Section Jump
This is where the user wishes to navigate to a section heading. For example “I want to go to the ‘Related Work’ heading” or “I want to go to Chapter 4”.
• Visual Browsing
This is where the user is unfamiliar with the document and wants to get a feel for its contents. The user wants to get an overview of the type of information contained in the document, important sections and graphics. This is akin to riffling the pages of a book in order to see approximately what it contains.
• Visual Search
This is where the user has a known visual target in mind. For example “I want to find the red graph” or “I want to find a particular page and I’ll know it when I see it”.
3.2
The Place of Current Methods within this Classification
It is clear that the current tools achieve some of these tasks effectively. For example, a scrollbar seems by far the most effective tool for Spatial-Locate tasks. The user can grab the scroll-thumb and move it to the appropriate location. Even if the document is too large for use of the scroll-thumb to accurately acquire the target, it will still be best for the scrollbar to adjust the position as close to the target as possible and then to acquire the target by using Visual Search. End point navigation is also a solved-problem: It is standard practise for Ctrl-Home and Ctrl-End to navigate instantaneously to the beginning and end of a document. Pagination also is easily achieved by use of the Pg-Up and Pg-Down buttons, and most applications achieve Search-For navigation by providing a “Find” function or similar search utility.
There seems to be little specific support for Page-Locate and Reacquire actions in most existing systems. Though the Adobe Acrobat PDF viewer displays the number of the current page beside the scroll-thumb when the users users it to scroll, which allows for rapid Page-Locate actions. Past research suggests that position control devices such as scrollbars are actually quite effective at performing reacquire actions (Balakrishnan et al. 1997). This is presumably because a position control interface turns a Reacquire task into a relatively simple Spatial-Locate task.
It is in Paging that rate-based scrolling finds its niche. Paging can be accommodated in small documents by dragging the scroll thumb slowly, however in large documents this is impractical as the smallest movement of the thumb causes the document to jump rather than move smoothly. Use of the Pg- keys is inadequate for the same reason — the sudden jump these cause disorientates the user who has to re-orientate themselves before continuing to read. Far more satisfactory for this task is rate-based scrolling where the document scrolls continuously at a speed controlled by the user. This allows the user to keep their focus at the centre of the screen while the document flows continuously and smoothly at a rate they control. Panning has often been used to accomplish paging, however rate-based scrolling seems preferable to panning as it is smoother and does not require continuous mouse movement.
Section Jump is performed most effectively by the use of an overview+detail system, where one window contains a listing of the main sections in the document allowing one click to jump straight to them, while the other contains the document itself. A major disadvantage of such systems is that the extra window adds to the screen clutter.
3.3
The Place of SDAZ within this Classification
Current methods do not so effectively achieve Visual Search, and Visual Browsing. It is in these areas (and to a lesser extent Paging and Section Jump), that we believe SDAZ has something worthwhile to offer.
The most obvious advantage of SDAZ is in Visual Search. This was the task type tested in the evaluation by Cockburn & Savage and we believe it was the reason they obtained such positive results. SDAZ provides a unparallelled way of smoothly navigating through large documents while significantly reducing the blurring limitation of standard based scrolling. The rate-based foundation of SDAZ means that scrolling is smooth, while the automatic zoom-out means that the user can navigate more rapidly through the document.
Visual Browsing is facilitated by SDAZ as a result of the zoom-out. Whenever the user scrolls rapidly, the automatic zoom-out allows the user to view a wider area of the document giving them a better feel for its overall contents. In Paging, SDAZ is equivalent to rate-based scrolling since at low speeds there is no difference between the systems. In performing a Section Jump, SDAZ is perhaps not as good as an overview+detail system. However, since section headings are likely to be large and bold, they will stand out when zoomed-out (though perhaps they will not be readable) and could be easily navigated to if the user had a moderate knowledge of where in the document to find the section they were looking for. Also, an overview+detail system usually requires the user to change their point of focus to a different window in order to selection the section, whereas in SDAZ systems their focus is maintained on the document.
SDAZ cannot be properly said to support “Zooming” as we have classified it. Certainly the automatic zooming functionality provided by SDAZ is a form of zooming. However zooming in SDAZ occurs to aid visual search, while normal “Zooming” as we have classified it here is performed either for obtaining an overview of the document or for viewing an image close up.
In the evaluation of SDAZ performed by Igarashi & Hinckley, the zoom-out was semantic based — section headings and graphics were kept fairly large while body text was shrunken further. By using our classification it can be seen that this would have resulted in a trade-off. Visual Search and Visual Browsing capabilities were being sacrificed in favour of Section Jump. Their system did not preserve page layouts which we believe would have reduced its usefulness for performing Visual Search and Visual Browsing, and their system became increasingly an overview+detail system as it zoomed out — probably increasing its ability to perform a Section Jump.
3.4
Using SDAZ with Complementary Methods
be combined with the standard methods.
Chapter 4
Calibrating SDAZ
Obtaining the optimal SDAZ system is a non-trivial matter. It is on the analysis of this problem that the bulk of our work here is focused. The settings that must be calibrated fall roughly into two categories:
• Control equations and constants.
These are the mathematical formulae behind the system. Setting these involves addressing such questions as:
– How fast does the user need to be scrolling before the system should start zooming out?
– When the zoom out does start, what formulae govern the relationships between mouse displacement, document speed, and magnification?
• Human-System interaction
These are the significant questions that must be addressed regarding the user’s interaction with the interface.
– What does the user have to do to scroll?
– How does the system represent the scrolling mode and the information associated with it to the user?
– What happens to the cursor when scrolling?
– How does the system convey the zoom-in location?
In order to address these questions a process of iterative implementation was used. Fourteen different users (mostly computer science students very familiar with scrolling and 3 with significant previous experience with SDAZ) used and commented on the system over the course of develop-ment. The basic SDAZ system upon which these modifications were analysed was developed originally by Joshua Savage in C/OpenGL (Savage 2002).
4.1
Control Equations and Constants
The following is a summary of the units and terms used in this section:
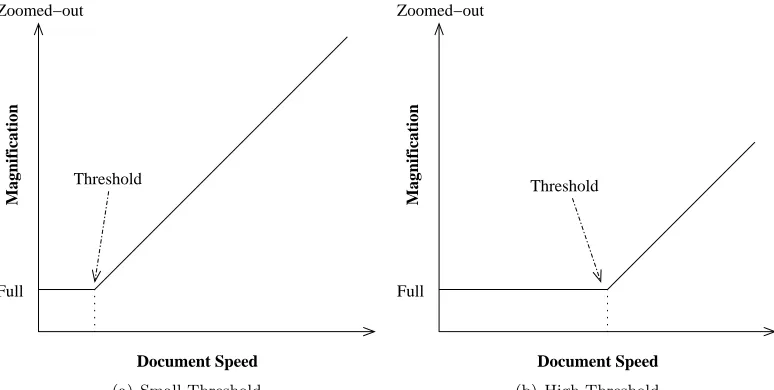
• Document speed is the rate at which navigation through the information space is occurring, and is measured in units of pages per second.
Threshold
Full Zoomed−out
Magnification
Document Speed
(a) Small Threshold
Full Zoomed−out
Magnification
Document Speed Threshold
[image:15.595.108.495.108.303.2](b) High Threshold
Figure 4.1: Illustration of Thresholds
• Magnification of the document is measured inpages, and refers to the number of pages visible on the screen. A magnification of 1.0 is considered “full magnification” while a magnification of 3.0 would mean three pages are visible on the screen — and therefore the pages would be one-third their usual size.
Given these definitions, the following relationship holds:
Screentime=M agnif ication/Documentspeed
4.1.1
The Threshold Constant
Thethreshold is the document speed at which zooming out begins. Thus, at any speed less than the threshold, the system will be at full magnification. A threshold that is too high results in the document blurring when scrolled fast because the high threshold means the document is not zoomed-out far enough to compensate for the speed. A threshold that is too low is annoying to the user because even when scrolling slowly the system will counter-intuitively zoom the document out. Figure 4.1 gives an illustration of the effect the threshold value has on the function of the system by showing the relationship between magnification and document speed.
We presented our test users with a range of nine different settings for the threshold value, ranging from 1.0 to 5.0 pages per second, at intervals of 0.5. Users were given a working SDAZ system on which they could dynamically adjust the threshold value by pressing number keys corresponding to the nine available settings in increasing order.
All user preferred the lower end of the range available. One user, expressing the unanimous opinion of the group, commented that 4.0 pages/s was “massively too fast”. All users felt that the optimal value lay somewhere in the range 1.0 to 2.5 pages/s. Several users preferred 1.0, but after further discussion opted for a higher value — we discuss this in the next section. One user, however, commented that “[1.0] is too quick [to zoom out], I do spastic actions.”
Two Conflicting Types of Navigation
It became evident to us in testing our threshold values that there is a tension in the system between two types of scrolling task. Using the classification scheme presented in Section 3.1, this tension can be understood as Paging and Pagination versus Visual Search and Section Jump. Unfortunately it appears that they require quite different system behaviour. Visual Search or Section Jump involves scrolling rapidly to a distant portion of the document. For these tasks an immediate (but smooth) zoom-out is desirable. For Paging and Pagination it seems strongly preferable that the system remain at full magnification throughout the action. Yet with Pagination the user often wants to move the mouse quite fast in order to rapidly change their point of focus. In our testing of threshold values, a few of the users (who evidently had only the task of Visual Search in mind) preferred the lowest threshold available: 1.0 pages/s. When the ideas of pagination and paging were discussed with them however, they all opted for 1.5 or 2.0 pages/s as optimal.
This observation of the two types of scrolling results in two options for the implementation of the system:
• To implement the two different tasks types as two different modes of SDAZ. This would mean that the SDAZ system would operate in two modes: with and without zooming. We think that this could be best implemented if pressing and holding the mouse button invoked normal rate-based scrolling (SDAZ with no zooming), but clicking and releasing the button invoked an SDAZ mode which would end when the mouse button was clicked a second time.
• To only support the one mode of scrolling.
Our observations suggest that the difference between the two types of task are not enough to warrant the disadvantages of a dual-mode system. Since most users seemed relatively happy with a threshold of 1.5 regardless of whether they had taken paging and pagination into account, we think that the gains to be made by using a rate-based-only mode in addition to a long-distance-SDAZ mode are probably negligible.
For the system used in our formal evaluation, we decided to use a threshold value of 1.5 pages/second and to support just the one mode of SDAZ.
4.1.2
Zoom Formula
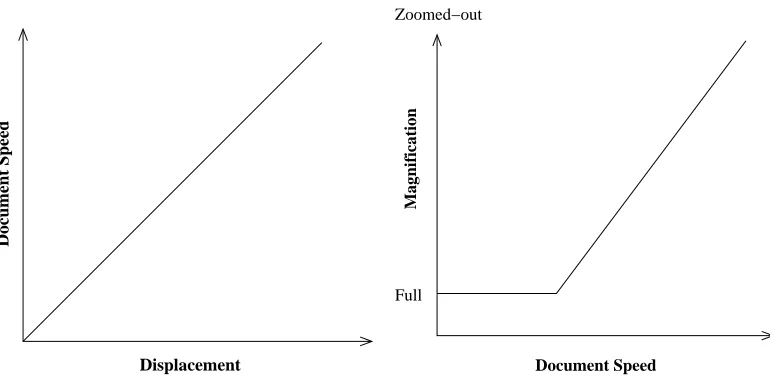
An important question in the calibration of an SDAZ system is what the formula controlling the automatic zooming should be. The basic idea of SDAZ is that the single parameter of mouse displacement should be mapped onto the two variables of Document-Speed and Magnification.
There are three values dealt with in this discussion: displacement (referring to mouse pointer displacement — how far the mouse has been moved since scrolling began),Document-Speed (DS), and Magnification. There are thus three relationships that can be discussed — the relationships between any pair of these three variables. Two formulae will ultimately govern the system — mapping displacement onto the other two variable spaces.
A very important question in the calibration of the system is the choice of these functions. SDAZ appears to us easiest to understand by thinking of it as two equations, the first mapping displacement to DS and the second DS to magnification. It seemed to us initially intuitive that a linear relationship for both would be desirable. See Figure 4.2 for an illustration of this.
Document Speed
Displacement
Full Zoomed−out
Magnification
[image:17.595.109.494.106.294.2]Document Speed
Figure 4.2: Two sample equations mapping displacement to DS to Magnification
An alternative model we considered, was to map displacement to magnification and then calculate DS in such a way that screen time was held constant. However our earlier investigation demonstrated that desirable screen time varied with magnification (Wallace et al. 2004).
One to One Mappings
A consideration in the choice of these functions is whether it is desirable to choose the functions in such a way as to ensure a 1 – 1 mapping across the three information spaces when the value of DS is exceeding the threshold. (That is, given a value of any one of the three variables, is it possible to calculate the other two?) If the functions chosen mean such a mapping is not preserved then the decision as to which variable spaces the functions should map between becomes relevant. An example is shown in Figure 4.3.
This shows that it will not always be possible to have a function mapping DS to Magnifi-cation. Therefore, though a mapping from Displacement to DS and then another from DS to Magnification is an easier system to comprehend (and will be used throughout this report), it must be acknowledged that this model does result in a loss of generality. A model which used a
Document Speed
Displacement
(a) Mapping 1
Full Zoomed−out
Magnification
Displacement
(b) Mapping 2
Full Zoomed−out
Magnification
Document Speed
(c) Result
[image:17.595.100.504.554.696.2]Full Zoomed−out
Magnification
Document Speed
(a) Linear
Full Zoomed−out
Magnification
Document Speed
(b) Exponential
Full Zoomed−out
Magnification
Document Speed
[image:18.595.105.500.105.249.2](c) Modified Exponential
Figure 4.4: The three main control equations investigated
Displacement→DS function and a Displacement→Magnification function would be sufficiently general.
For the sake of convenience and time we have limited our analysis to a direct linear mapping from Displacement to DS and concentrated on the relationship between DS and Magnification. It should be noted however, that Igarashi & Hinckley found a non-linear relationship between DS and Displacement to be more satisfactory — their settings are given in Table 4.2. Though we did not evaluate this directly, the results of our investigations have led us to think that Igarashi & Hinckley were probably right as we obtained non-linear results in our investigation of the relationship between displacement and DS.
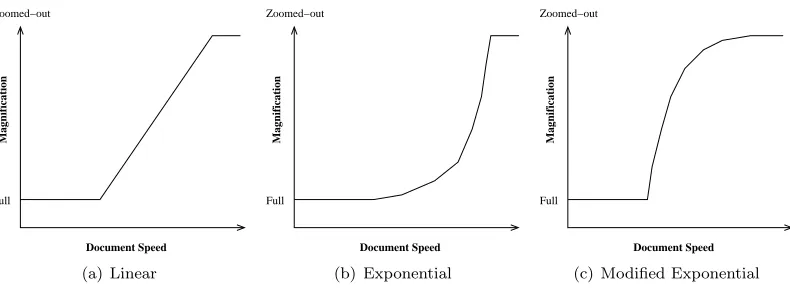
Our Analysis
The situation is still quite complex when analysing only the DS →Magnification mapping. We considered three types of equations to govern this mapping: Linear, Exponential, and Modified Exponential. See Figure 4.4 for an illustration of these. These seemed to us to be the most important cases.
Obviously if we zoom out too far the information displayed becomes so small as to be un-readable. Therefore we imposed an arbitrary limit of Magnification≤10 pages. Once the curve reaches a Magnification of 10 pages on-screen, it will not zoom out any further — though DS may continue to increase if the user continues to displace the mouse further.
We also considered the possibility of various slopes for these curves. The question of how steep the curve should be is very important. If too shallow, the system does not zoom out enough to compensate for the speed, which results in blurring — precisely the problem we are trying to avoid. Too steep, and the intermediate zoom levels are no longer easily accessible and the user feels disoriented when the system zooms out too fast.
The mathematic representations of the three equations we chose to investigate are displayed in Table 4.1. Note that these relationships only take effect when DS >Threshold. When DS≤
Threshold, the magnification is set to 1.
M agnif ication=Slope∗(DS−T hreshold) + 1 (line)
M agnif ication=e(DS−T hreshold)∗Slope (exponential)
M agnif ication= 10.0−9.0∗e(T hreshold−DS)∗Slope (modified exponential)
Table 4.1: The three equations we investigated.
possible settings ranged from 0.1 to 0.9 on the line equation and 0.03 to 0.26 on the exponential equations.
User Comments
Users were encouraged to experiment with various settings available to them, they could toggle freely between the nine slopes by pressing the appropriate numeric key and between the three equations by a similar key-press.
It was our belief prior to performing this evaluation that users would prefer the exponential equation, as we assumed that a smooth curve would feel smoother and more natural. However, users universally disliked this curve and felt that both the line and the modified exponential were better. One user commented that the exponential curve just “seems odd”.
We attempted to clarify the exact objection, by talking the problem over with the users. It appears that the problem is in the area of the curve nearest the threshold. Users said this shape was worse than the line because it did not zoom out as quickly. One user (showing remarkable insight into the shape of the equations) explained that this one did not zoom out as quickly as the line and that the opposite curve shape would be better — effectively describing the modified exponential curve (which he liked best when he tried it later).
Users unanimously felt that the line and the modified exponential curve were distinctly superior to the exponential curve. However the distinction between the former two was not so pronounced and it would often take users about ten minutes of using the system before they decided which one they liked better. All users eventually decided they preferred the modified exponential equation over the line equation, though most were very hesitant about making that judgement.
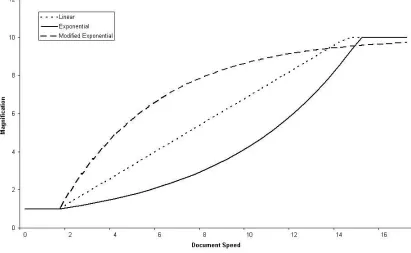
Regarding the optimal values for the slope, users mostly preferred values in the range 0.6 to 0.9 for the slope of the linear curve (0.7 seemed the single most preferred value) and 0.14 to 0.17 for the slope of the exponential. The preferred slope values for the modified exponential appeared to be widely distributed, with some people preferring values around 0.11, while others preferred 0.23 or 0.26. The consensus however appeared to be for a slope of 0.23 with the modified exponential. Figure 4.5 shows a graph of the three control equations at the preferred threshold setting and slope values — a threshold of 1.5 and slopes of 0.7 (linear), 0.17 (exponential) and 0.23 (modified exponential). An interesting feature which immediately stands out is the way the three curves almost intersect around the area ofDS≈14.3,M agnif ication≈9.7.
We believe that this feature is an indication of the optimal speed at the maximum magni-fication. As noted earlier, our magnification was limited to 10 pages, meaning that once the magnification had reached that level, no further zooming out could occur. We noticed in our test-ing process that for a large proportion of the time, the system was either fully zoomed in (when the user had stopped on their target) or fully zoomed out (when the user was scrolling to their target). Thus, we think that when we asked users what “slope” of each equation they liked, we were effectively simply asking them to select an appropriate DS value for a magnification of 10. Since we had already set the threshold value and defined the general formula of each curve, the user’s choice of such a value would have uniquely defined the appropriate slope.
For our system used in our formal evaluation we use the modified exponential curve with a slope of 0.23, since this setting appeared to be preferred by the majority of users.
Two Additional Curve Types
We considered two other possible equation types, but did not test them. These were the Combined-Curve and Two-Level curve. (See Figure 4.6)
Figure 4.5: The most preferred settings of the three control equations investigated
The Two-Level curve we considered since many users seem to operate the system in such a way that for most of the time the system is either fully zoomed-in or fully zoomed-out. The Two-Level curve would have two levels of magnification and would animate smoothly between them when the threshold was crossed. We did not bother investigating this curve as many of our testers told us they preferred the functionality of having access to the intermediate zoom levels. Also, our users did not always choose the steepest slope out of those we offered, suggesting that an infinitely steep slope would not be appreciated.
Full Zoomed−out
Magnification
Document Speed
(a) Combined curve
Full Zoomed−out
Magnification
Document Speed
(b) Two-Level curve
[image:20.595.168.433.527.668.2]Figure 4.7: The “Hunting Effect”. As the system zooms-in on the current location, the target graphic moves away from the pointer until it is partially off the screen.
4.1.3
Falling Rate
If the user ends scrolling using a mouse button when the system is not at full magnification, then the system needs to be returned to full magnification. Both Igarashi & Hinckley and Cockburn & Savage used a smoothly animated transition since an instantaneous transition caused disorientation (this was our experience also). Both groups solved this by imposing a limit on how rapidly the document can ever zoom-in (the “falling rate”) and then zooming-in at the maximum rate when scrolling stops. Neither group, however, reported the value used for this rate. We tried a few settings informally and decided to use the following falling-rate (tindicates time, in seconds):
δ(M ag)
δ(t) = 10∗M ag
Hence if the current magnification is eight, then the falling rate will be 80 pages per second. However the falling rate is continuously recalculated during the zoom-in based on this formula. This will mean that as the document approaches full magnification the value of the magnification is not being changed as fast. This is necessary because there is a greater visible difference to the user between magnifications of 1 and 2 as compared to magnifications of 9 and 10.
We selected this formula ourselves based on our own preferences and the system given to the test users used this formula, as does our system in our formal evaluation. No testers made any comments about the falling rate.
4.1.4
The Hunting Effect
SDAZ has been noted by Igarashi & Hinckley to suffer from a problem where users overshoot the target due to the system zooming-in as the user slowed. If the pointer is not on the target, then zooming-in causes the target to move away from the pointer. The user responds by quickly moving the pointer toward the retreating target, but this rapid pointer movement causes the system to start zooming-out again. This problem is known as the “hunting effect” (see Figure 4.7). In short it is where the user has difficultly acquiring the target precisely as the target avoids the “hunting” pointer.
This issue has been also recognised problem in Fisheye systems. The magnification of the Fisheye means that the target is moving fastest across the screen when the pointer is nearest it. Gutwin (2002) presented a technique called Speed Coupled Flattening (SCF) as a proposed solution to this problem with regard to Fisheye systems. SCF works by holding the Fisheye’s magnification level to a minimum when the pointer is moving and then rapidly reapplying the magnification when movement ceases.
means that it is not possible to zoom-in when scrolling.
This mechanism also appears to give users a greater feel of control as it allows, as a side effect, the ability to pause the zoom level. When the user reaches a zoom level they feel is adequate, they can reduce their speed (even to zero), without the system zooming back in. In a previous evaluation of SDAZ, one participant commented that such functionality would be desirable (Savage 2002).
An additional advantage of this modification is that it solves the problem of zoom-ins on direction change. Both Igarashi & Hinckley and Savage reported the problem that changing direction caused a sudden zoom-in. As the user changes direction their velocity is momentarily zero, meaning that the system sets the magnification back to full. As the user begins to move in the new direction, the system zooms-out again. From the user’s point of view the document appears to jerk as magnification is momentarily set to full before being zoomed-out again. Igarashi & Hinckley solved the problem by introducing an arbitrary delay in the zooming-in process, while Savage decided not to include this delay in the system used for evaluation. A few of our test users also commented on this: “The bouncing thing is really annoying,” complained one of them.
However, our users were not very positive in their assessment of our modification. They felt this was overly restrictive, and preferred the original version when they compared the two directly. All seemed to agree that the ability to zoom back in was a good thing, but that it should not happen as fast as it was occurring in the standard system.
We therefore decided to modify the falling rate control equation that is used in scrolling mode. The user “falls” back to the document at normal speed when scrolling ceases however. Our new falling equation is as follows (t indicates time in seconds):
δ(M ag)
δ(t) ≤3∗M ag
4.1.5
Three Unevaluated Ideas
• Orders of Control
We examined different orders of control in Section 2.2. We saw that SDAZ is a first-order con-trol system as it maps mouse displacement to scrollingvelocity, whereas traditional scrollbar and panning systems are a zero-order systems as they map mouse displacement to document
displacement.
Poulton (1974) says that “A control system of high order is improved by adding components of lower order.” He notes that “Control systems may combine 2 or more orders of control” and gives the example of “rate aiding” which is where a first-order system is supplemented by adding a zero-order component. This would suggest that SDAZ could be improved by adding a zero-order component to the formula. Hence any SDAZ system could be improved by adding an additional movement formula mapping mouse displacement into document displacement.
Our own observations suggest that such a addition would be very useful. When the user begins a scrolling movement, the system typically feels a little unresponsive at first because the user has increased the scrolling speed but the system has not scrolled any significant distance through the document. Whereas in a zero-order system such as a scrollbar, there is no lag between mouse movement and the document location being altered appropriately. We think that the addition of zero-order control to SDAZ would help the user to feel that the system was responding instantly to their wishes and that they really were moving toward their target rapidly.
• A Lag in the Zoom-Out
In the process of examining different threshold values we saw that there was a conflict between two different types of navigation action (see Section 4.1.1). One idea we considered using to solve this problem was an idea of a lag in the zoom-out. The idea was that the system should not start zooming out until the threshold value has been exceeded for a predefined length of time. Once the threshold had been exceeded for that length of time then the system could be set (either instantly or by smooth animation) to the appropriate zoom level for the current document speed, and normal SDAZ functionality would then occur.
We implemented a lag which was followed by instantaneous acquisition of the appropriate magnification. We found the instantaneous acquisition to be disorienting and the lag itself to be annoying as the system would delay before responding to our actions. We did not use this functionality for either the informal testing process or the formal evaluation.
• Stopping Instantly
Several users of our system commented that they would prefer if it was easier to stop. Scrolling could be ended at any time by using a mouse button (we discuss this further in the next section on Human-System Interaction), however users were concerned about the lack of ability to stop or reverse while remaining in scrolling mode. If a user overshoots their target or sees an item of interest, then they need to be able to stop or reverse quickly.
To stop in standard SDAZ while remaining in scroll mode, the user is required to to move the mouse by exactly the distance that they have already moved it, but in the reverse direction. If the user is scrolling fast then it can take over a second to do this, during which time the document has been scrolling rapidly in an undesired direction.
We suggest that it would be useful if users could just jerk the mouse in the opposite direction they are currently travelling, the system would respond by bringing them instantly to a complete halt. This action would need to be distinguished carefully from “legitimate” slowing that users do when navigating, which is prone to be far smoother in nature — involving less rapid mouse movement.
One user also commented that it was difficult to stop completely while in scrolling mode. In our system, displacing the mouse by even one pixel results in scrolling occurring (though very slowly) and hence the users needed to be pixel perfect in order to be completely stationary in scrolling mode. We suggest a “null-speed region” of several pixels in order to give the users some leeway in this regard.
Our system used in our formal evaluation does not have the instant-stopping functionality, and has a null-speed region of one pixel as described above.
4.2
Human-System Interaction
There are several important issues that need to be addressed regarding the user’s interaction with the interface. Since there are only a few discrete possibilities for most of these issues we are more certain of the accuracy of our results presented here than in our last section where we were trying to obtain the optimal value in a continuous range.
4.2.1
Zoom Location
(a) Zoom-Pointer (b) Pointer-Centre (c) Zoom-Centre
Figure 4.8: Screen-shots of the three systems.
A number of alternative interfaces were investigated as solutions to this problem. Three pos-sibilities were initially investigated. Figure 4.8 shows screen-shots of the three systems.
• Zoom-in at the moving pointer: zoom-pointer.
• Keep the pointer in centre of screen while scrolling: pointer-centre.
• Remind the user that zoom-in will be at screen centre while allowing the pointer to move:
zoom-centre.
Following Cockburn & Savage’s implementation we initially warped the pointer to the centre of the screen when scrolling began. We decided to interpret the idea of having a “moving pointer” to mean allowing the pointer vertical freedom, but in all our implementations we disallowed horizontal movement. This meant the pointer was always in the horizontal centre of the screen. We also, when in scroll-mode, replaced the pointer with a semi-transparent double-headed arrow to indicate to the user that mouse movement will cause scrolling rather than pointer movement. In all systems we clearly marked for the user the zoom-in location by using a visually clear red rectangle to indicate this — an idea taken from an as-yet-unpublished paper by Jones, Jones, Marsden, Patel & Cockburn regarding SDAZ on palm displays.
Even with the added visual draw of the rectangle in the centre of the screen, users eyes still naturally followed the moving cursor. Thus the zoom-centre system was a complete failure. “I don’t like it” stated one typical user expressing the unanimous opinion on the subject.
Both the zoom-pointer and zoom-centre systems have a potential difficulty with the pointer hitting the top of the screen. Should this place a natural upper-limit on speed, or should the system allow the user to continue increasing speed? In our system this was not a serious problem as the user never moved the mouse as far as the edge of the screen because such a high speed would be inappropriate for the 30 page documents we were using to test it. By the time the user reached such a high speed in our system, they would be at the end of the document already.
Inverted Controls
We observed a serious problem with the zoom-pointer system. As the user scrolls more rapidly, the pointer moves toward the boundaries of the screen. Since the information is scrolling from the same boundary as the user is moving toward, this means the user has a progressively shorter distance in which to spot their target before it passes the pointer. See Figure 4.9 for an illustration of this. This resulted in users overshooting their target when moving at high velocities.
Figure 4.9: The direction of the information flow is indicated. The information has only a short distance to move before it passes the focus region.
moves upward). This means that the pointer is moving away from the oncoming information — giving the user an increasing distance over which to spot the approaching target. See Figure 4.10 for an illustration of this.
However, the user response to the inverted-pointer-zoom system was mostly negative. “I like it better the other way [non-inverted]. . . It’s better normal.” said one user, stating the almost unanimous opinion. We believe there are two main difficulties with an inverted system.
The first difficulty is that it is unnatural to move the mouse in the inverted direction. However, it could be argued that it is “unnatural” merely because people haven’t had much practise at it yet. Indeed, one of our users commented, “This [inverted] is fine. It’s no harder getting used to it with the reverse thing than the other way. . . maybe I’ve played too many computer games with inverted controls. . . It probably is better this way [inverted].” It might be argued that this is merely a matter of convention and it can be changed.
We have two objections to this argument. Firstly, having a counter-intuitive system decreases the system’s learnability. We think that a novice user will naturally attempt to scroll in the usual way and be put off when the system does not respond as expected. Our second objection is that not only is the inverted direction unconventional, but it means that the user is being asked to move their pointer in the opposite direction to their target. It is asking the user to move away
from the target in order to acquire it. It is unsurprising most users found this counterintuitive The second difficulty we see in the inverted system stems from this idea that the pointer is moving away from the target. The pointer movement is actually going to increase the effective distance between the pointer and the target. The focus area is being moved away from the target
[image:25.595.245.358.569.704.2]by the movement of the mouse. This could be avoided, if a zero-order supplement was used (see Section 2.2), so that the document was displaced toward the target by the same distance that the pointer was being moved away from it. However, the argument is moot as all users liked the pointer-centre system over any of the alternatives whether inverted or not.
Pointer-Centre is Best
[image:26.595.432.496.268.618.2]Users were unanimous in their opinion that the pointer-centre system was superior to the other systems they used. The following comment was fairly typical. “That’s probably a good idea actually. . . Yeah, that’s good. . . I reckon with this way you’ve got more control. . . You can keep track better.” Users consistently pointed out the way the focus didn’t move in this system and that they liked it better because of this. Several commented that this stationary focus meant it was easier to control the system.
Figure 4.11: The information area used by Cockburn & Savage.
We think the stationary reference point also decreases the mental load of users as they do not have to keep track of two moving objects at once (the document and the reference point). We believe that keeping a station-ary reference point allows the users to better determine their exact speed through the document. Calculating the speed difference between the moving document and a stationary reference point is doubtless easier for the user than calculating the speed difference between two moving objects.
We also noticed that users tended to focus on anything on the screen that was moving. Only when nothing else on the screen was moving did they focus their full attention on the background document that was scrolling. Obviously the best performance occurs when the users are fully focused on the document rather than on the moving reference point.
4.2.2
Speed Indication
The system created by Cockburn & Savage used an information area to the right of the screen to indicate both scrolling velocity (including the threshold value) and location within the document. Figure 4.11 shows an image of this information area.
As we discussed in Section 3.4 we believe that in a real system this would be a normal scrollbar as we do not view SDAZ as being a replacement for a scrollbar. The scrollbar will convey the location within the document to the user by position of the scroll thumb. This means that the information regarding scrolling velocity needs to be conveyed by some other means. Also, having it displayed at the side of the screen is not really satisfactory as the user’s attention should be focused at the centre of the screen on their document.
In the rate-based systems used in modern versions of Microsoft Windows, clicking the middle mouse button of a three-button mouse places a double headed arrow at the current position on the screen and rate-based scrolling occurs with that as the reference point. As the user moves the pointer, the moving pointer takes the form of an arrow and its distance from the reference point indicates scrolling speed.
The zoom-centre system explored one possible way in which the displace-ment of the pointer from the centre of the screen indicated scrolling velocity.
Figure 4.12: The size of the pointer indicates scroll-speed
A second option investigated was to have the pointer grow in size to indicate speed. See Figure 4.12 for an image of this. This possibility suffers from the same problem as the zoom-centre system. The users eyes are be drawn to the “moving” cursor — since the end of it is growing. They expect the system to zoom in on the end of the overgrown pointer.
Our conclusion is that it is preferable to give no indicator of scrolling speed. We found that it is best if nothing on the screen is moving or changing which might in any way distract the user from the information flow and their targeting. We believe that the information flow of the document itself provides an adequate gauge of the scrolling velocity and conveys it more naturally than any arbitrary scale we could devise. Thus, the system used in our formal evaluation gives no indication of scrolling speed.
4.2.3
Mouse Buttons
The implementation of SDAZ by Cockburn & Savage involved pressing and holding the left mouse button while moving the mouse. According to MacKenzie, Sellen & Buxton (1991), such dragging is slower and more difficult than normal pointing. This suggests that the system could be improved by having the user move the mouse freely rather than dragging with it.
We developed a modal interface where clicking invokes the zoom mode and clicking again ends it. Another example of such an interface is the “second mode” of the Microsoft IntelliMouseT M described by Zhai et al. (1997).
During our user evaluations we noticed that a lot of our users were doing excessive clicking as a result of this. When acquiring a target, users generally miss the first time by half a page or so and then require a second scrolling movement to reach their target. In this second movement they are travelling only a short distance, and forcing them to click twice in order to do this (once to start scrolling and once to end it) seems excessive. We therefore decided to have our system support both the modal and the dragging behaviours.
a button, the relocation of the cursor, the selection of text, or the following of a hyperlink. The right mouse button typically invokes a context sensitive pop-up menu. Hence we decided to use the middle mouse button for scrolling in our system.
The decision to support both behaviours using the middle mouse button means our system is equivalent in these respects to the standard functionality of the middle mouse button in modern Microsoft WindowsT M systems (such as XP) — which invokes rate-based scrolling on a middle-button press with support for both the modal and dragging behaviours.
4.3
Final Settings
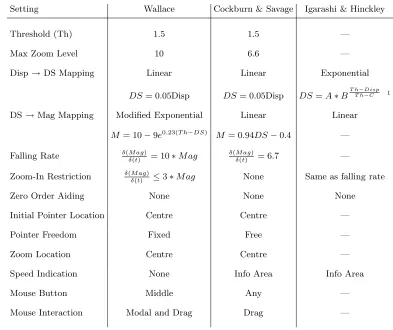
We feel it is helpful to give a complete listing of the settings used in the calibration. Table 4.2 lists the different settings of the SDAZ system. For comparison purposes we have included what we know about the settings used by Cockburn & Savage and Igarashi & Hinckley in their evaluations. As already noted, neither group comments much in their published work about what settings they used. However we have been able to obtain privately the information about the settings used by Cockburn & Savage and we publish it here. What we know of Igarashi & Hinckley’s settings we have included in this table for the sake of completeness.
Setting Wallace Cockburn & Savage Igarashi & Hinckley
Threshold (Th) 1.5 1.5 —
Max Zoom Level 10 6.6 —
Disp→DS Mapping Linear Linear Exponential
DS= 0.05Disp DS= 0.05Disp DS=A∗BT hT h−Disp−C 1
DS→Mag Mapping Modified Exponential Linear Linear
M = 10−9e0.23(T h−DS) M = 0.94DS−0.4 —
Falling Rate δ(M ag)
δ(t) = 10∗M ag
δ(M ag)
δ(t) = 6.7 —
Zoom-In Restriction δ(δM ag(t) ) ≤3∗M ag None Same as falling rate
Zero Order Aiding None None None
Initial Pointer Location Centre Centre —
Pointer Freedom Fixed Free —
Zoom Location Centre Centre —
Speed Indication None Info Area Info Area
Mouse Button Middle Any —
[image:28.595.101.494.327.657.2]Mouse Interaction Modal and Drag Drag —
Table 4.2: The settings of the different SDAZ systems
Chapter 5
Formal Evaluation
5.1
Goals
There are three main goals of this evaluation:
• To compare SDAZ to rate-based scrolling.
• To model SDAZ using Fitts’ law.
• To provide further insight into the accuracy of the previous calibration of the system. The evaluation also has a three secondary aims:
• To explore whether people more naturally use the dragging or the modal version of the SDAZ and rate-based systems, and how this choice affects their performance.
• We are interested in seeing how previous experience with SDAZ and previous experience at using computers affects ability with the system.
• To investigate the idea that a large document might adversely affect performance with scroll-bars while making no difference to the rate-based systems.
The evaluation is based on the experimental paradigm of Hinckley et al. (2002). They proposed that Fitts’ law be used to model different scrolling systems. Participants perform what is known as a Fitts’ reciprocal tapping task, where they scroll back and forth several times between two targets. This is repeated several times with targets different distances apart and with the different scrolling systems. Each scrolling system can then be modelled using Fitts’ law (see Section 2.3).
Our experimental method differs from that employed by Hinckley et al. in two minor ways. Hinckley et al. tested their scrolling systems over different levels of accuracy — for example, for some tasks the users had to position the target in the centre half of the screen, while getting the target on the visible screen was sufficient in other tasks. Thus they varied the level of accuracy they were requiring from the users. We saw no point in doing this and therefore simply asked the user to get the target on the screen in all our tasks. Our reasoning for this is threefold. One, if Fitts’ Law does accurately model scrolling, as has been shown (Hinckley et al. (2002) and Guiard et al. (1999)), then there is little to be gained by testing different accuracies as the model accounts for the accuracy and can therefore be used to predict the results for different accuracies. Two, the purpose of scrolling is to get information into the visible screen space, once it is visible it is a fairly trivial task for the user to get it to the precise location on the screen that they happen to desire and such minor pagination is not the concern of long distance scrolling systems. Three, it would increase the time required from our participants. Our experiment took participants between 20 and 40 minutes and we did not want to greatly increase this by adding further conditions.
would simulate user familiarity with the document. For example, a user familiar with a document would know in which direction and approximately how far their desired target was compared to their current position in the document. Users were therefore given the line numbers of their targets so they could use that as a check against the line numbers in the margin of their current location. There were two reasons we did not use such line numbering. One, an integral part of SDAZ is that it allows the user to visually identify the target as it passes. If the users simply focused at the line numbers on the side of the screen there would be absolutely no difference between SDAZ and rate-based scrolling. Since it is precisely a comparison of those two systems that we are attempting, such an experimental condition would be entirely unacceptable. Two, there is the problem of deciding what to do with the line numbers in the SDAZ system — do the line numbers zoom out too, or do they bunch together so none can be clearly read, or are only some of them shown? We decided that the best solution was to use no line numbers. We instead made sure that the documents both had normal page numbers so that the users could use those if desired (none did) and the chapter and section headings of the larger document were numbered (which several participants did use for reference).
5.2
Participants and Apparatus
Fifteen volunteer university students (eleven male, four female) took part in the experiment. Eight regularly played computer games involving rapid information flow. Nine were full time computer science students. Five had used SDAZ before, and nine had used rate-based scrolling before.
The evaluation was done using the SDAZ system discussed at length in Chapter 4, which was modified to handle rate-based scrolling and a standard scrollbar. This system provided frame rates of approximately 150 frames per second during the experiment and was running on a 2.4 GHz Intel Pentium 4 computer with 512MB RAM and a Geforce 4 MX video card, running Redhat Linux 8. The 19-inch display was set to 1280x1024 pixels and the interface ran in full-screen mode.
5.3
User Tasks
The experiment was a 3x6 repeated measures design. The dependent measure was time taken to tap between the targets. The two factors were as follows:
• Scrolling system
The levels of this factor were: rate-based, SDAZ, and scrollbar.
• Target set
There were six pairs of targets that participants scrolled back and forth between eight times. That is, each target in each pair was acquired four times by the user.
Participants were given a print out of the pages of the document that their current target pair were on, and the targets themselves were highlighted on the hard copy. Participants had as much time as they desired between each target set to familiarise themselves with the document and with the location of their targets. Participants were then asked to scroll back and forth between the two targets as quickly as possible, pressing the space bar when they had reached each target (when the highlighted portion of the page was on screen). The data from their first acquisition of each target was discarded as the user was still learning the location of the target.
Target Set # Distance Doc # Doc # Length Reference
1 35 1
2 20 1 1 47 Moyle (2001)
3 5 1
4 5 2
5 3 2 2 8 Hinckley et al. (2002)
[image:31.595.105.497.366.454.2]6 1.5 2
Chapter 6
Results and Discussion
6.1
Fitts’ Law Models of the Systems
Figure 6.1 shows the mean times for each scrolling system plotted against the Indexes of Difficulty (IoD) tested, and the data itself is shown in Table 6.2.
According to the information theoretic basis of Fitts’ Law, it is optimal to have a 4.13% error in the results (MacKenzie 1992). If the error level differs significantly from this, the IoDs can be adjusted statistically to account for it. Users in our evaluation made errors 3.95% of the time so we have not used any adjustments in our results.
Table 6.1 shows the equations of the lines of best fit for the three systems according to the Fitts’ Law model (see Section 2.3 for a description of Fitts’ Law). The highR2values are typical
of Fitts’ Law which is well known forR2values of 0.9 or above (MacKenzie 1992).
[image:32.595.93.503.473.711.2]Notable is the way in which the fifth point drops off for all three curves. This suggests that the target set was easier than the rest for users to spot. That particular target set was the introduction
System Equation Pearson’sR2
Scrollbar y= 0.71x+ 0.67 R2= 0.843
SDAZ y= 1.51x−0.19 R2= 0.996
[image:33.595.199.408.107.177.2]RateBased y= 1.69x−0.08 R2= 0.971
Table 6.1: The equations of the lines of best fit
and conclusion headings of the document — both of which were followed by a small amount of text with a page or so of whitespace on either side, hence making these targets visually obvious.
The vast superiority of scrollbars over the other two systems raises questions. Were Cockburn & Savage wrong when they found SDAZ to be faster than scrollbars? We believe the answer lies in the nature of the task. By our classification given in Chapter 3, the task in a Fitts’ Law reciprocal tapping task is a Reacquire action. As we mention in that discussion, position control devices such as scrollbars are known to be especially efficient at Reacquire actions. Our findings clearly support that thesis. Some of our participants commented that they were simply remembering the location on the scrollbar that the thumb needed to be located rather than actually looking for the target within the document. Thus, they were performing a Spatial-Locate task rather than a Visual Search.
Therefore, to some extent, the experimental paradigm of modelling a scrolling system using Fitts’ law tapping tasks is not universally valid. More specifically, comparison between a rate-control system and a position rate-control system is unfairly biased in favour of the position rate-control system. We can still, of course, draw results between rate-based systems though and conclude that our results show SDAZ to be faster than a standard rate-based system for performing Reacquire tasks. Hence we see no conflict between our results and those of Cockburn & Savage. Cockburn & Savage used Visual Search tasks in their evaluation, which we believe to be the strength of SDAZ.
Scroll-Type IoD Mean Time (ms) SD SE
1.32 2051 1019 263
2.00 3250 1150 297
Rate-Based 2.58 3572 1131 292
2.58 4978 1801 465
4.39 8088 2473 638
5.17 8052 2687 694
1.32 1767 624 161
2.00 2861 1180 305
SDAZ 2.58 3263 1254 324
2.58 4094 2119 547
4.39 6691 2754 711
5.16 7414 2626 678
1.32 1191 429 111
2.00 1997 647 167
Scrollbar 2.58 2446 609 157
2.58 3118 1255 324
4.39 4339 1933 499
5.17 3727 1273 329
[image:33.595.184.422.462.692.2]Figure 6.2: The NASA TLX subjective evaluation results.
6.2
SDAZ vs Rate-Based
As Figure 6.1 shows, SDAZ was faster than