AND CONTROL
A thesis presented for the· degree of Doctor of Philosophy in Chemical Engineering
in the
University of Canterbury Christchurch, New Zealand
by
GRANT WILSON p"'~
ENGINEERING
LIBf\ARY
j(_)
C:'C/
1 ,) )
. J)
'"'
~llf
\5
) C(T'l c'''{~l
ABSTRACT
A pilot plant scale, atmospheric pressure, sieve plate
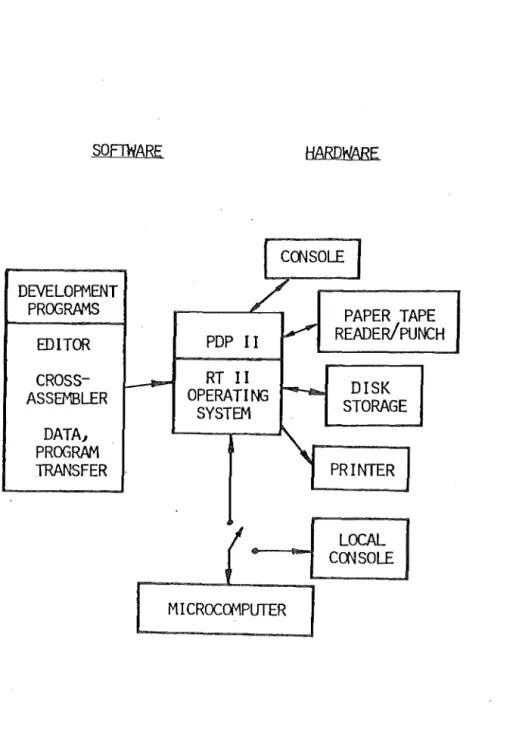
distillation column was constructed and fully instrumented. Novel speed controllable pumps were used to control liquid flows. A micro-computer was constructed to provide local and hierarchical control of the column. The microcomputer included an operator console, a 16 channel data acquisition uni·c, a 4 channel control output unit, and a hardware arithmetic processor. A software development system was assembled by linking the microcomputer to a minicomputer. Software written for the development system included a cross-assembler, a transfer program, and a microcomputer control program.
A binary steady state distillation column model was developed, solved on a digital computer, and verified _against experimental data using a binary mixture of methanol and water.
Two control schemes were investigated using only the microcomputer resources. A multi-loop system using digital PI controllers was found to give excellent control within the accuracy of the instrumentation.
An adaptive feedforward controller was proposed and verified
using a steady state model, and experiments. The results were good, but because of the relatively simple dynamics of the experimental column, the feedforward controller was no better than the feedback controllers.
ACKNOWLEDGEMENTS
Many thanks to Dr •. R.M. Allen for his help and advice during this work.·
Thanks also to all the technicians of the Chemical E.ngineering Department for their efforts iri constructing equipment.
This work was financed by a University Grants Committee grant
CC76/25)_. Glassware was kindly donated by Ivon Watkins-Dow Ltd.
The author acknowledges financial support from a B.P. Postgraduate Scholarship, .a University Grants Committee Postgraduate Scholarship, and a University of Canterbury Teaching Fellowship.
Thanks to Mrs. D.E. Ball for typing, and my parents for proof-reading this thesis from my illegible writing.
DISTILLATION COLUMN .DYNAMICS AND CONTROL
··coNTENTS ABSTRACT
CHAPTERS
1. Introduction 2. Review
3. Distillation Column Hardware 4. Computer Systems
5. Microcomputer Software
6. Steady State Binary Distillation Column Model 7. Column Dynamics and Feedback Control
8. Feedforward Control 9. Conclusions
REFERENCES APPENDICES
I Circuit Diagrams II Column Calibrations III PDP-11 Software
IV Microcomputer Software
V Cross-Assembler and Pre-Assembler
VI Steady State Binary Column Model Programs VII Methanol/Water Properties
CHAPTER ONE
INTRODUCTION
Distillation processes have been extensively studied because they occur frequently in the chemical processing industries, are large consumers of energy, and are often critical in determining product purities. The objectives of previous studies have been to improve the understanding of the dynamics of distillation columns, and consequently to improve perform-ance by maximising production and minimising costs. This work represents a continuation of this theme with the use of new technology, and an
alternative control system.
A range of approaches have been adopted in,the literature including complex computer simulations, simple black box models, and experimental tests using analog and digital hardware. Each approach may have its merits, but there is no single approach which can be applied to all distillation processes, in fact the control problems of a particular distillation column may be unique. The overriding philosophy behind all investigations of the performance of various control schemes will
ultimately be profit - is the extra expense of a more complex control system justified?
The major problems of distillation control are:
(i) Cii)
(iii)
(iv)
(v)
(vi)
the interactions between control loops; the non-linearities of the process;
the time variation of process parameters; the slow dynamics of the process;
the use of slow and inaccurate sensors and analysers; the large load changes which may occur.
successful, but in others the process non-linearities, and the measurement difficulties have led to poor control.
1.1 OBJECTIVES
The objectives of this work were fourfold:
(i) to design and construct a pilot scale distillation scheme; (ii) to instrument the column;
(iii) to construct a computer based control system; (iv) to investigate computer control of the column.
The criteria for the column and instrumentation were:
(i) redesign and reconstruct a 225 rom diameter atmospheric pressure sieve tray column of conventional form using components from an existing column;
(ii) provide temperature sensors on all trays, level sensing in the reboiler and reflux accumulator, overall pressure drop sensing, and product composition analysers;
(iii} provide flow control systems on the distillate, reflux, bottoms and steam flows;
(iv) provide flexible operation of the column.
The choice of a digital control system was made from among the following:
(j)_ microprocessors acting as analog controller replacements: under minicomputer control;
(ii)_ a microcomputer/minicomputer system with substantial micro-computer independence;
(iii) a microcomputer standalone system with an operating system and peripherals;
(iv) a minicomputer system.
circuits prompted a shift in emphasis from using a minicomputer to a
microcomputer. A minicomputer would have been under utilised on a single distillation column, but if used as the centre of a development system for a microcomputer, i t could be released for other uses when not required. Option (ii) was therefore adopted, and a microcomputer system developed with interfaces to the process, the operator, and a nearby minicomputer. A development system was created in the minicomputer to enable rapid and easy programming of·the microcomputer.
Several control strategies were investigated, and compared on the pilot scale column. These were based on
Cil feedback control;
(ii) feedforward/feedback control.
The feedforward controller was based on the shortcut column design method of Gilliland (1940) . A steady state computer model was developed to predict the column performance, and to test the feedforward controller.
CHAPTER TWO
REVIEW
Process control has been extensively studied and the investigation of the behaviour and control of distillation columns has been no exception. Every conceivable control strategy has been applied to controlling
simulated and experimental distillation columns, but production units have in general relied upon the less exotic control strategies such as
feedforward/feedback control.
The introduction of minicomputers into process control produced a centralisation of control functions over the previously used distributed analog systems. The big failing of the minicomputer system was the need to provide analog backup in case of a computer failure .(Bruce and Fanning (1964), Guisti et al (1962), Rosenbrock et al (1965}). The current trend is back to distributed control schemes with microcomputers providing dedicated control on one piece of plant and perhaps connecting with a hierachical control scheme (Tao et al (1977)). The major control equipment vendors are now marketing distributed control systems, e .. g. Honeywell TDC2000 system.
The rapid development of the microprocessor and its peripherals, coupled with a drop in the price of semiconductors has made sophisticated microcomputer-based control schemes possible. It is now feasible to provide intelligent control systems in places where a minicomputer could not be justified (Skrokov(l976)). These dedicated microcomputers can be further adapted to process control by providing special instruction sets
(Cummings and Miller (1977}) and special programming languages (Gillespie (1977), Claggett Cl977)).
area.
use of discrete process analysers such as gas chromatographs and mass spectrometers can be expected as microcomputers are programmed to operate these instruments and interpret the results (Bailey (1978)).
Improvements are being made in sensing variables with solid state transducers. National Semiconductor's (1974) pressure and temperature sensing integrated circuits are good examples. The price and performance of these systems make i t possible to build more sophisticated control
systems at reasonable prices.
While the advances in control computers have been spectacular, the improvements in DOC algorithms have been much lower key. Various
controller algorithms using different design criteria have been proposed (Mosler et al (1967), Kurz and Isermann (1977)), but the industry standard, the PID controller, has been shown to be the best general purpose controllex
(Bristol (19771 , Unbehauen et al (1976)) . The more complex algorithms can be beneficial on some processes where long lags and deadtimes exist, or where interactions occur. Multivariable techniques are best applied to systems where the process models·are simple but accurate over the
operating ra_nge, and can lead to conventional PID controllers (Shih (1970)).
Distillation Column Dynamics
Distillation column dynamics have been extensively investigated, and several excellent reviews of the literature have been made by Archer and Rothfus (1961), Williams (19631 and Rademaker et al (1975). A study of dynamics requires a study of the steady state problem in order that any simulation may have a valid starting point.
Several approaches have been used to solve for the steady state conditions in a distillation column. The methods of McCabe and Thiele
ll925l and Sorel (Gillil.and and Robinson (19501) involved plate by plate calculations to find the number of trays required for given operating
have limited applicability. The shortcut methods of Brown et al (1939) , Gilliland (1940), Mason (1959) and Erbar et al (1961) have merit in that they are invaluable for preliminary design work, but are inaccurate for more exacting requirements (Van Winkle and Todd (1971)). The problem of determining the column compositions and flows for a given geometry has been tackled by solving the simultaneous heat and mass balances which can be written around each stage (Amundson and Pontinen (1958}, Holland (1963), Wang and Henke Cl966)). These methods involve an iterative solution for the flows and compositions, and can be applied to multicomponent and binary systems.
included.
Other factors such as the tray efficiency can also be
The determination of the dynamic response of a binary distillation column involves the solution of a set of ordinary differential equations
(for a plate column) . The majority of the literature on column dynamics deals with the assumptions inherent in deriving these equations and the method of solution. Early researchers used ,analog computers to solve
the equations (Lamb et al (1961)), but more recent workers have used digital computers. Svrcek (1967} showed that the differential equations for a binary eight plate column could be solved in 5% of realtime
(assuming that the liquid flow dynamics were fast enough, so the liquid flow differential. equations could be replaced by steady state balances). A number of other methods of solution are summarised by Rademaker et al
(1975) .. The consequences of the assumptions made in some of the models (e_. g. neg-ligible liquid and vapour holdup) can be serious in large columns where liquid holdups are significant. However, in smaller pilot scale columns, such effects can generally be ignored.
Rademaker et al (1975) have summarised the more important experi-mental results. Most of the work on experimental columns, using step
tests, shows good agreement between the suggested theory and the experi-mental measurements. The number of trays used in such columns is
Simple transfer function models (lags and deadtime) have been used to describe column responses (Luyben and Gerster (1964) , Jafri et al (1965) , Wood and Berry (1973}, Krishnamoorthy and E.dgar (1977) ). The fitted
models were used to design controllers. Approximate models for large distillation columns have been suggested to avoid the need to solve large systems of differential equations. These models can be determined from steady state data using the concept of inventory time which can be defined as the ratio of the total change in storage for the whole column to the total change in flow out of the column (i.e. a pseudo first order time
constant for the complete holdup of the whole column in terms of a single component}. Improvements on the initial work of Moczek et al (1965) have been made by. Wahl and Harriot(l970)_ r and Weigand et al (1972}, but th.e results have only been compared. with simulations, and generally only apply to large columns with many trays.
Distillation column control
There is a vast quantity of material on distillation column control in the literature. Rademaker et al (19751 have summarised the major contributions in this field up to the late 1960's. Control schemes have generally been examined theoretically on experimental columns or practic-ally on production columns and there is a large. gap between these two groups. Experimental columns are, in general, pilot scale atmospheric pressure binary columns, and hence avoid a lot of the problems of large production columns, e.g. liquid flow lags, and the need for pressure controls. Much. work needs to be done in bridging this gap and extending the scope o:l; industrial control schemes using economic criteria to justify the changes.
industrial distillation control.
Many researchers have looked at the application of multivariable techniques to distillation columns. An excellent review of this approach is given by Edgar and Schwanke (1977) • Some of the simple multivariable techniques such as decoupling have been studied but generally only on experimental columns. The effect of decoupling single loop controllers operating on product compositions has been shown to produce improvements, but this is to be expected because of the lags and delays caused by the large liquid holdups in the reflux accumulator and reboiler, and the consequently slow responses of the composition loops. Indirect campo-sition control by controlling internal tray liquid temperatures is superior even without decoupling because of the faster loop dynamics. Other schemes using optimal multivariable controllers require process models which are generally inaccurate because of linearisation, model
order reduction, incomplete measurements, and changing operating conditions (Schwanke et al (1976)). The results of these inaccuracies are
sub-optimal and in some cases unstable control. Some work on the use of adaptive controllers (Sastry et al (197 7)_) has shown promising results for a single loop, but the overall performance is no better than can be achieved by feedforward/feedback techniques.
3.1 3.2 3.3 3.4 3.5 3.6 3.7 3.8 3.9 3.10 CHAPTER.THREE
DISTILLATION COLUMN HARDWARE
. ·coNTENTS Introduction
Reboiler and Condenser Modifications Tray Design
Reflux Accumulator Control Equipment
3.5.1 Liquid Flow Control 3.5.2 Variable Speed Motor 3.5.3 Positive Displacement 3.5.4 Pump Installation 3.5.5 Steam Flow Control Auxilaries
3.6.1 The Feed System 3.6.2 Product Coolers
Pump
Distillation Column Construction Instrumentation
3.8.1 Temperature Measurement 3.8.2 Level Sensors
3.8.3 Pressure Sensor 3.8.4 Composition Sensor Selection of a Binary System Commissioning
3.10.1 Temperature Sensors
3.10.2 Pressure and Levels Sensors 3.10.3 Composition Sensor
3.10.4 Pumps and Rotameters 3.10.5 Steam Flow Loop 3.10.6 Column Holdups
CHAPTER THREE
DISTILLATION COLUMN HARDWARE
3.1 INTRODUCTION
A pilot plant scale, atmospheric pressure distillation column had been used in the Department of Chemical Engineering for teaching in under-graduate laboratories. For the reasons noted below, this column was unsatisfactory both in its performance and in its possible application to this project:
(1) reboiler capacity was excessive; (2) condenser capacity was inadequate;
(3} reflux/distillate split was by a swinging bucket reflux divider giving pulsed flows;
(_4) poor tray efficiency ( < 30% overall) ;
(51 insufficient and ineffective control equipment; (6) no on-tray sampling and temperature measurement;
(7}_ no composition measurement; (_8) no centralised control station.
The column was completely dismantled and rebuilt using such parts of the original as were required. The reboiler capacity was reduced, and the condenser capacity increased. The trays were redesigned and re-built to allow feed/drawoff and temperature measurement. The reflux
3.2 REBOILER AND CONDENSER MODIFICATIONS
The reboiler originally consisted of a shell and tube heat
exchanger with ninety-six 19 mm OD type 316 stainless steel tubes 1220 mm long. The overall heat transfer coefficient was measured to be 1600
-2 -1 2
Wm K based on the internal heat transfer area of 5.8 m • Assuming saturated steam in the reboiler chest at 70 kPa, and water on the tube side at l00°C, the maximum energy transfer rate was 140 kW.
Calculation of the maximum likely column performance showed a reboiler capacity of 100 kW to be sufficient. Consequently, twenty-seven of the ninety-six tubes were blanked off using two stainless steel plates clamped across the tube bundle by tie rods through the now unused tubes. This
2
reduced the internal heat transfer area to 4.2 m and gave an energy trans-fer rate of 100 kW based on·the conditions given above. The reboiler was fitted with two safety valves. That on the process- fluid side was set at 70 kPa, and piped outside building in a 50 mm diameter galvanised line. The safety valve on the steam jacket of the reboiler was set at 175 kPa.
The condenser system on the original column comprised one QVF HEU9 and one QVF HEM9 glass heat exchanger with a total heat transfer area of
2
3 m . This system was altered by replaci_ng the HEM9 with two QVF HE9 2
glass hea.t exchangers giving a total heat transfer area of 7 m • For a methanol/water mixture condensing at .70°C, and using cooling water at 20°C, the maximum rate of energy transfer based on the QVF heat transfer
-2 -1
coefficient of 280 Wm K (QVF (1970)_ )_ was 98 kW • Each exchanger was fitted with a valve in its cooling water line to allow manipulation of the condenser capacity to suit the column operating requirements.
The heat transfer equipment in summary was:
(a) Reboiler - shell and tube heat exchanger
- 69 tubes 19 mm OD x 1220 mm 316
s.s.
- internal heat transfer area 4.2 m2
11 h t f ff . ' t 1600 Wm-2K-l - avera ea trans er coe ~c~en
(b) Condensers - QVF glass coil heat exchangers - two HE9, one HEU9 units
2 - heat transfer area 7 m
-2 _;1 - overall heat transfer coefficient 280 Wm K
3.3 TRAY DESIGN
The column trays were redesigned to improve the overall tray
efficiency, and to provide sample/feed ports and temperature measurement. The sample/feed ports were loca.ted directly beneath the downcomers bring-ing liquid on to the tray, in a small chamber below the actual active tray. The chamber was opened to the tray.by two 30 mm diameter and two 17 mm diameter holes. The liquid holdup in the chamber was measured to be
3
160 em . The temperature probes were screwed into the top ring of the tray section, and sealed with PTFE tape. The sensing heads were located as close as possible to the exit weir on the tray to give a close
estimate of the temperature of.the liquid leaving the tray. The trays were assembled between 225 mm diameter x 300 mm standard glass QVF sections giving a tray spacing of 390 mm.
The tray layout is shown in. figure 3-1, and plate 3-1. Summary of Tray Details:
(il active area - 223 x 3 mm D holes on 12 mm triangular spacing - total active area
=
1.6 x 10⁻³m2(iit free area - 225 mm D
- area
(iii)_ downcomers - two, 35 mm D
- area
=
2.0 x 10⁻³m2(ivl weirs 19 mm high
_196P 0
ROLLED RING 19c
3.4 REFLUX ACCUMULATOR
The original column incorporated a swinging bucket reflux divider, which inevitably led to pulsed reflux flows, and in some
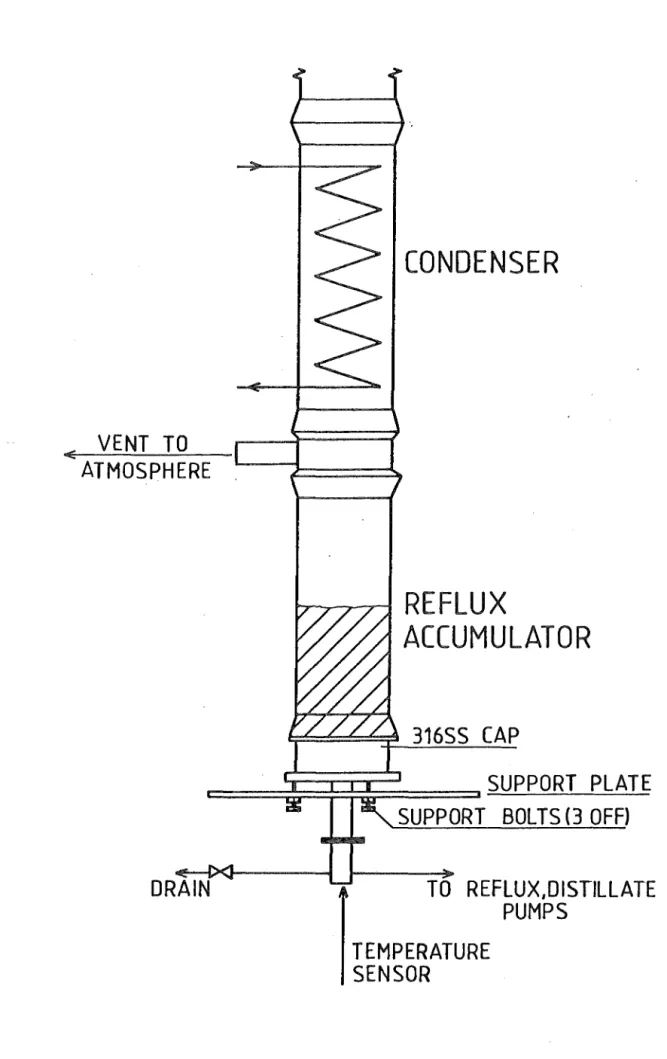
situations to column trays running dry. To correct this situation and to bring the column in to line with standard industrial practice, a reflux accumulator was incorporated. The accumulator was constructed from a standard QVF glass section 600 mm x 225 mm diameter with a type 316 stainless steel cap to seal the base of the accumulator, to support the accumulator and the condensers, and to provide the pipework connect-ions for liquid flows and a temperature sensor.
a maximum liquid holdup of 25 litres.
The accumulator provided Incorporated in the reflux drum was the atmospheric vent for the column to allow air to escape during startup, and to ensure that the column remained close to atmospheric pressure. The 50 mm diameter PVC vent line was piped outside.the building for safety.
The reflux accumulator and vent are shown in figure 3-2.
3.5 CONTROL EQUIPMENT
The previous column operated under the following controls: (il steam pressure control in the reboiler jacket;
(iil reboiler level control by bottoms flow (pneumatic PI
controller and d/p celll;
(iiil reflux ratio control by a QVF swinging bucket.
VENT TO
ATMOSPHERE
CONDENSER
...,._._,__-,.---r--a
R E F L U X
ACCUMULATOR
316SS CAP
TO REFLUX,DISTILLATE
PUMPS
TEMPERATURE
SENSOR
3.5.1 Liquid Flow Control
The standard practice for controlling liquid flow is to use a flow sensor, a controller and a valve in a feedback loop. For the column used in this project, the maximum flowrate of any liquid stream was estimated
-1
to be 4.5 ~min • To get good turndown on the flow loops a flow sensor
-1
was required to handle the range 0.05 - 4.5 ~min • Devices to achieve this accuracy are available but are very expensive, e.g. turbine meters. To have implemented three conventional flow control loops would have been expensive and beyond the project budget.
Speed controllable positive displacement pumps were considered as replacements for the conventional flow loops. The major problem was to find a controllable prime mover to drive the pumps. A positive displacement vane pump, driven by a variable speed motor was selected as suitable based on considerations of cost and ease of construction.
3.5.2 Variable Speed Motor
A survey of currently available equipment showed a lack of a suit-able motor in the 200 W, 0.5 Nm range. Small stepping motors of very limited torque are available, and larger induction motor controls are available, but in between there is a gap. The problem was solved by designing and constructing a stepping motor around a standard Bosch
automotive alternator, driven by a variable frequency three phase inverter. The alternator motor incorporated a number of novel features:
(i) An optically isolated DC signal provided control of the inverter frequency and hence motor speed. A 0-lOV de signal gave a speed range of 0-2000 rpm. The control voltage was conditioned by the input circuit to ensure that the rate of control voltage increase did not
-1
(ii) Sequencing of the inverters was performed using CMOS digital logic.
(iii) A current limiting circuit was incorporated in each phase to prevent overloading of the drive transistors.
(iv) Field excitation of the alternator rotor was achieved using a 12V de. supply feeding 2A through the altern a tor slip rings.
A circuit diagram of the inverter appears in Appendix I.
The combination of the inverter and alternator produced a very useful motor with good low speed torque characteristics, as required by a variable speed positive displacement pump. The torque/speed and power/ speed characteristics are shown in figure 3-3.
The use of slip rings to supply the rotor excitation current
provided an .ignition source, and an explosion risk. This was eliminated by installing each motor in a vented case, continuously purged with air from a fan located outside the building. The continuous flow of fresh air prevented a buildup of explosive vapours within the motor case and helped in cooling the motor.
To ensure that these motor systems were intrinsically safe, an interlocking safety system was installed. A pressure switch in the air purging line ensured that the motors could not operate without the
purging system. Further, for a period of 50 seconds after power on, the motors. were disabled _to ensure that the motor cases were fully purged before applying the excitation supply. Details of this interlocking system are shown in Appendix I.
3.5.3 Positive Displacement Pump
A suitable pump at a reasonable cost could not be found on the local market. A vane pump was designed, this being the simplest type of positive displacement pump to construct.
MAX. PHASE CURRENT=9A
E
z
'
~1,0d
0::: 0
...
TORQUE
3
'
0:::100
w3
0
a..
~----~----~----~~----~~--~0
500
. . . .
1000
1500
2000
2500
SPEED /RPM
FIGURE 3-3 ALTERNATOR-MOTOR
CHARACTERISTICS
w
.
type 316 stainless steel body and rotor, with PTFE vanes and cams. Vane movement was by the action of the cams alone; no springs were used. Initial tests showed the pumps to be satisfactory in most circumstances but some problems did arise.
When operated at elevated temperatures (100°C) the PTFE vanes and cams began to creep and expand causing increased frictional forces and eventually seizing. The solution was to provide larger clearances in the pump when assembling it at room temperature. This solved the seizing problem, but the elevated temperatures also accelerated the wearing of the vanes and the cams. The cams acted as bearings and wore rapidly due to some side loading of the shaft from the pumping action. These problems were overcome by fitting two ball races in a housing outside the pump body to absorb the side loading, and by fitting graphite vanes in place of PTFE.
This final design has proved satisfactory provided the pumps are properly set up for the conditions of operation, i.e.
the bottoms pump was set up for liquids at 100°C1
the distillate and reflux pumps were set up for liquids at 20°C.
The final design is shown in figure 3-4. The pump was connected to the motor described by a flexible coupling. The completed unit is shown in plate 3-2.
3.5.4 Pump Installation
I
;-- c
Sss
s~f
f -
II (1 50mm 1 ALL PARTS 316SS UNLESS SPECIFIED
9lmin-
1 AT 800R.P.M.~
FIGURE 3-4 VANE PUMP
w
.
liquid siphon through the pumps. In addition an 18X rotameter with a koranite float was installed in the delivery line of each pump for easy monitoring of liquid flow rates.
3.5.5 Steam Flow Control
Control of the steam to the reboiler was changed from a pressure to a flow loop so that the loop setpoint could be easily related to the actual steam flow. The layout of the loop is shown in figure 3-5.
The orifice plate was non-standard in both its diameter (19 rom) and in the placement of the pressure tappings, 9 rom either side of the orifice plate, requiring calibration.
Equipment: Controller Control Valve d/p Cell· i/P Converter
3.6 AUXILARIES
Foxboro model 58P4-WV (P+I) 12 rom D Saunders Valve Foxboro 0-625 rom W.G. Foxboro model 69TA-l.
The distillation column was connected to the service lines in the Department of Chemical Engineering and supplied with dry saturated
steam at 550 kPa, compressed air at 550 kPa, and cooling water at 400 kPa and 15-l8°C. Miscellaneous sections of the column are described in the following sections.
3.6.1 The Feed System
The distillation column feed system is shown in figure 3-6. A 270 litre feed tank was installed so that fluctuations in the feed compo-sition caused by changes in the column holdup would be minimal (the average column holdup was 61 litresL. The feed was drawn from the feed tank,
STEAM
550kPa
.SETPOINT--~
10-SOmA
-PNEUMATIC PIPING 6mmD
-CONTROL PNEUMATICS 20-100kPa
PI
CONTROLLER
TO FEED
PREHEATER
1/P
I• ,
'h140kPa
·tc T1
140kPa
r
I• I
~.
I0/P
CELL
<>
DAMPING TANK 225cm3AIR SUPPLY
550kPa
1000mm,30mmiD
ORIFICE PLATE
TO REBOILE
~
II
I
~
19mm0
FIGURE 3-5 STEAM FLOW CONTROL SYSTEM
w
.
AIR
15kPa
INDICATOR
BUBBLER
DRAIN
•
•
•
•
II
OUTSIDE
OISTILLATE,BOTTOMS
'PRODUCT RETURN
FEED TANK
270l
STEAM
175kPa
DOUBLE PIPE
PREHEATER
AREA ,OSml
PISTON PUMP
0 -2lmin-1
FIGURE 3-6 FEED SYSTEM .
TO
COLUMN
w
.
1-'
this work. Liquid from the siphon breaker for the product pumps was returned to the feed tank via a 25 mm diameter line. The tank was also 'fitted with a vent which was pipeq outside the building, and a liquid
level indicator comprising a bubbler and Utube manometer. Details of the feed system:
Feed pump Candy variable stroke piston pump • 0 n • -1
capac1 ty - 2 IV mJJl
all 316 SS in contact with fluid Feed Tank 270 litres
all 316 SS construction Feed Preheater - double pipe exchanger
heat transfer area
=
530 cm2 (internal)control : manual adjustment of steam pressure in outer pipe
316 SS in contact with working fluid.
tube dimensions: .outer 44 mm ID X 1280 mm inner 23 mm ID x 1280 mm Filter - contains 1 rom gauze to remove solid matter.
3.6.2 Product Coolers
The bottoms product was removed from the reboiler at its boiling point, and cooled before its return to the feed tank. The temperature of the distillate product was set by manipulating the condenser cooling
water flows. Each stream was passed through a three stage countercurrent cooling system as shown in figure 3-7. The exchanger details are
tube dimensions : outer 44 mm ID X 1280 mm
inner 23 rom ID X 1280 mm
heat transfer area = 530 em 2 per exchanger stage.
3.7 DISTILLATION COLUMN CONSTRUCTION
COOLING
WATER
TO FEED
TANK
DISTILLATE
DRAIN
TO FEED
TANK
BOTTOMS
DRAIN
ALL EXCHANGERS- DOUBLE PIPE (0.05m
2
)
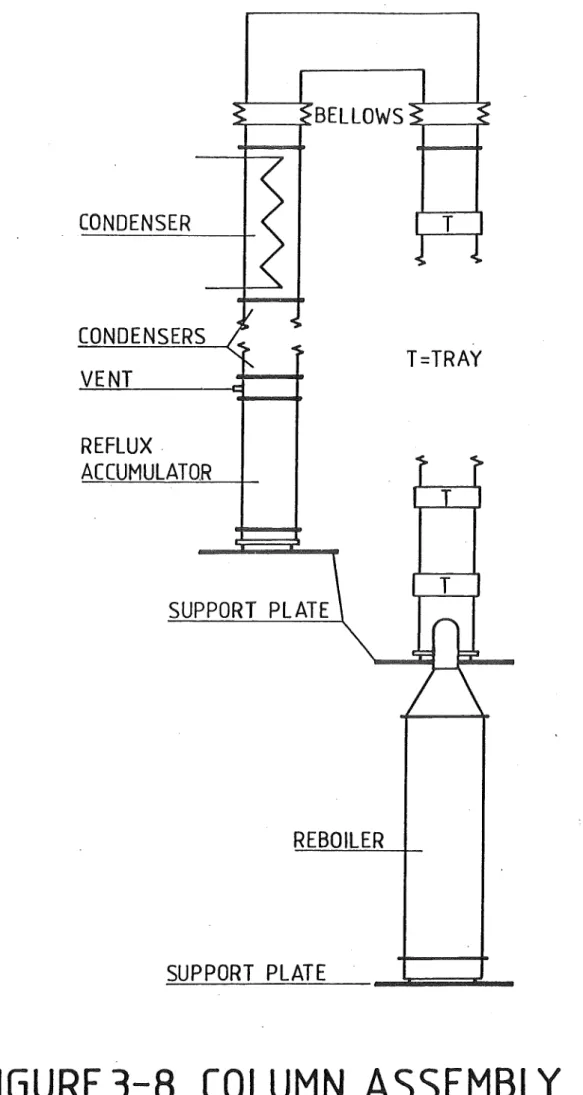
parts o~ the distillation column. The column was mounted in a frame of 50 mm square box section steel and supported on steel plates bolted to the frame under the base of the column, the reboiler, and the reflux accumulator as shown·in figure 3-8. Provision was made on these support plates for adjustment of the column attitude so that the column trays could be set horizontal. The column was only sitting in position,
restrained from moving sideways by the QVF spring loaded fi tti.ngs mounted on the QVF flanges to allow thermal expansion on the startup.
The column was constructed with the condensers and the trays in separa.te vertical columns .beca.use of a lack of headroom. Differential thermal expansion, on.startup, caused problems in joining the two
sections; the tray section was calculated.to expand 3 mm, while the condenser section expansion.was negligible. A bellows was fitted to each section to absorb the stresses generated by the thermal expansion.
The bellows were designed using the axial symmetric bending of an annular plate formulae given by Flugge (1962) , and constructed from six type 316 stainless steel 22 gauge annuli sections alternately welded on the inner and outer edges. A stainless steel section was fabricated to connect the two column sections using the bellows and hydraulically tested to 100 kPa before installation. The completed bellows assembly in place can be seen in plate 3-3. A 60 mm thickness of polystyrene foam plastic was fitted to reduce heat losses through the bellows section. A deflection of 2.5 mm was measured in the tray section on startup, but was accommodated by the bellows.
CONDENSER
CONDENSERS
VENT
REFLUX.
ACCUMULATOR
SUPPORT PLATE
REBOILER
SUPPORT PLATE
T=TRAY
-s
s
19
22
21
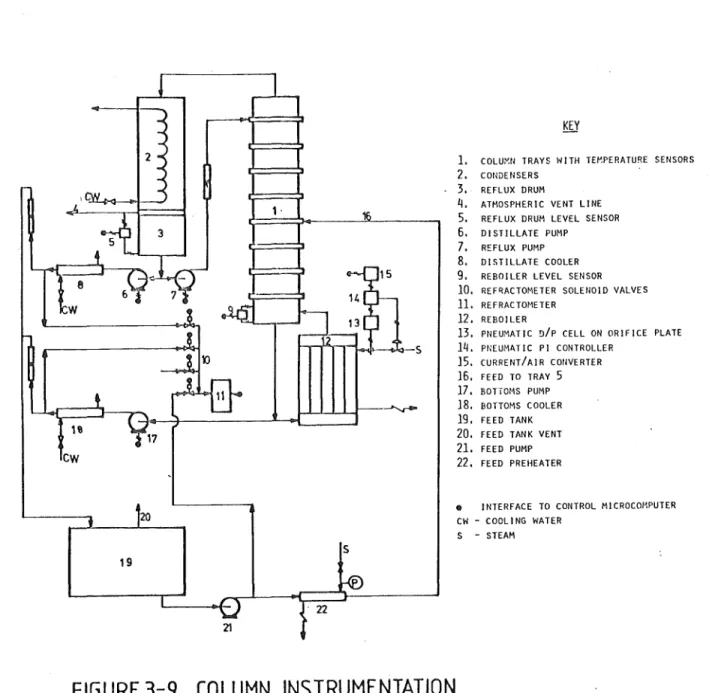
FIGURE 3-9 COLUMN INSTRUMENTATION
KEY
1. COLU~N TRAYS WITH TE~PERATURE SENSORS
2. CONDENSERS
3. REFLUX DRUM
4. ATMOSPHERIC VENT LINE
5. REFLUX DRUM LEVEL SENSOR
6. DISTILLATE PUMP
7. REFLUX PUMP
8. DISTILLATE COOLER
9. REBOILER LEVEL SENSOR
10. REFRACT0f1ETER SOLENOID VALVES
11. REFRACTOMETER
12. REBOILER
13. PNEUMATIC DIP CELL ON ORIFICE PLATE
14. PNEUMATIC PI CONTROLLER
15. CURRENT/AIR COilVERTER
16. FEED TO TRAY 5
17. BOTTOMS PUMP
18. BOTTOMS COOLER
19. FEED TANK
20. FEED TANK VENT
21. FEED PUMP
22. FEED PREHEATER
e INTERFACE TO CONTROL MICROCOI1PUTER CW - COOLING WATER
3.8 INSTRUMENTATION
The distillation column was heavily instrumented to allow flexibility in configuring control strategies. All the instrumentation was
constructed to meet an interface standard of 0-lOV. In some cases this required the provision of signal conditioning circuits.
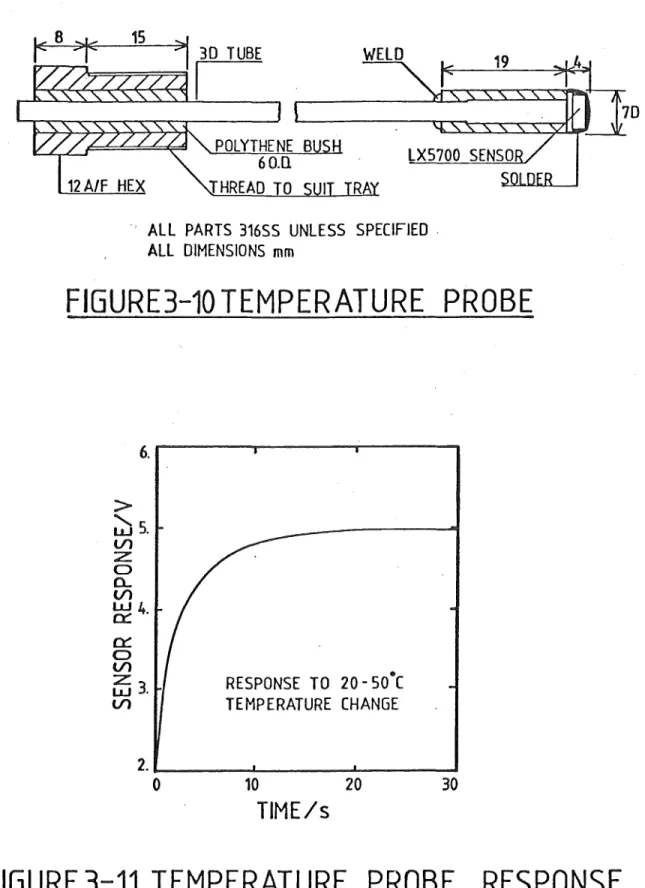
3.8.1 Temperature Measurement
Temperatures were sensed on all trays, in the reflux accumulator and in the feed line using National Semiconductor (1974) LX5700 integrated circuits. These devices have an output of 10 mV °C -1 , and are quoted as having a repeatability of
~
0.2°C and a non-linearity of 1.8°C. To conform to the 0- lOV interface standard, the transducer output was shifted and scaled so that 0°C=
OV and 100°C=
lOV with the circuit shown in Appendix I.The integrated circuits were soldered to 316SS probes as shown in figure 3-10 and plate 3-6, and were electrically insulated from the column tray by a polyethylene bush.
Each. sensor was individually checked in a water bath, and found to exhibit a slightly different characteristic within the manufacturer's specifications. The calibrations showed that the linearity error could be reduced to a maximum of 0.7°C in the range 60- 100°C. Further
accuracy could be obtained by using a calibration for each individual transducer. A typical time reponse of a probe to a step change in·
fluid temperature of 50°C is shown in figure 3-11. The transfer function can be approximated by
G(s) 1 where T
=
2.6s Ts+
13.8.2 Level Sensors
National Semiconductor (19741 int.egrated circuit differential
POLYTHENE B 6 O.[l JHREAD TO
WHO
' ALL PARTS 316SS UNLESS SPECIFIED . ALL DIMENSIONS
mm
FIGURE3-10 TEMPERATURE PROBE
6.
>
'
w5.
V)
z:
0
a..
V)
~4.
~ 0
V) •
~
3.
RESPONSE TO 20- 50 CVl TEMPERATURE CHANGE
2 . .,____ _ _
-'--_ _
___._ _ _
_____.
0 10 20
30
TIME/s
were LX1601DF sensors fitted with rubber socks filled with silicone oil to prevent contact between the sensing diaphragm and the process fluids. Further, to allow remote siting of the sensors away from the process, conventional p~eumatic bubblers were used.
The outputs of the LX1601DF devices were scaled to the range 0- lOV by the circuit shown in Appendix L The response of the sensor was reported as 2.5- 12.5V for ± 35 kPa by the manufacturer
(National Semiconductor (1974) l with a repeatability of ± 2% of the span. The sensitivity of the sensor can be calculated as:
± 35 kPa = ± 3.57 m W.G.
± 2% of span
=
± .02 x 7.14 m W.G. :::: ± 0.14 m W.G.the temperature coefficient.of the LX1601DF was negligible. However in practice, the LX1601DF was found to be more sensitive than the worst case figure of ± 0.14 m W.G. A short term resolution of ± 0.02 m W.G. was.observed with a longer term drift in the range ±0.07 m W.G. occurring over a period of 8- 10 hours. This long term drift could prove to be a problem in circumstances where tight level control is required.
The sensor on the reboiler level was operated in true differential form, while the reflux accumulator level sensor used atmospheric pressure as a reference. The level sensors arrangement is shown in figure 3-12.
3.8.3 Pressure Sensor
Overall column pressure drop was sensed from the upper pressure tapping point of the reboiler level sensing system to atmospheric pressure. A National Semiconductor differential pressure sensor, the LX1601DF, was used, and the same comments made for the level sensors apply. This sensor was used to detect malfunctions in the column
AIR 15kPa
TO LEVEL SENSOR
REFLUX ACCUMULATOR
TO PUMPS
AIR 15kPa
TO OVERALL P ESSURE SENSOR
I
TO LEVEL SENSOR
!
AIR 15kPa
SIGHT GLASS
TRAYS
!
LIQUID
TO REB OILER3.8.4 Composition Sensor
A Phillips OKOMETER R industrial in-line refractometer was
installed on the original column to monitor distillate product composit-ion. The refractometer was modified and recommissioned to measure the composition of four methanol/water liquid streams.
The OKOMETER R was an in-line instrument and operated as follows: two parallel light beams of equal intensity were chopped with a rotating segmented plate and passed through the sampli_ng cell and the reference cell respectively. A condenser lens focussed both beams on to a photo-tube; if the beams were of equal intensity there was no ac output from the phototube. If, however, there was some absorption in the sample cell, the intensity of the two beams was no longer equal and th.e resulting alternati_ng current produced by the phototube was amplified and rectified to give a de output signal. Within the sample cell, the light beam was bent so as to strike a sample liquid/glass prism interface at a constant angle. At the interface some of the light was reflected, and some was refracted into the sample liquid and absorbed. The change in light intensity of the beam leavi.ng the cell was a measure of the amount of refracted light (and hence the refractive index of the sample liquid) , and was measured by comparison with the. light beam passing through the sample cell. The liquid sample stream passed through a heat exchanger which controlled the.sample temperature. A thermostatically controlled water bath supplied the heat transfer.medium to the heat exchanger. ·The interior of the instrument containing the cells, optics and electronics was also maintained at a constant temperature by a temperature controller with a fan for air circulation. Further details of the OKOMETER R can be
found in the Phillips instruction manual.
shown in Appendix I. The output of the refractometer amplifier (0-200~A
d.c.) was scaled to 0-lOV d.c. by the amplifier shown in Appendix I. Additional filtering was introduced into this amplifier to reject low frequency noise in the refractometer output signal due to bubble form-ation in the liquid sample streams, and tQe optical chopper. The filter used was a first order lag with a corner frequency of approximately 0.15Hz.
The optical syste~ of the OKOMETER R was found to be unsatisfactory for the methanol/water system used in the distillation column. The
reference cell contained a coloured filter _(green) which absorbed too much of the light passing through the reference cell. In order to balance the cell, i t was necessary to almost completely block off the sample cell with the zero diaphragm, and this in turn caused problems
with poor focusing of the light beams on the phototube. Removing the fil te: from the reference cell and placing a green perspex filter in both the sample and reference light beams allowed better focusing on the phototube and de-sensitised the. zero diaphragm mechanism.
Temperature control of the sample stream was found to be very important as shown in Appendix II. The sample stream was cooled/heated in a heat exchanger comprising 1.7 m of 3 mm ID stainless steel tubing. The cooling/heating was controlled by water from a thermostatically controlled water bath pumped over the heat exchanger tubing. The water bath was controlled by an on/off solid state relay switched by a mercury/ glass thermometer. The sample temperature was measured by an LX5700 integrated circuit sensor mounted in the outlet line of the refractometer. This device used a signal conditioning circuit similar to that described in Appendix L
The construction of the refractometer and its auxilaries is shown in figure 3-13, and the installation of the refractometer is shown in figure 3-9.
DISTILLATE (0,0)
1.0)
REFERENCE (1,1)
SOUNOJD CONTROLLER
THERMOSTAH:D WATER BATH
'I >I REFRACTOMETER
HtAT tXCHANGE R
LX5700 TEMPERATURE
SENSOR
TO FEED TANK
COOLING WATER
0-200uA 1 AMPLIFIER
FIGURE3-13 ON-LINE REFRACTOMETER
0-iOV
w
N
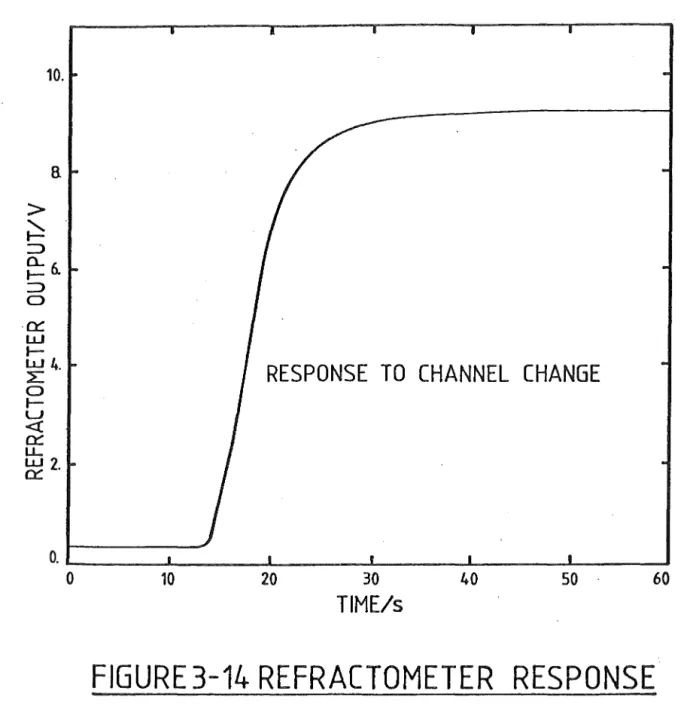
that a sampling schedule could be formulated. "A typical response of the refractometer to a channel chapge is shown in figure 3-14. Using the method of Sundaresan and Krishnaswamy (19781, a transfer function was
fitted to this.response:
G(sl
=
Ke-15 .6s
3.7s
+
1 (_in seconds)The minimum time between channel changes was chosen to be 60 seconds to allow for the dynamics of the sampling system.
3.9 SELECTION OF A BINARY SYSTEM
A number of important factors were considered in selecting a binary system for the distillation column. Methanol and water were chosen on the basis of the.following points:
Cil Safety - a low toxicity, low risk of explosion system was required beca.use the column was located in a hazardous area, and because the column would be operated by undergraduate students in the future. Methanol/water while having some toxic effects is regarded as safe. A Pye gas detector was set to alarm when the concentration of methanol in the air reached 1.5% (_25% of the lower explosive limit of methanol in airl.
(_iil Properties - methanol/water mixtures do not exhibit constant relative volatility nor constant molal latent heat of vaporation and can be described as non-ideal. Methanol is completely miscible in water and does not form an azeotrope.
(_iii} A number of other researchers have used methanol/water with similar columns, and by using the same binary system, some comparisons were possible between published results and experimental work. The
separation of methanol from water ·is performed commercially by distillation to recover methanol e .• g. in the manufacture of formaldehyde.
10.
a
>
~
::::>
~6.
::::> 0 0:::
w
I -W4.
::£
0
1-LJ
<( 0:::
LL
~2.
RESPONSE TO CHANNEL CHANGE
0 . ..__ _ _ ..._ _ _ ..._ _ _ . . . & - -_ _ . . L - -_ _ . . L - -_ _ _ _ _ _ ,
0 10
20
30TIME/s
40
50
60
TABLE 3-1
SPECIFICATIONS OF METHANOL/WATER
Methanol:
Appearance - clear, colourless, free from suspended matter and sediment.
Purity - water < .05% wt
- aldehydes and ketones < .. 003% wt as acetone - alkalinity
<
.0005% wt as ammonia- acidity < .003% wt as acetic acid - sulphur < .0005% wt as sulphur
Water: Distilled in a Manesty still.
3.10 COMMISSIONING
Prior to assembly of the column components, all sections were thoroughly washed in a trichloroethylene bath, and scrubbed with boiling water to remove all traces of cutting oil and any remaining residues from
the old column. Once assembled the column was twice filled with
distilled water and operated at total reflux. During this operation the flanges and joints were checked and the operation of the bellows section described in section 3.7 was checked.
The column was then loaded with 87.5 litres of methanol (70 kg) and 40 litres of distilled water (40 .kgl.
instruments and controls then commenced.
3.10.1 Temperature Sensors
Commissioning of the
Calibration of the sensors described in 3.8.1 was carried out in a stirred water bath using mercury-in-glass reference thermometers. An
second order polynomial which gave a maximum discrepancy between the fitted line and the data points of 0.2°C. This small deviation could be attributed to the errors involved measuring the true temperature during the calibration procedure and was within the manufacturer's repeatability specification. The calibration data, and the fitted quadratic correlations are given in Appendix II.
3.10.2 Pressure and·Level Sensors
These devices were installed and operated as described in sections 3.8.2, 3.8.3. The desired operating levels were set up in the c~lumn
and the level sensor readings were noted and used as setpoints in the level control loops. Calibration of the level sensors over a wide range was not necessary. A similar procedure was adopted to find the upper and lower limits on the overall column pressure drop to be placed in the alarm detecting software. The limits were chosen based on the overall column pressure drop existing when the column was operating at its desired state.
3.10.3 Composition Sensors
The OKOMETER in-line refractometer was installed and checked out according to section 3.8.4. This refractometer was calibrated against an Abbe refractometer (Carl Zeiss No. 202553) which had been checked with solutions of known concentration at several temperatures. These results are listed in Appendix II.
The operating temperature of the refractometer was chosen to be 25oc as a compromise between the h ea 1ng coo 1ng capacity of the refracto-t'
1
1' meter thermostat and the temperatures of the liquid sample streams(~istillate : 20°C, bottoms : 35°C). At 25°C, the thermostat maintained an approximate 50% on/off duty cycle.
.40 mole fraction methanol of known composition and refractive index. Havi.ng selected the refractometer reference channel, the procedure was to switch between the two references, adjusti.ng the zero point on pure methanol and the span on the mixture, until the voltage output.settled at those levels determined from the calibration in Appendix II. This tedious procedure was necessary to ensure that the refractometer readings were correct. Reproducibility checks on the Okometer refractometer showed i t to be capable of measuri.ng the compositions of the column
products within ± .004 mole fraction. Its performance on measuring feed composition was much less satisfactory due to the very steep nature of the calibration chart over the feed composition range. The error in the feed composition was estimated to be ± 0.020 mole fraction.
Close temperature control was found to be important as the
refractive index is a strong function of temperature as shown in Appendix II. The Okometer thermostat was found to control within ± 0.2°C, and ,using the refractive index da.ta in Appendix II, this was predicted to
cause a variation in the estimated composition of approximately ± 0.004
m.f. This error combined with the errors in the calibration chart formed the final estimate of ± 0.004 m.f. on the estimated composition for the ranges 0.0 to 0.20 m.f. and 0.80 to 1.00 m.f. The likely error on the feed composition estimate was found to be considerably higher -of the order -of± 0.02 m.f., hence all feed composition measurements were cross checked against density measurements with a density bottle, off-line.
Operation of the Okometer refractometer required careful attention to setting up and calibration. It was necessary to allow at least four hours for the air thermostat to bri.ng the refractometer case and
up in accordance with the procedures outlined in this section, the refractometer could be relied on to.· give good estimates of tops and bottoms composition for periods of up to·12 hours • After this, checks . against the standard solutions were required to prevent small drifts
causing measurement errors.
3.10.4 Pumps and Rotameters
Some .modifications were required before the variable speed pumps would work reliably. Once the individual pumps were correctly setup according to their conditions of operation, they behaved well. A small problem with the reflux pump wa.s the. gradual. drift in flowrate with time for a consta.nt rotational speed. This drift was small but contin-uous and was thought to be due to wear and movement in the vanes and cams system of the pump resulting in slipp.age. The head on the delivery
side of the pump was increased by fitting a 200 mm length of 3 mm diameter stainless steel tube inside the discharge line. This flow restriction increased the back pressure on the pump~ required a higher rotational speed for a given flowrate, and steadied the drift problem. The pump flowrate was also found to be suction head dependent due to some flow inadequacies in the pump design. Precise regulation in the level controllers held the suction pressures constant and minimised this problem. For the reflux pump, reliable constant flows could be main-tained for periods up to four hours. The stability of the distillate and bottoms pumps was less cri tica.l as these were generally operating in the level control loops under feedback control.
The rotameters in the discharge lines of the three pumps were calibrated using water at 20°C because the calibration charts recommended by the manufacturer (Rotameter (1960)) were inaccurate due to inconsist-encies in the shape and mass of the floats. Corrections for changes in liquid composition and temperature were estimated using the correlations given by the manufacturer (Rotameter (1~60)).
corrections are given in Appendix II.
3.10.5 Steam Flow Loop
The steam flow loop was installed as described in section 3.5.5. The capacity tanks were fitted to the output lines of all the pneumatic devices to prevent the pumping action which effectively upset the control action and threatened to destroy the control valve. The tanks supplied sufficient capacity to damp out this .action. The d/p cell was set up so its range matched the available steam flow range with the steam reducing·valve set at 275 kPa. The PI controller was tuned to give a reasonably fast response to setpoint changes while maintaining a steady flow without large valve movements for load changes. The best sett~ngs
were found to be: proportional band = 150% reset time ;::: 11 min.
The response time of the steam flow control loop was almost instantaneous
3.10.6 Column Holdups
Holdups within the column were measured where possible and calcu-lated otherwise •. The reboiler holdup at normal operating conditions was found to be 40 litres. The maximum reflux accumulator holdup was found to be 25 litres but for -most operating conditions, a level of 300 rom corresponding to a holdup of 12 litres was used. Tray holdups were calculated based on an average liquid depth on the tray equal to the height of the weirs, and a maximum backup of 100 rom in the downcomers. The results are summarised below in Table 3-2.
Measured Holdups
Calculated Holdups
Total Column Holdup
TABLE 3-2 COLUMN HOLDUPS
Reboiler
Reflux Accumulator Tray
Feed Tank
40 litres 25 litres 1.1 litres 270 litres
4.1 4.2 4.3 4.4 4.5 4.6 4.7
CHAPTER FOUR COMPUTER SYSTEMS
'CONTENTS Introduction
Analog Controllers Microcomputer
Microcomputer/Process Interface 4.4.1 Data Acquisition System 4.4.2 Control Outputs
4.4.3 Timing
Microcomputer Development System 4.5.1 Development of System Hardware 4.5.2 Interface Software
4.5.3 Software Development 4.5.4 Software Debugging. Arithmetic Processing Unit
4. 6. 1 Interfaci.ng the APU to the M6800 CPU 4.6.2 Operating the Am 9511 APU
4. 6. 3 Am 951LAPU Performance
CHAPTER FOUR
COMPUTER SYSTEMS
4.1 INTRODUCTION
The computer system developed for this work was designed to be as flexible as possible and to allow a number of different configurations. A microcomputer with perip~erals and process interface was used as a software development system, and a control system. A PDP-11 mini-computer in the Department of Chemical ~ngineering was connected to the microcomputer to provide program development facilities for the micro-computer, mass storage, utility routines, and a hierachical control scheme. Simple analog prqportional only controllers were constructed to provide limited control functions and hardware signal filtering.
Software was written to allow the microcomputer to control its peripherals and the process instruments, and to allow the minicomputer to control the microcomputer. The computational capability of the micro-computer was extended by the addition of a hardware arithmetic unit.
Programs were developed in the minicomputer and then downloaded to the microcomputer for debugging and implementation. A cross-assembler was written to produce code for the M6800 microprocessor. All software operating in the microcomputer was developed using this system.
4.2 ANALOG CONTROLLERS
Four analog proportional only controllers with adjustable setpoints, gains, filter constants and output biases were constructed. The control-lers were used to maintain the material balances within the column, when operating without computer control. A circuit diagram of the controllers is shown in Appendix I.
outputs to prevent rapidly changing outputs causing the speed control-able pump motors to lose synchronisation. The other two controllers were set up with zero setpoint, unity. gain and zero bias to serve as filters for the two liquid level signals in the reflux accumulator and the reboiler.
The filter built into each controller was a lag unit operating as a low pass filter. The first order lag unit was constructed after a circuit by Bristow (1972). A series of sinusoidal inputs to the filter established that the filter did approximate a first order lag. The filters on the liquid levels signals were adjusted to a time constant of 5. 5 seconds, corresponding to a· corner frequency of 0. 03 Hz . This filtering proved very satisfactory in smoothing the noise in the liquid level signals caused by liquid agitation.
4.3 MICROCOMPUTER
The microcomputer was constructed around.an·American Microsystems Inc. EVK300 prototyping single board computer. This board used a
Motorola M6800 8 bit microprocessor. The major features of the board are summarised in Table 4-1. The prototyping system memory was expanded by the addition of two 4K byte read/write memory (RAM) boards, and two 4K erasable programmable read-only memory (EPROM) boards (using M6834 EPROMS). This gave a total memory complement of lOK bytes of EPROM and 9K bytes of
RAM.
Interfacing to the distillation column was organised thro.ugh a
TABLE 4-1
AMI EVK300 PROTOTYPING SINGLE BOARD COMPUTER
M6800 CPU operating at 1 MHz
3 peripheral interface adapters (PIA), each with two 8 bit I/0 ports and four control;'handshaki.ng lines
1 asynchronous communication interface adapter (ACIAl serial interface, RS232 and 20mA current loop, operating at
110 - 9600 baud
lK read/write memory CRAMl
2K read-only-memory (ROM} containing a small operating system (PROTO) and a collection of subroutines (RS3l
2K erasable programmable read only memory ·(EPROM) organised as 4xM6834 chips
EPROM programmer (handling M6834 EPROMS)
Fully buffered address,data and control busses to allow for system expansion
An internal timer providing pulses at lOO]ls and lms intervals (used by the EPROM programmer}
Three types of direct memory addressing (DMA) - halt processor, cycle steal, and multiplex mode.
The 20 rnA current loop serial. port on the EVK300 board was used to control and communicate with the microcomputer. An interface from the PDP-11 minicomputer.was connected to this port to allqw communication between the two machines. Alternatively, a visual display unit (VDUl was attached to the port for direct interaction with the microcomputer.
Five output control lines from the three PIAs on the EVK300 board were connected via transistor drivers to front panel light emitting diodes
unit as described in section 4.6.
The microcomputer was assembled in
a
480 mm rack-mounting case with the printed circuit boards arranged horizontally. A backplane construction was used with the printed circuit boards mounted in sockets, wire wrapped together to form the backplane. This allowed maximumflexibility in adding to the system;. the EVK300, RAM memory, EPROM memory and APU boards all had different pin connections.
The assembled microcomputer dissipated approximately 50 W into its case, and a cooling system was necessary. A 100 mm diameter fan was mounted in one side of the case and arranged to draw air through a cloth filter on the opposite side of the case, across the printed circuit boards. The integrated circuits (especially the RAM chips) operated at a reasonable temperature (35°C} .
Power for the microcomputer was supplied by a single power supply mounted externally to the case. The circuit diagram of the power supply is shown in Appendix I. The SV regulator had current limiting protection up to a maximum of lOA and an overvoltage trip out. The regulator was based on a conventional series regulator design. The ± 12V supplies were rated at l.SA maximum and also had current limiting protection. A -50V supply was included for EPROM. pr.ogramming on the EVK300 board.
4.4 MICROCOMPUTER/PROCESS INTERFACE
The microcomputer interface to the distillation column and instru-ments was used to monitor process variables and set controls. All
MICRO
BUS
PIA
START SCAN DATA READY
8
PIA
8
PIA
8
[81
DAM.
0/A
0/A
16
INPUT CHANNELS
0-10V
0-10V
0-10V
TO REFRACTOHET'ER TTL
0,1Hz .
CLOCK
0-10V
10 -SOmA
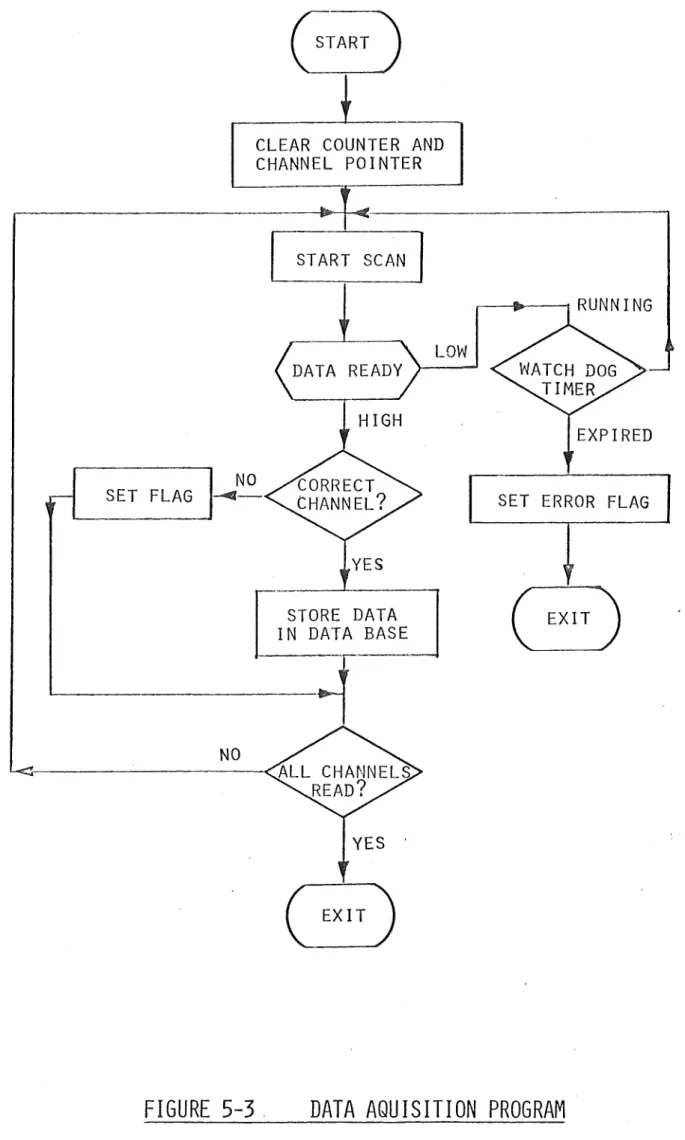
4.4.1 Data Acquisition System
A Burr Brown SDM853 data acquisition module (DAM) was used to monitor the process variables. This unit was a hybrid package contain-ing a sixteen channel multiplexer with control logic, a scalcontain-ing amplifier, a sample and hold unit, and a twelve bit analog-to-digital converter with control logic.
The DAM for this application was configured to operate in one of the four switch selectable modes described in Table 4-2 by the addition of some discrete logic to the basic module.
unit appears in Appendix I.
A circuit diagram of the
TABLE 4-2
DATA ACQUISITION SYSTEM
Modes of Operation:
I (1)
(_2)_
(31
C4t
Computer Run
Computer Hold Manual Run
Manual Hold ·
To sample all sixteen channels sequentially once, and stop.
To sample the current channel once and stop. To adva.nce to the next channel and sample i t on depression of the push-to-convert button. To sample the current cha.nnel on depression of the push-to-convert button.
Features:
Input ranges ± 2.5V, ± SV, ± lOV, 0-lOV, 0-SV Variable scan frequency from 0 to 10 kHz Sixteen single input channels
Channel roll over: channel 0 follows channel 15
LED front panel to display the twelve data bits (red), and four channel identification bits (green)