Application of High Tension Roll Separator for the
Separation of Titanium Bearing Minerals: Process
Modeling and Optimization
Srijith Mohanan*, Sunil Kumar Tripathy, Y. Ramamurthy, C. Raghu Kumar Tata Steel Limited, Jamshedpur, India
Email: *[email protected]
Received April 20,2012; revised May 23, 2012; accepted June 3, 2012
ABSTRACT
The High Tension Roll Separator (HTRS) is one of the main electrostatic unit operations employed to separate titanium minerals like ilmenite, rutile and leucoxene which behave as conducting from zircon, sillimanite, garnet and monazite which behave as non-conducting minerals when a high potential difference is applied. Three process inputs, namely roll speed, feed material temperature and roll speed have been optimized. Experiments were conducted based on the Box- Behnken factorial design; the results were analyzed using response surface methodology (RSM). A new term, called Operational Quality Index (OQI) has been defined as a process output, which is maximized by quadratic programming, to obtain the optimum operating conditions. The maximum value of OQI obtained under the constraints of grade >96% and recovery >98% is 195.53, at the following operating conditions—Temperature: 102˚C, Feed Rate: 1.75 tph and Roll Speed: 132 rpm. Under these conditions, the grade and recovery obtained are 96.6% and 98.9% respectively.
Keywords: High Tension Roll Separator; Response Surface Methodology; Titanium; Box-Behnken Design
1. Introduction
Significant research has been dedicated, over the past de- cade, to enhance plant performance and efficiency to economically concentrate titanium bearing minerals from beach sand deposit. The heavy mineral industry employs different unit operations, in series, to produce high grade titanium minerals (ilmenite, rutile, etc.), with the focus on maximizing recovery, along with the quality. The High Tension Roll Separator (HTRS) is one of the main electrostatic unit operations employed to separate con- ducting from non-conducting fractions. Titanium mi- nerals like ilmenite, rutile and leucoxene behave as con- ducting whereas zircon, sillimanite, garnet and monazite behave as non-conducting minerals when a high potential difference is applied.
HTRS are conventional ionizing field separators utiliz- ing a grounded roll to neutralize the charge of the feed material, when passed through high voltage ionizing field. The conducting particles lose their charge to the grounded roll and follow a trajectory depending on the centrifugal force developed by the speed of the rotor. The non-con- ducting particles are pinned to the roll, transported fur- ther and removed by mechanical means like brush or by high voltage AC wiper [1-5]. HTRS is of two types —static and dynamic. The operation efficiency of HTRS
depends on the suitable selection of process variables at which the response reaches its optimum, in this case the maximum value. In the present work Response Surface Methodology (RSM) has been used as the optimization tool. This has been widely used as a dependable method of process optimization [6-10]. “Design of Experiments” strategies are available in literature, to be used based on the objective of the work, such as randomized block de- signs [8,10]. For evaluation of process variables, the two level factorial designs together with response surface methodology has been used because these techniques use factors with more than three levels, and in this way they can establish quadratic models using central composite, Box-Behnken and Doehlert design [6].
The Box-Behnken design followed by the use of RSM has been proposed for the present study. RSM has been widely used for modeling and optimization of process parameters, in particular chemical and pharmaceutical systems [11-18], with limited application in the field of mineral processing. A basic understanding of the factors that influence the separation in a HTRS is well estab- lished from classical works [19-21]. In mineral pro- cessing, grade and recovery are the important output pa- rameters which will designate the efficiency of the pro- cess/separation with variable process inputs. Maximizing these two variable outputs should be the basic aim of any
research in the field of mineral processing.
The HTRS parameters that affect the separation are the roll speed, feed rate, temperature of the feed material, intensity of the applied potential, splitter division plates, humidity, the feed characteristics such as mineral surface condition, and feed size distribution [1,2]. In the current work, an attempt is made to optimize three process vari- ables of prime importance, namely roll speed, feed rate and temperature of the feed, which are predicted to play a significant role in concentrating titanium minerals (ilme- nite, rutile, etc.). In any process plant, under a given set of operating conditions, the grade and recovery are fixed and it is a well-established knowledge that both grade and recovery are inversely related. High grade material can be obtained with very low recovery, which may not be desirable. The reverse of this also holds true. To circumvent this problem, it is proposed to create an index that represents the grade and recovery obtained under the same operating conditions. The value of the process para- meters that maximize this index are the true optimum operating conditions. Optimization studies are carried out by using quadratic programming by the mathematical software package MATLAB 7.1.
Response Surface Methodology
Response Surface Methodology (RSM) is collection of statistical and mathematical methods that are useful for modeling and analyzing problems. In this technique, the main objective is to optimize the response surface that is influenced by various process parameters. The RSM also quantifies the relationship between the controllable input parameters and the obtained response surfaces [4].
The design procedure of RSM is
1) Designing of a series of experiments for adequate and reliable measurement of the response of interest.
2) Developing a mathematical model of the second order response surface with the best fittings.
3) Finding the optimal set of experimental parameters that produce a maximum or minimum value of response.
4) Representing the direct and interactive effects of process parameters through two and three dimensional plots.
If all variables are assumed to be measurable then the response surface can be expressed as:
1, ,2 3 k
y f x x xx
1 2 0
1 1 1 2
k k k k
i i ii i ij i j
i i i j
y x x x x
(1) where y is the output of the system, and xithe variables
of action called factors.
The objective is to optimize the response y with an as- sumption that the independent variables are continuous and controllable through the experimentation. It is also required to find a suitable approximation for the true fun- ctional relationship between independent variables and the response surface, typically a second-order model is
utilized in response surface methodology [7,22,23].
Y bX
(2)
where x1, x2, ... , xk are input factors which influence the
response y; β0, βii (i = 1, 2, ..., k), βij (i = 1,2, ... k; j = 1,
2, ..., k) are unknown parameters and ε is a random error. The β coefficients, which should be determined in the second-order model, are obtained by the least square method. Generally Equation (2) can be written in matrix form.
1b X X X Y
(3) where Y is defined to be a matrix of measured values, X
to be a matrix of independent variables. The matrixes β
and ε consist of coefficients and errors, respectively. The solution of Equation (3) can be obtained from the above matrix equation as
(4) where X' is the transpose of the matrix X and (X'.X)−1 is the inverse of the matrix X'.X. The coefficients, i.e. the main effect (βi) and two-factors interactions (βij) can be
estimated from the experimental results by computer simulation programming applying least squares method using MATLAB 7.1.[6,22,23].
2. Materials and Methods
2.1. Materials
TABLE 1. SIZE DISTRIBUTION OF FEED SAMPLE.
Mesh size (µm) Weight (%) Cumulative weight % passing
−600 + 500 7.6 100
−500 + 425 15.8 92.4
−425 + 355 22.1 76.6
−355 + 250 17.2 54.5
−250 + 125 11.8 37.3
−125 + 100 6.1 25.5
−100 + 75 3.9 19.4
−75 15.5 15.5
View within article
Figure 1. XRD pattern of the mineral sand sample (✚: ilmenite; : sillimanite; : rutile; •: zircon; ■: quartz; ▲: garnet; and ♦: monazite).
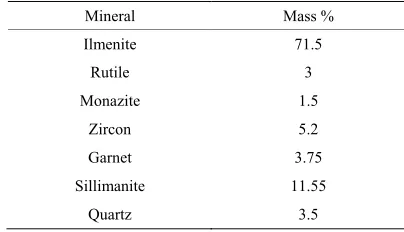
zircon, garnet, sillimanite and quartz minerals are present in minor quantity. The mineralogical studies were carried out for the sample using a Leica petrological optical mi- croscope, to quantify the different minerals. The minera- logical assemblage of the feed sample has been tabulated in Table 2. From Table 2, it is observed that the feed sample contains 74.5% of titanium bearing minerals such as ilmenite and rutile as conducting minerals and remain- ing minerals such as monazite, zircon, garnet sillimanite and quartz are non-conducting.
2.2. Experimental Work
The sample was then prepared for experiments using HTRS by initial desliming using cyclone test rig, fol- lowed by gravity concentration with spirals to achieve about 90% heavy mineral concentrate, containing tita- nium bearing minerals like ilmenite, rutile and leucoxene, while non-conducting minerals include garnet, zircon, silimanite, monazite, other heavy minerals like pyrox- enes and amphiboles together with free quartz. Close sized sample of −500 + 125 microns was prepared and used for all the experiments. A typical HTRS experiment involved the following sequence steps:
[image:3.595.55.290.102.381.2]1) Pre-heat the sand to the desired temperature. 2) Start the HTRS rotor and apply voltage.
TABLE 2. MINERAL COMPOSITION OF FEED SAMPLE.
Mineral Mass %
Ilmenite 71.5 Rutile 3 Monazite 1.5
Zircon 5.2 Garnet 3.75 Sillimanite 11.55
Quartz 3.5
3) Finally, start the feeder while adjusting the splitter position.
The experimental program was designed to achieve better quality and quantity by suitably selecting the pro- cess variables. All the experiments were conducted on laboratory model HTRS (MDL Australia make). The val- ues along with levels of three independent process vari- ables—temperature (X1), feed rate (X2) and roll speed (X3) —that have been used in this study are given in Table 3. All other parameters are kept constant throughout the experiments. The results obtained were used for the computer simulation programming applying least square method.
The levels are chosen to be in sync with plant opera- tion data. The feed rate is suitable for the laboratory —scale HTRS of 250mm diameter. Below 100˚C, mois- ture is retained which affects the separation and heating above 140˚C, leads to undesirable wastage of energy.
3. Results and Discussion
A three factor, three levels Box-Behnken design was used to determine the responses such as grade and reco- very of the conducting minerals. For any experiment, we calculate the grade and recovery as process outputs. However, since these two are inversely related, maxi- mizing any one would not represent the optimum operat- ing condition. Hence it is proposed to define a new index, Operational Quality Index (OQI), given by,
Assay value of product %
Yield% * Assay value of the product % Assay value of the feed
OQI
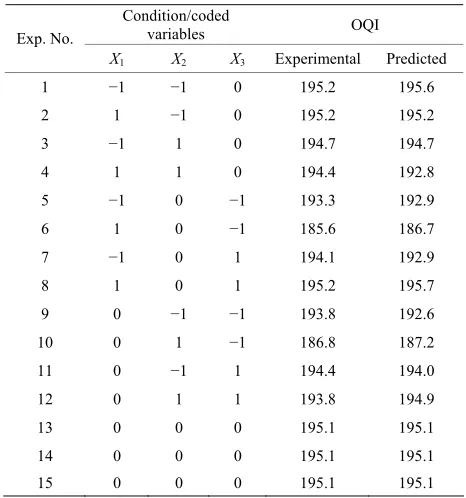
The ideal separation in mineral processing would have an OQI value of 200. However, in all “real” separation practices, OQI would be less than this value. The operat- ing conditions that maximize OQI under constraints are the actual optimum operating condition for the unit op- eration. The experimental values of OQI obtained from factorial (Box-Behnken) designed experiments are tabu- lated in Table 4.
TABLE 3. PROCESS VARIABLE VALUES AND LEVELS.
R2 = 0.9144
184.0 186.0 188.0 190.0 192.0 194.0 196.0 198.0
180.0 185.0 190.0 195.0 200.0
Experimental OQI
Predicted O
Q
I
Levels and codes S.No Variables
(−1) (0) (+1) 1 Temperature in ˚C (X1) 100 120 140
2 Feed rate in tph (X2) 1.5 2.0 2.5
[image:4.595.55.288.201.450.2]3 Roll speed in rpm (X3) 120 150 180
TABLE 4. FACTORIAL DESIGN AND OQI VALUES.
Condition/coded
variables OQI
Exp. No.
X1 X2 X3 Experimental Predicted
1 −1 −1 0 195.2 195.6
2 1 −1 0 195.2 195.2
3 −1 1 0 194.7 194.7
4 1 1 0 194.4 192.8
5 −1 0 −1 193.3 192.9
6 1 0 −1 185.6 186.7
7 −1 0 1 194.1 192.9
8 1 0 1 195.2 195.7
9 0 −1 −1 193.8 192.6
10 0 1 −1 186.8 187.2
11 0 −1 1 194.4 194.0
12 0 1 1 193.8 194.9
13 0 0 0 195.1 195.1
14 0 0 0 195.1 195.1
15 0 0 0 195.1 195.1
calculated for each experiment in order to verify the mo- del equation and the second order response functions representing the conducting minerals are expressed as functions of the independent process parameters. The calculated model equations for grade (y1), recovery (y2) and OQI (y3) of titanium bearing minerals in the con- ducting fraction, on the basis of coded variables are given in Equations (5), (6) and (7) respectively
2
3 1
2 2 3
0.1 0.275 x x 1 1 2 2 1
96.4 0.24 1.11 0.525 0.025
y x
x x x
x x
2 3
2
3 1 2
3.37 0.05 x x (5) 2 1 2 2 1 2
1 3 2 3 94.73 1.09 1.13 0.09 0.47 2.89 2.22 1.86
y x
x x x
x x x x
x x 2
2 2 2
2 3 2 3 5 2.89 1.59 x (6) 3 1 3 1
1 2 1 3 195.13 0.85 1.13
2.26 0.19 0.0 0.075 2.22
y x
x x x x
x x
x x x x
(7)
A comparison between the predicted values of OQI from Equation (7) and experimental results are made in
Figure 2, whichshows that predicted values and the ob-
Figure 2. Relation between predicted and observed OQI of titanium minerals in the conducting fraction.
served data points are in very good agreement (R2 of 0.91).
In order to check the adequacy of the model in terms of classical statistics, a plot of predicted values vs. re- siduals is made. As discussed by Montegomery [12],
there is no relation between the predicted values and the residuals (Figure 3). In addition, a plot of cumulative normal probability as a function of predicted values is made, showing a satisfactory linear relationship (Figure 4).
Effect of Variables on OQI of Conducting Minerals
As the temperature of the feed material increases at lower roll speeds, the conducting fraction quality increases; on the other hand, at low levels of feed material temperature, the recovery of the conducting materials increases with an increase in roll speed. However, to improve the economy of the process, it is desired to keep grade above a certain specified value and maximize recovery at this level and this condition of operation is achieved with the help of OQI.
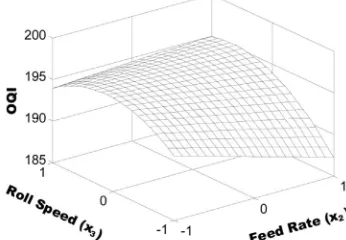
For better understanding, the statistical model is de- scribed in terms of three dimensional (3D) response sur- face plots between two independent variables and quality of the conducting minerals at center level of the third variable. Figure 5 shows the effects of temperature and feed rate on OQI of the conducting fraction at center level of roll speed. It is observed that at center level of roll speed there is a trivial effect on OQI with tempera- ture or feed rate variations. This is due to the fact that at higher temperatures, grade obtained is higher. At higher temperatures, the work function is high which results in more pinning effect of the non-conducting particles, thereby affecting the recovery. At higher feed rates and lower temperatures, excessive multilayer formation re- sults in more recovery with low grade. Hence, in this range, the OQI values almost remain constant.
-2 -1.5 -1 -0.5 0 0.5 1 1.5 2
186 188 190 192 194
Predicted OQI
Res
idu
al
[image:5.595.75.268.83.195.2]196 198
Figure 3. Plot of predicted values of OQI vs. residuals of conducting fraction.
0 5 10 15 20 25 30 35
0 5
Predicted OQI
Cumulativ
e Normal Proba
bility
[image:5.595.74.269.236.361.2]10 15
[image:5.595.88.256.405.520.2]Figure 4. Cumulative normal probability vs. Predicted va- lues of OQI.
Figure 5. Response surface plots showing the effect of tem- perature (x1) and feed rate (x2) on OQI of conducting frac- tion.
Figure 6. Response surface plots showing the effect of tem- perature (x1) and roll speed(x3) on OQI of conducting frac- tion.
[image:5.595.81.263.579.698.2]creases initially with increase in roll speed, because of the drastic increase in recovery with respect to rate of quality reduction, due to the fact that the centrifugal force dominates the pinning force of non-conducting particles. Further it may be inferred that the roll speed controls the selective charging at the ionizing zone and discharging to the rotor. With further increase in roll speed above a certain value, there is a drastic lowering of grade of the product.
Figure 7 shows the effects of feed rate and roll speed at center level of temperature. It can be observed from the figure that there is a trivial effect of feed rate on OQI of the conducting fraction.
Maximizing the functions given by Equations (5) and (6) is done by using the maximization toolbox in MAT- LAB 7.1. It is observed that a maximum grade of 97.7% is predicted under conditions of high temperature, inter- mediate feed rate and low roll speed; however, the re- covery is only 88.5%. On the other hand, recoveries of around 99.8% can be achieved at low temperatures, high roll speeds and intermediate feed rates, with a product grade of 94.9%. In order to obtain a balance between the recovery and grade, an attempt is made to maximize the variable OQI, with the constraint that grade has to be >96% and recovery >98%. The maximization is done based on Constrained Function Optimization. It is ob- served that the maximum value of OQI obtained under the given constraints is 195.53. This is obtained at the following operating conditions—Temperature: 102°C, Feed Rate: 1.75 tph and Roll Speed: 132 rpm. Under these operating conditions, from Equations (5) and (6), the grade and recovery obtained are 96.6% and 98.9% re- spectively.
4. Conclusion
The primary process input parameters of a High Tension Roll Separator (HTRS), namely the roll speed of the rotor, feed material temperature and feed rate are opti- mized in this study, using experimental data and qua- dratic programming. For the optimization studies, a new
[image:5.595.335.508.585.705.2]output index—Operational Quality Index (OQI)—has been applied successfully to optimize input parameters for efficient operation. Statistical models were developed for OQI, as well as both grade and recovery of the con- ducting minerals individually. The predicted values ob- tained using the models were in very good agreement with the observed values (R2 value of 0.91 for OQI; similar values obtained for both grade and recovery). Process optimization, viz. maximization of OQI has been done by keeping the constraints of grade >96% and re- covery >98%. The maximum value of OQI obtained un- der the given constraints is 195.53, at the following oper- ating conditions—Temperature: 102˚C, Feed Rate: 1.75 tph and Roll Speed: 132 rpm. Under these operating conditions, the grade and recovery obtained are 96.6% and 98.9% respectively. Normally, the separation effi- ciency index, which is a % recovery from the formula, is associated with coal washing processes; while coefficient of separation is nothing but an index derived from reco- very/distribution percentages of concentrates and rejects. Though these indices are useful in predicting the process performance, using the quality and quantity of different fractions, these are not completely significant for process variable optimization studies. Therefore, it was found that the concept of OQI is simple and more reliable in this regard.
5. Acknowledgements
Authors are thankful to Tata Steel Ltd management for the support and permission to publish this work.
REFERENCES
[1] A. D. Dance and R. D. Morrison, “Quantifying a Black Art: The Electrostatic Separation of Mineral Sands,” Min- erals Engineering, Vol. 5, No. 7, 1992, pp.751-765. doi:10.1016/0892-6875(92)90244-4
[2] J. Elder and E. Yan, “Newest Generation of Electrostatic Separator for the Minerals Sands Industry,” Heavy Min- erals 2003, South African Institute of Mining and Metal- lurgy, Johannesburg, pp. 63-70.
[3] M. Ziemski and P. N. Holtham, “Particle Bed Charge Decay Behaviour under High Tension Roll Separation,” Minerals Engineering, Vol. 18, No. 15, 2005, pp. 5-14. doi:10.1016/j.mineng.2005.02.013
[4] J. M. Lottering and C. Aldrich, “Online Measurement of Factors Influencing the Electrostatic Separation of Min- eral Sands,” The Journal of the South African Institute of Mining and Metallurgy, Vol. 106, 2006, pp. 283- 290. [5] E. G. Kelly and D. J. Spottiswood, “The Theory of Elec-
trostatic Separations: A Review Part 1. Fundamentals,” Minerals Engineering, Vol. 2, No. 1, 1989, pp. 33-46. doi:10.1016/0892-6875(89)90063-0
[6] N. Aslan, “Application of Response Surface Methodol- ogy and Central Composite Rotatable Design for Model-
ing the Influence of Some Operating Variables of a Multi- Gravity Separator for Coal Cleaning,” Fuel, Vol. 86, No. 5-6, 2007, pp.769-776. doi:10.1016/j.fuel.2006.10.020 [7] N. Aslan and Y. Cebeci, “Application of Box-Behnken
Design and Response Surface Methodology for Modeling of Some Turkish Coals,” Fuel, Vol. 86, No. 1-2, 2007, pp. 90-97. doi:10.1016/j.fuel.2006.06.010
[8] N. Aslan, “Modeling and Optimization of Multi Gravity Separator to Produce Celestite Concentrate,” Powder Technology, Vol. 174, No. 3, 2007, pp. 127-133.
doi:10.1016/j.powtec.2007.01.007
[9] M. Kincl, S. Turk and F. Vrecer, “Application of Experi- mental Design Methodology in Development and Opti- mization of Drug Release Method,” International Journal of Pharmaceutics, Vol. 291, No. 1-2, 2005, pp. 39-49. doi:10.1016/j.ijpharm.2004.07.041
[10] Z. Xiao and A. Vien, “Experimental Designs for Precise Parameter Estimation for Non-Linear Models,” Minerals Engineering, Vol. 17, No. 3, 2004, pp. 431-436.
doi:10.1016/j.mineng.2003.11.018
[11] G. E. P. Box and D. W. Benhken, “Some New Three Level Designs for the Study of Quantitative Variables,” Technometrics, Vol. 2, 1960, pp. 455-475.
[12] C. D. Montgomery, “Design and Analysis of Experi- ments,” John Wiley and Sons, Pte. Ltd, Singapore, 2001. [13] S. L. C. Ferreira, W. N. L. Santos, C. M. Quintella, B. B. Neto and J. M. Boque-Sendra, “Doehlert Matrix: A Che- mometric Toll for Analytical Chemistry Review,” Ta- lanta, Vol. 63, No. 4, 2004, pp. 1061-1067.
doi:10.1016/j.talanta.2004.01.015
[14] S. Souza Anderson, N. L. dos Santos Walter and L. C. Ferreira Sergio, “Application of Box-Behnken Design in the Optimization of an On-Line Pre-Concentration Sys- tem Using Knotted Reactor for Cadmium Determination by Flame Atomic Absorption Spectrometry,” Spectro- chimica Acta Part B, Vol. 60, No. 5, 2005, pp. 737-742. doi:10.1016/j.sab.2005.02.007
[15] D. L. Massart, B. G. M Vandeginste, L. M. C. Buydens, S. D. Jong, P. J. Lewi and J. V. Smeyers, “Handbook of Chemometrics and Qualimetrics Part A,” Elsevier, Am- sterdam, 2003.
[16] N. Kannan, A. Rajakumar and G. Rengasamy, “Optimi- zation of Process Parameters for Adsorption of Metal Ions on Straw Carbon by Using Response Surface Meth- odology,” Environmental Technology, Vol. 25, No. 5, 2004, pp. 513-522.
[17] P. Rana, N. Mohan and C. Rajagopal, “Electrochemical Removal of Chromium from Wastewater by Using Carbon Aerogel Electrodes,” Water Research, Vol. 38, No. 12, 2004, pp. 2811-2820.
doi:10.1016/j.watres.2004.02.029
[18] G. Annadurai, S. S. Sung and D. L. Lee, “Optimization of Floc Characteristics for Treatment of Highly Turbid Wa- ter,” Separation Science and Technology, Vol. 39, No. 1, 2005, pp. 19-42. doi:10.1081/SS-120027399
[20] D. M. Hopstock, “An Analysis of a Rotating-Drum-Type Electrostatic Separator,” Ph.D. Thesis, University of Min- nesota, Minnesota, 1972.
[21] R. D. Morrison, “Mathematical Modeling of High Ten- sion Roll Separation,” Ph.D. Thesis, University of Queen- sland, Queensland, 1977.
[22] J. S. Kwak, “Application of Taguchi and Response Surface Methodologies for Geometric Error in Surface Grinding Process,” International Journal of Machine Tools and Manufacture, Vol. 45, No. 3, 2005, pp. 327- 334. doi:10.1016/j.ijmachtools.2004.08.007
[23] V. Gunaraj and N. Murugan, “Application of Response Surface Methodologies for Predicting Weld Base Quality in Submerged Arc Welding of Pipes, Journal of Materials Processing Technology, Vol. 88, No. 1-3, 1999, pp. 266- 275. doi:10.1016/S0924-0136(98)00405-1