University of New Orleans
University of New Orleans
ScholarWorks@UNO
ScholarWorks@UNO
University of New Orleans Theses and
Dissertations
Dissertations and Theses
5-15-2009
An Evaluation and Redesign of a Thermal Compression
An Evaluation and Redesign of a Thermal Compression
Evaporator
Evaporator
Benjamin Marc Day
University of New Orleans
Follow this and additional works at:
https://scholarworks.uno.edu/td
Recommended Citation
Recommended Citation
Day, Benjamin Marc, "An Evaluation and Redesign of a Thermal Compression Evaporator" (2009).
University of New Orleans Theses and Dissertations. 926.
An Evaluation and Redesign of a Thermal Compression Evaporator
A Thesis
Submitted to the Graduate Faculty of the
University of New Orleans
in partial fulfillment of the
requirements for the degree of
Master of Science
in
Mechanical Engineering
Thermal Sciences
By
Benjamin Marc Day, P.E.
DEDICATION
ACKNOWLEDGEMENT
I would like to express my extreme gratitude to Dr. Ting Wang for the time that he
dedicated to my growth as an engineer. He never stopped believing in me and never stopped
pushing me to strive for greatness. while helping me forge that path through his knowledge and
mentoring.
TABLE OF CONTENTS
LIST OF FIGURES ... vii
LIST OF TABLES... viii
ABSTRACT... ix
CHAPTER ONE INTRODUCTION... 1
Background... 1
Objectives... 2
CHAPTER TWO LITERATURE SEARCH... 3
Focus of Literature Search... 3
Characteristics of Evaporation and types of evaporators... 3
Performance, Measurment And Design Considerations Of Evaporators... 4
CHAPTER THREE EVALUATION OF COMMERCIAL UNIT... 10
Subject of this Study ... 10
Theory of Operation of the Commercial Unit... 10
Field Test and Modifications ... 14
Material and Energy Balances of the Original Design... 17
Method of approach... 18
Material Balance... 18
Energy Balance:... 18
Overall Balance... 19
Results ... 20
CHAPTER FOUR THERMAL COMPRESSOR DESIGN AND ANALYSIS... 21
Numerical Simulation of Alternative Designs... 21
Results ... 22
Effect of Adding a Downstream Contraction Cone... 24
Effect of Adding a Downstream Diffuser... 24
Effect of the Location of the Steam Jet ... 26
Effect of the Contraction Cone Wall Contour... 26
Effect of the Size of the Suction Opening... 27
Effect of Adding a Suction Flow Guide... 28
An Optimal Case ... 29
Conclusions after numerical simulations... 30
Recommendations... 31
CHAPTER FIVE ALTERNATIVE DESIGN ... 32
Development of Alternative Design... 32
General Methodology ... 32
Description of Proposed Process Flow... 33
Simple Two-Stage Evaporator with No Thermal Compression ... 33
Thermal Compressor Suction to Motive Force Ratio of 1 to 1 ... 34
Thermal Compressor Suction to Motive Force Ratio of 2 to 1 ... 35
Thermal Compressor Suction to Motive Force Ratio of 3 to 1 ... 36
Thermal Compressor Suction to Motive Force Ratio of 4 to 1 ... 37
HYSYS Case Model Simulations... 38
HYSYS Case Model Four - Thermal Compressor Suction to Motive Force Ratio of 3 to 1 ... 43
HYSYS Case Model Five - Thermal Compressor Suction to Motive Force Ratio of 4 to 1... 45
Conclusion... 47
Chapter 6 Conclusions ... 48
BIBLIOGRAPHY... 49
APPENDIX... 50
HYSYS Case 2 Report... 50
LIST OF FIGURES
Figure 2.1: Fourteenth Century Salt Plant Courtesy of the British Library... 3
Figure 2.2: Multiple-Effect Evaporator ... 4
Figure 2.3: Single Stage Mechanical Vapor Compression Evaporator ... 6
Figure 2.4: T-S Plot of a Single Stage Mechanical Vapor Compression Evaporator... 6
Figure 2.5: Process Flow of a Thermal Compressor... 7
Figure 2.6: Single Stage Thermal Compression Evaporator ... 8
Figure 3.1 P&ID of the commercial thermo-compression Evaporator... 11
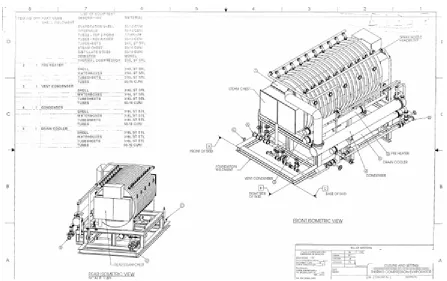
Figure 3.2 Commercial Thermal Compression Evaporator Isometric View ... 13
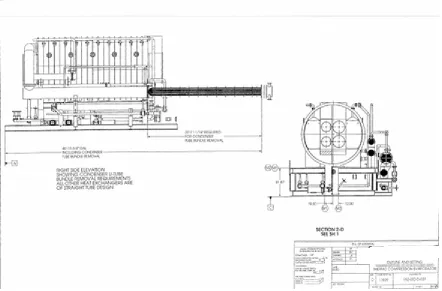
Figure 3.3 Commercial Thermal Compression Evaporator Elevation View... 13
Figure 3.4 Commercial Thermal Compression Evaporator Heat Exchanger View... 14
Figure 3.5 Commercial Thermal Compressors for Evaporator ... 16
Figure 3.6 Commercial Thermal Compressors Nozzle Design ... 16
Figure 3-7 Stage
Diagram Indicating Process Streams... 17
Figure 4.1: Pressure and Temperature Fields of the Existing Design... 23
Figure 4.2: Velocity Field and Stream Function of the Existing Design... 23
Figure 4.3: Effect of Downstream Resistance ... 25
Figure 4.4: Effect of Downstream Diffuser ... 25
Figure 4.5 Effect of Jet Location ... 26
Figure 4.6 Effect of Cone Contour ... 27
Figure 4.7 Effect of Suction Opening Size ... 28
Figure 4.8 Effect of Suction Flow Guide... 29
Figure 4.9 Case with Contoured Cone and Downstream Diffuser ... 30
Figure 5.1 Process Flow of the Redesigned Alternative Thermal Compressor Evaporator ... 32
Figure 5.2 HYSYS Results for Thermal Compressor Suction to Motive Force of 1 to 1 ... 40
Figure 5.3 HYSYS Results for Thermal Compressor Suction to Motive Force of 2 to 1 ... 42
Figure 5.4 HYSYS Results for Thermal Compressor Suction to Motive Force of 3 to 1 ... 44
Figure 5.5 HYSYS Results for Thermal Compressor Suction to Motive Force of 4 to 1 ... 46
LIST OF TABLES
Table 3.1 Equipment specifications... 14
Table 3.2 Field Run Data... 15
Table 3.3 Energy Balance with Suction Rate Equal to Motive Steam Rate... 19
Table 3.4 Energy Balance with Suction Rate Equal to Two Times that of Motive Steam Rate... 19
Table 3.5 Energy Balance with Suction Rate Equal to Three Times that of Motive Steam Rate... 19
Table 3.6 Energy Balance with Suction Rate Equal to Four Times that of Motive Steam Rate... 20
Table 5.1 Material and Energy Balance with No Thermal Compression... 34
Table 5.2 Material and Energy Balance - Thermal Compressor Suction to Motive Force Ratio of 1 to 1 ... 35
Table 5.3 Material and Energy Balance - Thermal Compressor Suction to Motive Force Ratio of 2 to 1 ... 36
Table 5.4 Material and Energy Balance - Thermal Compressor Suction to Motive Force Ratio of 3 to 1 ... 37
ABSTRACT
Evaporators separate liquids from solutions. For maximum efficiency, designers reduce
the temperature difference between the heating and heated media using multiple-stage
evaporators. This efficiency requires increased size and bulk.
A vendor claimed its thermal compression evaporator achieved high efficiency with only
two stages. It did not function as claimed.
This project investigated the evaporator’s design to identify its problems and propose an
alternative design with a minimized footprint.
The analysis showed theoretical flaws and design weaknesses in the evaporator, including
violation of the first law of thermodynamics.
An alternative thermal compressor design was created through computational fluid
dynamics using spreadsheet methods developed in house, aided by the software product
FLUENT. Detailed component sizing was done using the software product HYSYS. The
proposed redesign achieved four to one efficiency with two stage thermal compression, using
one half of the space of a traditional system of similar performance.
CHAPTER ONE
INTRODUCTION
Background
Evaporation is a special case of the larger topic of heat transfer to a boiling liquid. This
process occurs so often that it has been given its own topic title. Evaporation is the removal of
solvent as a vapor from a solution or slurry. Evaporation often encroaches on the unit operation
of distillation, but evaporation differs by making no attempt to separate the components in the
vapor phase.
The objective of evaporation is to concentrate a solution that consists of two liquids, one
of the liquids consisting of a volatile solute and the other being a nonvolatile solute. Usually in
evaporation processes the nonvolatile liquid is of value while the volatile vapors are condensed
and discarded. However, the converse is true for the demineralization of water; the evaporation
process is used for the removal of solids to make solid-free water. The solid-free water is used
for boiler feed water, special chemical equipment, and human consumption.
A natural gas processing and gathering facility located in Louisiana. consists of a 300
million standard cubic feet per day (MMSCFD) cryogenic expander plant; a one billion standard
cubic feet per day (SCFD) lean oil absorption plant; a 30,000 barrel per day (bbl/day)
fractionation train; and a 13 megawatt (MW) power plant with 900,000 pounds mass per hour
(lbm/hr) of 600 pounds per square inch gauge (psig) superheated 700 defree Fahrenheit (°F)
steam capability.
of fifty five psig saturated steam. Upon startup of the thermal compression evaporator (TCE), the
unit fell well short of its original design criteria producing less than two pounds per hour of fresh
water per pound of steam. Since the manufacturer was unable to find the cause of the problem,
this study was initiated.
Objectives
The objectives of this study were to investigate the design of this commercial thermal
compressor evaporator systemto examine the function of each component, to identify the cause
of the failure to perform as specified, and to offer a solution. The following specific tasks were
designed to reach the study objectives. The tasks, and the techniques each will use follow.:
1.
Examine the overall energy and mass balance of the system. This will determine
if the evaporator can achieve a steam economy of producing nine pounds of fresh
water for each one pound of steam consumed.
2.
Examine the function of each component. The necessary mechanisms will be
verified by modeling the fluid mechanics, heat transfer, and mass transfer of the
system.. This can help delineate any design errors incorporated into the original
product.
3.
Propose a solution. FLUENT (a commercial simulation program) simulation
models will be run on the original thermal compressor design, and on a series of
proposed new geometries for the compressor design , to determine if it is possible
to enhance the performance and economy of the original design.
CHAPTER TWO
LITERATURE SEARCH
Focus of Literature Search
The literature search focuses on:
the characteristics of evaporation and types of evaporators;
the performance, measurment and design considerations of evaporators.
Characteristics of Evaporation and types of evaporators
Evaporation is considered one of the first industrial operations used in manufacturing.
During the 14
thcentury the evaporation process was employed in the manufacturing of salt from
sea water.
Figure 2.1: Fourteenth Century Salt Plant Courtesy of the British Library
poor economy,( the pounds of solvent evaporated per pound of “heat” added), is that at
atmospheric pressure it requires roughly one pound of steam for each pound of water (solvent)
evaporated. This poor economy was improved by the development of multiple-effect evaporators
(Figure 2.2).
Figure 2.2: Multiple-Effect Evaporator
Performance, Measurment And Design Considerations Of Evaporators
Multiple-effect evaporators work on the concept of cascading energy. The solvent enters
the first stage of the evaporator at some pressure P
1, and concentration C
A1where these variables
determine the boiling point T
1of the solvent. Heat is introduced into the effect-one to begin
boiling the solvent. Since the boiling process is done under constant pressure the solvent leaving
effect-one is approximately equal to P
1,but the concentration C
A1of the solvent, has changed to
C
A2so a new boiling point temperature exists by the equation of state; T
n= P
n/C
AnR, n=1,2,3 .
To be able to take advantage of the exiting heat from effect-one and use it to induce
boiling in effect-two the pressure in the solvent stream entering effect-two is lowered. This
process is usually done with baffles or orifices placed in the path of the flow. With the pressure
lowered the boiling point will also be lowered and heat from the effect-one can be used to
promote boiling of the solvent in effect-two. This cascading of energy reduces the temperature
differential between the heat source and the solvent so more energy can be extracted from the
heat stream,resulting in improved economy of the unit.
The major advantage of multiple-effect evaporators is their high economy in terms of
Effect 2
Effect 1
Heat in
Solvent
In
∆
P
Solvent
Out
Heat at Lower
Temperature
Non
volatile
with these types of units can restrict their use. These problems arise because maintaining the heat
delivery into the solvent stream with decreased temperature differential requires a greater heat
exchange surface area in the evaporator.
Proof:
Eq. 2.1 Qstage = UA
∆
Tlm, stage- Governing equation for staged heat transfer
Eq. 2.2 Qstage1= Qstage2 – For the same amount of heat in each stage
Substitute Eq. 2.1 into Eq. 2.2 to yield Eq. 2.3
Eq.2.3 U1A1
∆
Tlm 1= U2A2
∆
Tlm 2
Solving for A2
Eq.2.4 A2= A1*(
∆
Tlm 1/
∆
Tlm 2)*(U1/ U2)
Under the assumption of U
1= U
2this is valid when the two stages being evaluated have
similar fluid properties. This usually can be ensured if the stages being evaluated are right next to
each other as to not have much variation in the composition of the solvent or heating medium.
Eq. 2.5 A
2= A
1*(
∆
T
lm 1/
∆
T
lm 2)
This shows that as
∆
T
lm 2<
∆
T
lm 1the required surface area/stage increases.
This problem led designers and engineers to search for a way to decrease the required
footprint and capital costs associated with multiple-effect evaporators,whie maintaining their
high economy. This led to the introduction of the recompression evaporator.
There are two types of recompression evaporators. One uses mechanical compression and
the other uses thermal compression. Both types of evaporator employ the same concept of
upgrading the “value” of the heating medium stream as to increase the difference in approach
temperatures between the solvent and heating medium/stage. This difference in the approach
temperature between stages reduces the surface area required per stage. The reduction of surface
area lowers the capital costs and foot print of the evaporator.
temperature of the media by raising the pressure, but the non-isentropic compression adds
frictional heat which will superheat the media. (Figure 2.4)
Figure 2.3: Single Stage Mechanical Vapor Compression Evaporator
Figure 2.4: T-S Plot of a Single Stage Mechanical Vapor Compression Evaporator
This higher thermodynamic advantage of adding a compressor to reduce evaporator
footprint comes at a price. The cost of operating the unit will go up as the horsepower
requirement of the compressor increases. This design consideration must be weighed against the
lower capital investment of a smaller footprint unit.
The higher cost of operation that exists with mechanical compression units has led to
developments of other means of producing a higher grade of media. One of these developments
Compressor
Suction
Effect
Make-up
Media
Feed
Discharge
Liquid
Product
Temperature
Entropy
P2
Feed
Latent Heat
Compressor
advantage of using an existing utility system for power instead having to add electrical load to a
manufacturing plant or commercial facility.
The thermal compressor works on the principle of momentum transfer. Two streams enter
the compressor, one stream of lower grade and one of high grade, with the hope of making a
medium grade stream to be used in the evaporator. (Figure2.5) The high grade stream enters
through a nozzle and expands through a converging-diverging nozzle. This high velocity fluid
then entrains the low grade stream by a suction effect created by the high velocity passing the
suction entrance. The two fluids are then mixed prior to the inlet to the throat where the velocity
of the mixed stream is then reconverted to pressure energy by traveling through the throat and
diffuser to make a medium grade stream.
The problem with the thermal compressor is that the momentum transfer is very sensitive
to geometry since it is designed as a fixed orifice metering device. Any change in process
condition that would require a change in pressure of the motive stream, the suction stream, or the
discharge stream causes a proportionate change inthe ration of mass flow of motive fluid to
suction fluid, resulting in a change of discharge flow. This can cause large inefficiencies in the
compressor unit, resulting in underperformance of the evaporator and the waste of the high grade
stream.
Low Grade
High
Grade
Nozzle
Throat
Medium
Grade
Figure 2.6: Single Stage Thermal Compression Evaporator
A thermal compressor evaporator and a mechanical compression evaporator work on the
same design principle, as the with the exception of the source of motive power.. Instead of using
an electric motor a high grade motive stream is used.. This is done to add value to the heating
stream to provide a higher
∆
T
lmso a smaller surface area can be used, which results in both a
smaller footprint and a smaller capital cost.
There are several other types of evaporators other than the three that are mentioned.
These other types were not considered in this thesis since no aspect of their design was used in
the original commercial system. However the natural circulating evaporator does warrant a brief
description due to its overwhelming use in industrial operations. Natural circulation evaporators
or thermosiphons depend upon density differences of the fluid to produce the required flow rates.
Vaporization creates an aerated liquid with a density less than that of the liquid system. The
resulting differences produce a hydraulic head that will promote circulation of the fluid. The
circulating fluid will travel through a heat exchanger where it will boil and where a portion of the
vapor will separate from the liquid and be taken out of the evaporator as the volatile component.
Finally no discussion of evaporators would be complete without discussing the liquid
characteristics of the streams,, because liquid characteristics are often a critical factor in
evaporator design.. Some of the more important properties to consider follow.
Concentration
As the solution begins to thicken from increased boiling, the density and
Effect
Feed
Discharge
Liquid
Motive Stream
Condensing
media
Condensate
Condensate
Entrained
solution becomes too sluggish for proper heat transfer. If saturation occurs, continued boiling of
the liquid will cause crystals to form which may plugg the tubes. Another effect to be considered
is that the boiling point of the solution may increase without an increase in pressure. This is
caused by the higher concentration of solids in the stream produced from increased boiling.
Foaming
Some liquid solutions maybe more prone to foaming, most often from the introduction of
organic compounds in the solution. A stable foam exists at the interface between the vapor and
liquid phase. This foam causes entrainment of liquid into the vapor. If the quantity of this foam
becomes extreme then all of liquid may boil out into the vapor and be lost.
Temperature Sensitivity
Consideration of the product to be evaporated is a concern. Excess heat added to the
solution to “boil out” the lighter component may cause the liquid to burn as uneven heating may
occur.
Biot Number
CHAPTER THREE
EVALUATION OF COMMERCIAL UNIT
Subject of this Study
A commercial two-stage thermo-compression evaporator was examined. The evaporator
consists of two effects or stages where the evaporation of fresh water from salt water solution
takes place. The condenser is where all of the evaporated water and uncondensed motive steam
will change phases from vapor to liquid and end up as product in the distillate stream. A
pre-heater is used to help bring the water supply temperature closer to the evaporation temperature.
Finally a vent condenser is used to condense a side stream of supply steam to help remove any
incondensables in the condenser. Each effect is fitted with a thermal compressor to increase the
“value” of the heating steam supplied to each effect. The manufacturer claims that its new
design of adding thermal compressors to each stage will increase the economy of the unit from
the three to one ratio that is to be expected from a conventional two-stage evaporator up to a ratio
of 9.1 to 1.. This claim means that for every one pound of steam supplied to the unit, s the user
may expect eight-and-one-tenth pounds of new distillate and one pound of condensed supply
steam for a total of nine-and-one-tenth pounds of produced distillate.
Theory of Operation of the Commercial Unit
The piping and instrumentation diagram (P&ID) of the unit under study (Figure 3-6)
shows four streams.
Stream
[A]
, is the superheated steam supply stream, at 60 psig and 350°F, which should
Stream
[B]
, the water supply, provides raw feed water to both effects (100,000 pounds
per hour) and also provides cooling water to condense the distillate from vapor to liquid (about
154,000 pounds per hour). The 100,000 pound per hour feed water split is heated to 164° F and
then is directed into a mixing pot where sulfuric acid is injected to lower the PH of the water
from 7.0 to 6.5. This acidification helps remove scaling from the tubes and shell of the effects.
The feed water stream is split again with 60,000 pounds per hour being fed to effect one after
being pre-heated with the saturated steam leaving effect one to approximately 212°F.. The
remaining 40,000 pounds per hour goes to effect #2 with an entrance temperature of 165
oF. The
water entering into effect one and effect two is distributed via a spray bar to a horizontal bundle
where steam from the steam supply combines with the suction of the thermal compressor to
make a medium grade steam (approximately 212
oF and 14.7 psia) in effect #1. This medium
grade steam recirculates through the tube bundle in order to increase the mass flow rate in the
tube bundle. The manufacturer claims this increased mass flow rate increases the evaporation
rate of water, therefore improving the economy of each stage and providing the claimed overall
economy of 9.1 to 1. Any steam that is not drawn up into the suction of the effect one
compressor travels through a duct into effect two. This medium-grade steam from effect one is
at a higher pressure and is used as the motive steam to drive the thermal compressors in effect
two, where the steam is recirculated as described for effect one.
Stream
[C]
is the distillate stream. The vapor produced in effect one is used as heating
media in the effect one feed water pre-heater, where it cools and then combines with the vapor
produced in effect two. The combined output of the two effects flow into the condenser,
condenses to liquid form and exits via Stream [C]as distillate product..
Stream
[D]
is the discharge of the condenser cooling water outflow and the concentrated
evaporator bottoms.
Figure 3.4 Commercial Thermal Compression Evaporator Heat Exchanger View
Table 3.1
Equipment specifications
Field Test and Modifications
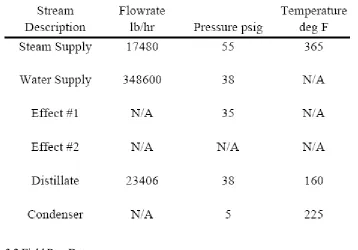
Table 3.2 Field Run Data
Based on the field run data, the evaporator produced an economy of 1.34 to 1 (23,406/17,480)
significantly short of the original designed value of 9.1 to 1. The manufacturer believes that the
poor result was a thermal compressor design bust where there was not enough increase in mass
flow rate circulation through each effect to produce the design economy of 9.1 to 1..
Figure 3.5 Commercial Thermal Compressors for Evaporator
The retrofit was completed and the unit was started. Upon startup the pressure in the first
effect rose to 55 psig which caused the rupture disc to release and vented all of the steam in the
shell in the first effect to atmosphere. The follow-up inspection showed that the unit was
mechanically damaged. The wall that separated the first effect and the second had been bent due
to excessive differential pressure between the first and second effect.
This damage prompted the initiation of this research by examining the fundamental
design principles through (a) global material and energy balance evaluation and (b) component to
component evaluation. The global material and energy balance is described below. The
component evaluation indicated that the probable cause was the thermo-compressor design.
Hence, a comprehensive evaluation of thermo-compressor was conducted and is described in
Chapter 4.
Material and Energy Balances of the Original Design
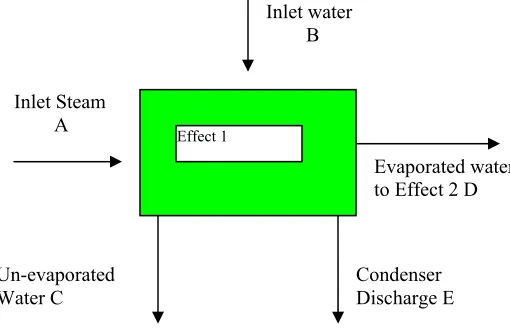
Figure 3-7 Stage
Diagram Indicating Process Streams
Effect 1
Inlet Steam
A
Inlet water
B
Stage System
Defined
Un-evaporated
Water C
Evaporated water
to Effect 2 D
Method of approach
An overall energy balance for each stage of the evaporator was done based on the process
conditions indicated on the piping and instrumentation diagram (Figure 3.1).
Material Balance
First a system was defined indicating all of the material streams entering and exiting the
system (see above system diagram in Figure 3.7). Then all of the enthalpy streams were
established based on the pressures and temperatures specified on Figure 3.1. Finally to establish
the claim that the thermal compressors internal recycle would produce the claimed economy per
stage, four different cases were calculated. The suction rate of the compressor is defined as a
function of inlet steam such that S= I *A, where S is the suction rate to the compressor, I is any
non-negative integer indicating the suction ratio, and A is the inlet mass flow rate of steam. The
sign convention used is negative for the energy exiting the compressor and positive for energy
entering the compressor.
Energy Balance:
Compressor Balance -The enthalpy of stream E is established by the balance for constant
composition of fluids. In this analysis it was assumed that the mixing was isentropic for the
initial analysis.
( )
i i Totali e
Disch
H
M
M
H
∑
∞
=
=
1 arg
(Eq. 3.1)
M
i: The mass flow rate of an inlet stream to the compressor
H
i: The stream enthalpy of an inlet stream to the compressor
M
Total: The total mass flow rate of all inlet streams to the compressor
H
Discharge: The stream enthalpy of the discharge of the compressor
Expanding Eq.7 for all applicable streams to the compressor, the total energy of the
discharge stream is found.
Q
discharge E= M
E[M
A/M
Total(H
A) + M
S/M
Total(H
S)]
(Eq.3.2)
M
E: The mass flow rate of the discharge of the compressor
M
A: The mass flow rate of the motive stream to the compressor
Overall Balance
Qinlet- Qoutlet=0
(Eq.3.3)
____________________________________________________________________________
Table 3.3 Energy Balance with Suction Rate Equal to Motive Steam Rate
____________________________________________________________________________
Table 3.4 Energy Balance with Suction Rate Equal to Two Times that of Motive Steam Rate
____________________________________________________________________________
Table 3.6 Energy Balance with Suction Rate Equal to Four Times that of Motive Steam Rate
Results
In the four cases that are evaluated by varying the suction rate to the compressor, it shows
the energy balance was never satisfied. The energy balance shows that the unit is “creating”
energy on the order of 18MMBtu/hr. This creation of energy shows that there is a fundamental
mistake conceptual problem with the design of the evaporator.
The conceptual flaw is the assumption that the compressors, with an increase of the mass
flow rate to each stage tube bundle, the total energy of the stage will increase with the mass flow
rate to each stage tube bundle. In realty, the increase of the mass flow rate to each stage tube
bundle is just a redistribution of the mass flow rate from the motive steam to the tube bundle and
this redistribution of mass flow rate does not increase the total energy entering the control
volume of the entire stage. Since the total energy of the stage is not changed, then the increase in
mass flow rate cannot increase additional evaporation because no additional energy is added.
CHAPTER FOUR
THERMAL COMPRESSOR DESIGN AND ANALYSIS
Numerical Simulation of Alternative Designs
One of the problems of the original design has been identified as the steam jet suction
effect . The designed suction flow rate should be about 3.5 times of the steam jet flow rate, but
the energy and mass balances of the evaporator test indicates the suction flow rate was very low,
only about 24% of the designed value. To examine the mechanism of the steam jet suction flow
rate, numerical simulation was conducted using the commercial software product, FLUENT.
FLUENT is a Computational Fluids Dynamics (CFD) software package specifically written to
simulate thermal flow, mass and heat transfer, combustion, and similar phenomena. Heat
transfer between the steam jet and suction flow was calculated, and the compressibility effect
was also considered. To improve the suction flow rate, the existing design and various revalued
parameters were considered and incorporated to improve the suction flow rate. These parameters
include the location of the jet exit, flow resistance due to the downstream contraction cones, size
of the suction openings, contours of the contraction cone, and the addition of a diffuser
downstream of the contraction. The simulations were performed by Dr. Xianchang Li, a Project
Engineer of the Energy Conversion and Conservation Center of University of New Orleans.
Notice that in the real situation, the steam jet mass flow rate was higher due to its higher
pressure. It is believed that the mechanism of suction presented in this report is applied to the
real system with higher steam pressures present because the critical factor is the pressure
difference. The actual pressure plays a secondary role.
Results
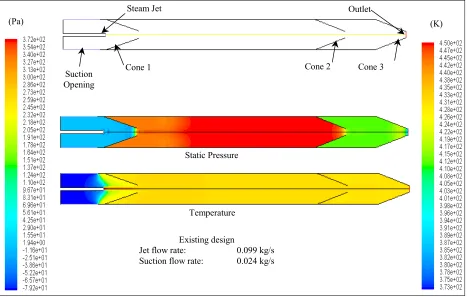
The computed pressure and temperature fields of the existing design are shown in figure
4.1 and the velocity field and stream function distribution are shown in figure 4.2. These figures
show that the static pressure was high between the first and second contraction cones. The high
temperature jet mixed with the cool entrained (suctioned) steam and became a moderate
temperature flow. Strong recirculation occured inside the contraction cones and in the suddenly
opened section immediately downstream of the contraction cones. The recirculation signifies
inefficient aerodynamic performance and increased pressure losses as well as entropy
production.
Static Pressure
Temperature
(K)
(Pa)
Cone 1
Cone 2
Cone 3
Suction
Opening
Steam Jet
Outlet
Existing design
Jet flow rate:
0.099 kg/s
Suction flow rate:
0.024 kg/s
Figure 4.1: Pressure and Temperature Fields of the Existing Design
(m/s)
Velocity Vector
Effect of Adding a Downstream Contraction Cone
The effect of downstream contraction cones was simulated by removing one of the
downstream cones in subsequent simulations. Figure 4.3 shows that by removing one cone the
suction rate is increased from 24% of the steam jet flow rate to 50%. Removing both the
downstream cones increased the suction rate to 140% . . .a six-fold augmentation! The reverse
flow inside the contraction cone is weakened; however, the flow recirculation downstream of the
contraction cone still occurs. With both downstream contraction cones being removed, the
suction flow rate increases, and the temperature of the mixed flow becomes lower, as shown in
figure 3(b). These results clearly show that the downstream contraction cones do not provide
additional momentum transfer or suction power as originally designed. Instead, they adversely
create high flow resistance and significantly impede the suction performance of the first stage
steam jet.
Effect of Adding a Downstream Diffuser
, In the simulation, a diffuser was added into the pipe to reduce the flow recirculation
downstream of the contraction cone. The diffuser followed the design of a standard Venturi
nozzle. The length of the diffuser was 66 inches, resulting in a diffusing angle of 6.5 degrees(°),
to reduce flow separation near the wall. Figure 4.4 shows the comparison between the cases with
and without the downstream diffuser. The flow recirculation area is obvious downstream
without the diffuser. The flow separation is negligible inside the diffuser. With the diffuser the
suction flow rate is increased to 365%, a 2.6-fold increase from the case without the diffuser and
15.2 times more than the real world design. The temperature of the mixed flow becomes even
lower due to the high suction flow rate. From these results, it can be concluded that employing a
downstream diffuser to reduce aerodynamic losses is extremely important. It is easy to
(a) Stream function
(K)
450
373
Suction rate: 24%
Suction rate: 50%
Suction rate: 140%
(b) Temperature
Figure 4.3: Effect of Downstream Resistance
Suction rate: 140%
Suction rate: 365%
(a) Stream function
(K)
450
373
Suction rate: 140%
Suction rate: 365%
Effect of the Location of the Steam Jet
To provide for a more effective suction ratio, the effect of the location of the steam jet
exit was examined. Several cases were studied by moving the steam injector, originally located
at the the contraction cone entrance, both away from and toward the contraction cone entrance.
Figure 4.5 shows results of two cases: one where the steam jet was located in the plane of the
cone entrance, and another case where the steam jet was moved half way into the contraction
cone. Both cases included one downstream contraction cone. The reverse flow became stronger
in the second case, resulting in a reduction of suction flow rate from 50% to 18%. After
comparing many locations of the steam jet, it was concluded that best result occurs when the
steam jet is located right at the centerline at the contraction cone entrance. A slight displacement
of the jet did not result in any significant change in the suction flow rate.
Suction rate: 50%
Suction rate: 18%
(a) Stream function
Suction rate: 18%
Suction rate: 50%
(b) Velocity Vector
Figure 4.5 Effect of Jet Location
Effect of the Contraction Cone Wall Contour
using a modified cone and diffuser geometry. The contraction cone has a contoured wall, and a
small section of straight transition (4 inches) was added between the cone and diffuser to smooth
the transition from the convergent cone to the divergent cone. The result indicates the contoured
contraction cone and the added transition piece increase the suction flow rate about 20% from
365% to 430% of the steam jet flow rate.
Suction rate: 365%
Suction rate: 430%
(a) Stream function
Suction rate: 365%
Suction rate: 430%
(b) Velocity Vector
Figure 4.6 Effect of Cone Contour
Effect of the Size of the Suction Opening
Case (a) has a baseline opening size, and Case (b) has a smaller suction opening (1/3 of the
baseline opening). The results in figure 4.7 indicate that the stream function as well as the
velocity vector does not change much in these two cases. The corresponding suction flow rates
are almost the same at 365%.
Stream function
Big suction inlet
Suction rate: 365%
(a)
Stream function
Small suction inlet
Suction rate: 365%
(b)
Figure 4.7 Effect of Suction Opening Size
Effect of Adding a Suction Flow Guide
(0.0982 kg/s) in the second. The benefit of adding a flow guide is negligible and probably not
worth the expense of adding it.
Circulation
(a) Stream function
Figure 4.8 Effect of Suction Flow Guide
An Optimal Case
The favorable features discovered in the course of the simulations were combined into an
optimal case.This optimal simulation used a contoured contraction cone with a long downstream
diffuser and a transition piece between the contraction cone and the diffuser. This simulation
used no downstream contraction cones. The result in Fig. 4.9 shows smooth flow field with
minimized flow recirculation zone. The suction flow rate is 0.4233 kg/s or 430% the steam jet
flow rate. Further optimization can be conducted if needed.
This study considers several different ways of enhancing the suction flow rate of the
thermal compressor in a certain thermal compression steam evaporator. The actual suction flow
rate is subject to the numerical uncertainty when applied to real situations; however, the
(K)
(Pa)
Static pressure
Temperature
(b
(b) Temperature and Velocity Vector
Figure 4.9 Case with Contoured Cone and Downstream Diffuser
Conclusions after numerical simulations
Considering the results of the previously described numerical simulation, the following
conclusions are made:
1.
Neither of the downstream contraction cones provide additional momentum or additional
suction flow rate as claimed in the original design. Instead, they create large downstream flow
resistance and impede the overall suction performance. Removing both downstream cones
significantly increases the suction capacity. The suction rate doubles by removing the first
contraction cone and increases 5.8 times by removing the second contraction cone.
2. Adding a diffuser downstream of the contraction cone provides a significant increase in the
suction flow rate. Adding a simple straight diffuser with an included angle of 6.5
oincreases the
suction flow rate by 2.6 times.
3. The location of the steam jet injection point affects the suction flow rate. The best location
appears to be at the center of the contraction cone entrance. The suction flow rate reduces when
the steam jet injection location is moved into or away from the entrance plane. When the
4. Employing an aerodynamically contoured contraction cone provides a 20% augmentation of
suction flow rate. This favorable effect, while significant, would not by itself cure the problems
of the original design..
5. The suction opening connecting to the vapor plenum is not important. Shrinking the suction
opening to one-third or two-thirds of the original size does not change the suction flow rate.
6. Adding a contoured annular passage to guide the entrained flow shows little effect on the
suction flow rate.
Recommendations
Based on the above study, an optimal design can be obtained by
(A)
installing a contraction cone with an aerodynamically contoured wall profile;
(B)
adding a 90-inch long diffuser downstream of the contraction cone;
(C)
removing all the downstream contraction cones; and
(D)
locating the steam jet injection point at the center of the contraction cone entrance
plane.
(E)
adding a 4-inch straight transition piece between the contraction cone and the
diffuser;
(F)
filing smooth all of the welded joints and fillings all gaps along the thermal
compression flow path;
(G)
continuing optimization studies to determine if additional improvements might be
made.
CHAPTER FIVE
ALTERNATIVE DESIGN
Development of Alternative Design
General Methodology
Description of Proposed Process Flow
Inlet steam enters along stream 1, where it is split into two streams, 2 and 16. Stream 2
goes to the thermal compressor as the motive steam to generate suction to draw in more
lower-grade steam mass from the exit of stage 2 in order to achieve a higher evaporation economy
ratio. The remaining portion of stream 1 goes through a pressure control valve as stream 16 to
match the discharge pressure of the thermal compressor, stream 3. The discharge of the thermal
compressor, stream 3, and stream 16 combine together to make stream 15. Stream 15 then feeds
into stage 1 as the heating medium which will then evaporate the feed water, stream 7. The
evaporated feed water leaves the first stage as stream 8 and proceeds to stage 2 to provide
heating medium to evaporate the feed water, stream 17, which enters into stage 2 and evaporates
to form stream 9. Stream 9 is then subject to the suction force generated by the thermal
compressor. Depending on the prime motive-steam energy quality (pressure and temperature), a
portion of stream 9 is drawn into the thermal compressor as stream 14 and mixes with the prime
motive stream 2 to form a medium-grade steam with multiplied mass flow rate as stream 3. The
remaining amount of stream 9 turns into stream 10, and is condensed in the condenser as product
and is combined with stream 18 and stream 4 as the total product streams.
The evaporation ratio of this design depends on the thermal compressor
performance.
Four cases were evaluated based on the thermal compressor suction rate as a function of
the motive steam. As in the evaluation with the commercial unit the suction rate is looked at as
an integer function of motive steam rate, such that S= I *A where S is the suction rate to the
compressor, I is any non-negative integer indicating the suction ratio, and A is the inlet mass
flow rate of steam. The results of the four cases with the suction ratio from 1 to 4 are shown in
Table 5.1 through Table 5.5. .
Simple Two-Stage Evaporator with No Thermal Compression
Table 5.1 Material and Energy Balance with No Thermal Compression
Thermal Compressor Suction to Motive Force Ratio of 1 to 1
Table 5.2 Material and Energy Balance - Thermal Compressor Suction to Motive Force Ratio of 1 to 1
Thermal Compressor Suction to Motive Force Ratio of 2 to 1
Table 5.3 Material and Energy Balance - Thermal Compressor Suction to Motive Force Ratio of 2 to 1
Thermal Compressor Suction to Motive Force Ratio of 3 to 1
Table 5.4 Material and Energy Balance - Thermal Compressor Suction to Motive Force Ratio of 3 to 1
Table 5.5 Material and Energy Balance - Thermal Compressor Suction to Motive Force Ratio of 4 to 1
HYSYS Case Model Simulations
HYSYS Case Model Two - Thermal Compressor Suction to Motive Force Ratio
of 1 to 1
HYSYS Case Model Three - Thermal Compressor Suction to Motive Force Ratio
of 2 to 1
Case Model Three was evaluated in HYSYS with a compressor suction flow rate to
motive force flow rate ratio of two to one. The results from the commercial simulator also match
well with the initial material balance calculated by in-house program. HYSYS predicts a
HYSYS Case Model Four - Thermal Compressor Suction to Motive Force
Ratio of 3 to 1
HYSYS Case Model Five - Thermal Compressor Suction to Motive Force
Ratio of 4 to 1
Conclusion
Since both the in-house design spreadsheets and the commercial simulator
HYSYS are in excellent agreement with the alterative design, this concludes that
thermodynamically the alterative design is a viable option that can be used instead of the original
commercial design that was built.
Design sheet vs Commerical Software
0
1
2
3
4
5
45
48
51
54
57
60
63
66
69
72
75
78
81
84
87
90
93
Distillate Flowrate
R
un C
a
s
e
Design Sheet
Commerical Software
Chapter 6
Conclusions
A commercial evaporator incorporating the thermal compression principal claimed to
achieve an economy of 9 to1 with only two stages, occupying a physical volume of only 25% of
that of a conventional 8-stage evaporator. Unfortunately, this commercial unit failed miserably
with an economy of only 1.34 to1. A complete thermal balance and fluid flow analysis was
conducted and it was found that the design of the commercial unit never satisfied the energy
balance. The commercial unit was “creating energy” on the order of 18 million BTU per hour
(MMBtu/hr). It was also shown through a computational fluid dynamics (CFD) model that the
thermal compressors supplied with the commercial unit were not able to reach the process
designers conditions of a (steam suction flow rate to steam motive flow rate) of 4 to 1.
Guided by the CFD iterations, the thermal compressor unit was redesigned to achieve the
suction economy of 4 to1. Based on these results, an alternative design of the entire evaporator
was proposed that would keep the high efficiency of a multistage evaporator with the advantages
gained using a thermal compressor. Two different theoretical approaches were used to reach this
alternative design. . The first approach was to write an in-house program that would apply the
conservation equations of mass and energy to the proposed design. The proposed design was
applied using four suction steam to motive steam ratios of 1to1, 2 to 1, 3 to 1 and 4 to 1.
The second method was to use the commercially available thermodynamic simulator, (HYSYS)
to conduct more detailed component designs. The results of the two methods were compared and
found to be in good agrproven vieement. The final design using the CFD designed thermal
compressor is able to achieve 4:1 evaporation economy with a 50% reduction of footprint of a
BIBLIOGRAPHY
Perry, Green.
Perry’s Chemical Engineers Handbook. 7
thEd.
New York: McGraw-Hill, 1997.
Burmeister, Louis C.
Convective Heat Transfer. 2
ndEd
. New York: John Wiley & Sons, Inc.
1993.
Anderson, John D.
Modern Compressible Flow with Historical Perspective. 3
rdEd.
Boston:
McGraw-Hill, 2003.
Smith, Van Ness, Abbott M. M.
Introduction to Chemical Engineering Thermodynamics
. 5
thEd.
New York: McGraw-Hill, 1996.
Collier, John G.
Convective Boiling and Condensation
. London: McGraw-Hill, 1981.
Minton, Paul E.
Handbook of Evaporation Technology
. Park Ridge: Noyes Publications, 1986.
Welty, James R., Charles E. Wicks, and Robert E. Wilson.
Fundamentals of Momentum, Heat,
and Mass Transfer. 3
rdE
d. New York: Jon Wiley & Sons, 1984.
Croll-Reynolds.
Thermocompressors.
Westfield: Croll-Reynolds Company, Inc., 1986.
Chato, John C. “Laminar Condensation” ASHRAE Journal 4 (1962): 52-60.
Sadhukhan, Pasupati. “Process of Desalination by Direct Contact Heat Transfer.” US Patent
4238296. December 1980.
Miller, Joel V. “Desalinization Method and Apparatus.” US Patent 5729987. March 1998.
APPENDIX
EPCO HOLDINGS, INC. Burlington, MA USA
Case Name: CASE2 C.HSC
Unit Set: GasPlant1
Date/Time: Fri Apr 10 14:21:44 2009
Material Stream: 1
Fluid Package: Basis-1Property Package: ASME Steam
CONDITIONS
Vapour / Phase Fraction
Temperature: (F)
Pressure: (psig)
Molar Flow (MMSCFD)
Mass Flow (lb/hr)
Std Ideal Liq Vol Flow (USGPM)
Molar Enthalpy (Btu/lbmole)
Molar Entropy (Btu/lbmole-F)
Heat Flow (MMBtu/hr)
Liq Vol Flow @Std Cond (USGPM)
Overall 1.0000 162.2* -9.696* 1.517 3000 6.003 -1.030e+005 33.23 -17.15 5.998* Vapour Phase 1.0000 162.2 -9.696 1.517 3000 6.003 -1.030e+005 33.23 -17.15 5.998 Aqueous Phase 0.0000 162.2 -9.696 0.0000 0.0000 0.0000 -1.210e+005 4.233 0.0000 0.0000
PROPERTIES
Molecular Weight Molar Density Mass DensityAct. Volume Flow
Mass Enthalpy
Mass Entropy
Heat Capacity
Mass Heat Capacity
Lower Heating Value
Mass Lower Heating Value
Phase Fraction [Vol. Basis]
Phase Fraction [Mass Basis]
Partial Pressure of CO2
Cost Based on Flow Act. Gas Flow
Avg. Liq. Density
Specific Heat
Std. Gas Flow
Std. Ideal Liq. Mass Density
Act. Liq. Flow
Z Factor
Watson K
User Property
Partial Pressure of H2S
Cp/(Cp - R)
Cp/Cv
Heat of Vap.
Kinematic Viscosity
Liq. Mass Density (Std. Cond)
Liq. Vol. Flow (Std. Cond)
EPCO HOLDINGS, INC. Burlington, MA USA
Case Name: CASE2 C.HSC
Unit Set: GasPlant1
Date/Time: Fri Apr 10 14:21:44 2009
Material Stream: 1 (continued)
Fluid Package: Basis-1Property Package: ASME Steam
PROPERTIES
Mass Cv (Semi-Ideal)
Cv
Mass Cv
Cv (Ent. Method)
Mass Cv (Ent. Method)
Cp/Cv (Ent. Method)
Reid VP at 37.8 C
True VP at 37.8 C
Liq. Vol. Flow - Sum(Std. Cond) (Btu/lb-F) (Btu/lbmole-F) (Btu/lb-F) (Btu/lbmole-F) (Btu/lb-F) (psig) (psig) (barrel/day) Overall 0.3537 6.255 0.3472 ----13.75 205.7 Vapour Phase 0.3537 6.255 0.3472 ----13.75 205.7 Aqueous Phase 0.8911 16.84 0.9347 ----13.75 0.0000
COMPOSITION
Overall Phase
Vapour Fraction 1.0000COMPONENTS H2O MOLAR FLOW (lbmole/hr) 166.5270 MOLE FRACTION 1.0000 MASS FLOW (lb/hr) 3000.0000 MASS FRACTION 1.0000 LIQUID VOLUME FLOW (barrel/day)
205.8330
LIQUID VOLUME FRACTION
1.0000
Total 166.5270 1.0000 3000.0000 1.0000 205.8330 1.0000
Vapour Phase
Phase Fraction 1.000COMPONENTS H2O MOLAR FLOW (lbmole/hr) 166.5270 MOLE FRACTION 1.0000 MASS FLOW (lb/hr) 3000.0000 MASS FRACTION 1.0000 LIQUID VOLUME FLOW (barrel/day)
205.8330
LIQUID VOLUME FRACTION
1.0000
Total 166.5270 1.0000 3000.0000 1.0000 205.8330 1.0000
Aqueous Phase
Phase Fraction 0.0000COMPONENTS H2O MOLAR FLOW (lbmole/hr) 0.0000 MOLE FRACTION 1.0000 MASS FLOW (lb/hr) 0.0000 MASS FRACTION 1.0000 LIQUID VOLUME FLOW (barrel/day)
0.0000
LIQUID VOLUME FRACTION
1.0000
Total 0.0000 1.0000 0.0000 1.0000 0.0000 1.0000
K VALUE
COMPONENTS H2O MIXED 1.000 LIGHT ---HEAVY 1.000UNIT OPERATIONS
FEED TO Compressor: K-100 PRODUCT FROM Separator: V-100 LOGICAL CONNECTIONUTILITIES
( No utilities reference this stream )
PROCESS UTILITY
DYNAMICS
Pressure Specification (Active): -9.696 psig*
Flow Specification (Inactive) Molar: 1.517 MMSCFD Mass: 3000 lb/hr Std Ideal Liq Volume: 6.003 USGPM
EPCO HOLDINGS, INC. Burlington, MA USA
Case Name: CASE2 C.HSC
Unit Set: GasPlant1
Date/Time: Fri Apr 10 14:21:44 2009
Material Stream: 1 (continued)
Fluid Package: Basis-1Property Package: ASME Steam
Description
Material Stream: Distillate
Fluid Package: Basis-1Property Package: ASME Steam
CONDITIONS
Vapour / Phase Fraction
Temperature: (F)
Pressure: (psig)
Molar Flow (MMSCFD)
Mass Flow (lb/hr)
Std Ideal Liq Vol Flow (USGPM)
Molar Enthalpy (Btu/lbmole)
Molar Entropy (Btu/lbmole-F)
Heat Flow (MMBtu/hr)
Liq Vol Flow @Std Cond (USGPM)
Overall 0.0135 153.0 -10.70 14.19 2.808e+004 56.19 -1.209e+005 4.360 -188.5 56.14* Vapour Phase 0.0135 153.0 -10.70 0.1911 378.0 0.7563 -1.030e+005 33.56 -2.162 0.7557 Aqueous Phase 0.9865 153.0 -10.70 14.00 2.770e+004 55.43 -1.212e+005 3.962 -186.3 55.38
PROPERTIES
Molecular Weight Molar Density Mass DensityAct. Volume Flow
Mass Enthalpy
Mass Entropy
Heat Capacity Mass Heat Capacity
Lower Heating Value
Mass Lower Heating Value
Phase Fraction [Vol. Basis]
Phase Fraction [Mass Basis]
Partial Pressure of CO2
Cost Based on Flow
Act. Gas Flow
Avg. Liq. Density
Specific Heat
Std. Gas Flow
Std. Ideal Liq. Mass Density
Act. Liq. Flow
Z Factor
Watson K
User Property
Partial Pressure of H2S
EPCO HOLDINGS, INC. Burlington, MA USA
Case Name: CASE2 C.HSC
Unit Set: GasPlant1
Date/Time: Fri Apr 10 14:21:44 2009
Material Stream: Distillate (continued)
Fluid Package: Basis-1Property Package: ASME Steam
PROPERTIES
Molar Volume
Mass Heat of Vap.
Phase Fraction [Molar Basis]
Surface Tension
Thermal Conductivity
Viscosity
Cv (Semi-Ideal)
Mass Cv (Semi-Ideal)
Cv
Mass Cv
Cv (Ent. Method)
Mass Cv (Ent. Method)
Cp/Cv (Ent. Method)
Reid VP at 37.8 C
True VP at 37.8 C
Liq. Vol. Flow - Sum(Std. Cond) (ft3/lbmole) (Btu/lb) (lbf/ft) (Btu/hr-ft-F) (cP) (Btu/lbmole-F) (Btu/lb-F) (Btu/lbmole-F) (Btu/lb-F) (Btu/lbmole-F) (Btu/lb-F) (psig) (psig) (barrel/day) Overall 22.28 1007 0.0135 4.431e-003 ---15.91 0.8831 17.87 0.9918 ----13.75 1925 Vapour Phase 1633 ---0.0135 ---1.271e-002 1.078e-002 6.321 0.3509 6.221 0.3453 ----13.75 25.91 Aqueous Phase 0.2948 ---0.9865 4.431e-003 0.3813 0.4165 16.04 0.8904 16.95 0.9409 ----13.75 1899
COMPOSITION
Overall Phase
Vapour Fraction 0.0135COMPONENTS H2O MOLAR FLOW (lbmole/hr) 1558.5010 MOLE FRACTION 1.0000 MASS FLOW (lb/hr) 28076.5517 MASS FRACTION 1.0000 LIQUID VOLUME FLOW (barrel/day)
1926.3606
LIQUID VOLUME FRACTION
1.0000
Total 1558.5010 1.0000 28076.5517 1.0000 1926.3606 1.0000
Vapour Phase
Phase Fraction 1.346e-002COMPONENTS H2O MOLAR FLOW (lbmole/hr) 20.9799 MOLE FRACTION 1.0000 MASS FLOW (lb/hr) 377.9546 MASS FRACTION 1.0000 LIQUID VOLUME FLOW (barrel/day)
25.9318
LIQUID VOLUME FRACTION
1.0000
Total 20.9799 1.0000 377.9546 1.0000 25.9318 1.0000
Aqueous Phase
Phase Fraction 0.9865COMPONENTS H2O MOLAR FLOW (lbmole/hr) 1537.5211 MOLE FRACTION 1.0000 MASS FLOW (lb/hr) 27698.5972 MASS FRACTION 1.0000 LIQUID VOLUME FLOW (barrel/day)
1900.4287
LIQUID VOLUME FRACTION
1.0000
Total 1537.5211 1.0000 27698.5972 1.0000 1900.4287 1.0000
K VALUE
COMPONENTS H2O MIXED 1.000 LIGHT ---HEAVY 1.000UNIT OPERATIONS
FEED TO PRODUCT FROM
Mixer: MIX-100
LOGICAL CONNECTION
UTILITIES
( No utilities reference this stream )
EPCO HOLDINGS, INC. Burlington, MA USA
Case Name: CASE2 C.HSC
Unit Set: GasPlant1
Date/Time: Fri Apr 10 14:21:44 2009
Material Stream: Distillate (continued)
Fluid Package: Basis-1Property Package: ASME Steam
DYNAMICS
Pressure Specification (Inactive) -10.70 psig
Flow Specification (Inactive) Molar: 14.19 MMSCFD Mass: 2.808e+004 lb/hr Std Ideal Liq Volume: 56.19 USGPM
User Variables
NOTES
Description
Material Stream: stream 16
Fluid Package: Basis-1Property Package: ASME Steam
CONDITIONS
Vapour / Phase Fraction
Temperature: (F)
Pressure: (psig)
Molar Flow (MMSCFD)
Mass Flow (lb/hr)
Std Ideal Liq Vol Flow (USGPM)
Molar Enthalpy (Btu/lbmole)
Molar Entropy (Btu/lbmole-F)
Heat Flow (MMBtu/hr)
Liq Vol Flow @Std Cond (USGPM)
Overall 1.0000 355.6 4.054 3.539 7000 14.01 -1.014e+005 32.83 -39.40 14.00* Vapour Phase 1.0000 355.6 4.054 3.539 7000 14.01 -1.014e+005 32.83 -39.40 14.00
PROPERTIES
Molecular Weight Molar Density Mass DensityAct. Volume Flow
Mass Enthalpy
Mass Entropy
Heat Capacity
Mass Heat Capacity
Lower Heating Value
Mass Lower Heating Value
Phase Fraction [Vol. Basis]
Phase Fraction [Mass Basis]
Partial Pressure of CO2
Cost Based on Flow
Act. Gas Flow
Avg. Liq. Density
EPCO HOLDINGS, INC. Burlington, MA USA
Case Name: CASE2 C.HSC
Unit Set: GasPlant1
Date/Time: Fri Apr 10 14:21:44 2009
Material Stream: stream 16 (continued)
Fluid Package: Basis-1Property Package: ASME Steam
PROPERTIES
Partial Pressure of H2S
Cp/(Cp - R)
Cp/Cv
Heat of Vap.
Kinematic Viscosity
Liq. Mass Density (Std. Cond)
Liq. Vol. Flow (Std. Cond)
Liquid Fraction
Molar Volume
Mass Heat of Vap.
Phase Fraction [Molar Basis]
Surface Tension
Thermal Conductivity
Viscosity
Cv (Semi-Ideal)
Mass Cv (Semi-Ideal)
Cv
Mass Cv
Cv (Ent. Method)
Mass Cv (Ent. Method)
Cp/Cv (Ent. Method)
Reid VP at 37.8 C
True VP at 37.8 C
Liq. Vol. Flow - Sum(Std. Cond) (psig) (Btu/lbmole) (cSt) (lb/ft3) (USGPM) (ft3/lbmole) (Btu/lb) (lbf/ft) (Btu/hr-ft-F) (cP) (Btu/lbmole-F) (Btu/lb-F) (Btu/lbmole-F) (Btu/lb-F) (Btu/lbmole-F) (Btu/lb-F) (psig) (psig) (barrel/day) Overall -14.70 1.301 1.323 1.734e+004 24.55 62.36 14.00 0.0000 462.9 962.5 1.0000 ---1.814e-002 1.531e-002 6.599 0.3663 6.487 0.3601 ----13.75 479.9 Vapour Phase ---1.301 1.323 ---24.55 62.36 14.00 0.0000 462.9 ---1.0000 ---1.814e-002 1.531e-002 6.599 0.3663 6.487 0.3601 ----13.75 479.9
COMPOSITION
Overall Phase
Vapour Fraction 1.0000COMPONENTS H2O MOLAR FLOW (lbmole/hr) 388.5629 MOLE FRACTION 1.0000 MASS FLOW (lb/hr) 7000.0000 MASS FRACTION 1.0000 LIQUID VOLUME FLOW (barrel/day)
480.2771
LIQUID VOLUME FRACTION
1.0000
Total 388.5629 1.0000 7000.0000 1.0000 480.2771 1.0000
Vapour Phase
Phase Fraction 1.000COMPONENTS H2O MOLAR FLOW (lbmole/hr) 388.5629 MOLE FRACTION 1.0000 MASS FLOW (lb/hr) 7000.0000 MASS FRACTION 1.0000 LIQUID VOLUME FLOW (barrel/day)
480.2771
LIQUID VOLUME FRACTION
1.0000
Total 388.5629 1.0000 7000.0000 1.0000 480.2771 1.0000
K VALUE
COMPONENTS H2O MIXED ---LIGHT ---HEAVY---UNIT OPERATIONS
FEED TO Mixer: MIX-101 PRODUCT FROMValve: Pressure Control Valve
LOGICAL CONNECTION
Set: SET-1
UTILITIES
( No utilities reference this stream )
EPCO HOLDINGS, INC. Burlington, MA USA
Case Name: CASE2 C.HSC
Unit Set: GasPlant1
Date/Time: Fri Apr 10 14:21:44 2009
Material Stream: stream 16 (continued)
Fluid Package: Basis-1Property Package: ASME Steam
PROCESS UTILITY
DYNAMICS
Pressure Specification (Inactive) 4.054 psig
Flow Specification (Inactive) Molar: 3.539 MMSCFD Mass: 7000 lb/hr Std Ideal Liq Volume: 14.01 USGPM
User Variables
NOTES
Description
Material Stream: stream 15
Fluid Package: Basis-1Property Package: ASME Steam
CONDITIONS
Vapour / Phase Fraction
Temperature: (F)
Pressure: (psig)
Molar Flow (MMSCFD)
Mass Flow (lb/hr)
Std Ideal Liq Vol Flow (USGPM)
Molar Enthalpy (Btu/lbmole)
Molar Entropy (Btu/lbmole-F)
Heat Flow (MMBtu/hr)
Liq Vol Flow @Std Cond (USGPM)
Overall 1.0000 367.5 4.054* 5.055 1.000e+004 20.01 -1.013e+005 32.95 -56.23 19.99* Vapour Phase 1.0000 367.5 4.054 5.055 1.000e+004 20.01 -1.013e+005 32.95 -56.23 19.99
PROPERTIES
Molecular Weight Molar Density Mass DensityAct. Volume Flow
Mass Enthalpy
Mass Entropy
Heat Capacity
Mass Heat Capacity
Lower Heating Value
Mass Lower Heating Value
Phase Fraction [Vol. Basis]
Phase Fraction [Mass Basis]
Partial Pressure of CO2