in the population sciences published by the Max Planck Institute for Demographic Research Konrad-Zuse Str. 1, D-18057 Rostock · GERMANY www.demographic-research.org
DEMOGRAPHIC RESEARCH
VOLUME 24, ARTICLE 27, PAGES 671-708
PUBLISHED 5 MAY 2011
http://www.demographic-research.org/Volumes/Vol24/27/ DOI: 10.4054/DemRes.2011.24.27
Research Article
HIV/AIDS and time allocation
in rural Malawi
Simona Bignami-Van Assche
Ari Van Assche
Philip Anglewicz
Peter Fleming
Catherine van de Ruit
© 2011 Simona Bignami-Van Assche et al.
This open-access work is published under the terms of the Creative Commons Attribution NonCommercial License 2.0 Germany, which permits use, reproduction & distribution in any medium for non-commercial purposes, provided the original author(s) and source are given credit.
1 Introduction 672
2 Analytical framework 673
3 Data and methods 675
3.1 Study setting 675
3.2 Data source and analytical samples 676
3.3 Measures 679
3.3.1 Measures of individual time use 679 3.3.2 Measures of HIV-related household morbidity 679 3.3.3 Measures of AIDS-related household mortality 681
3.4 Methods of analysis 681
4 Patterns of time allocation and burden of HIV/AIDS-related household morbidity and mortality: An overview
682
4.1 Individual time allocation patterns 682 4.2 Burden of HIV/AIDS-related household morbidity 684 4.3 Burden of HIV/AIDS-related household mortality 687
5 Association of time allocation and HIV/AIDS-related household morbidity and mortality
689
5.1 Univariate analysis 689
5.2 Multivariate regression analysis 692 5.2.1 Individual time allocation and HIV/AIDS-related household
mortality
694
5.2.2 Response of individual time allocation to HIV-related household morbidity
695
6 Conclusion 696
7 Acknowledgements 697
References 698
APPENDIX 1 703
HIV/AIDS and time allocation in rural Malawi
Simona Bignami-Van Assche1 Philip Anglewicz2
Ari Van Assche3 Peter Fleming4 Catherine van de Ruit5
Abstract
AIDS-related morbidity and mortality are expected to have a large economic impact in rural Malawi, because they reduce the time that adults can spend on production for subsistence and on income-generating activities. However, households may compensate for production losses by reallocating tasks among household members. The data demands for measuring these effects are high, limiting the amount of empirical evidence. In this paper, we utilize a unique combination of qualitative and quantitative data, including biomarkers for HIV, collected by the 2004 Malawi Diffusion and Ideational Change Project, to analyze the association between AIDS-related morbidity and mortality, and time allocation decisions in rural Malawian households. We find that AIDS-related morbidity and mortality have important economic effects on women’s time, whereas men’s time is unresponsive to the same shocks. Most notably, AIDS is shown to induce diversification of income sources, with women (but not men) reallocating their time, generally from work-intensive (typically farming and heavy chores) to cash-generating tasks (such as casual labor).
1 Associate Professor, Département de Démographie, Université de Montréal, 3150 rue Jean-Brillant,
Montréal (Québec) H3C 3J7, Canada. Phone: (514) 343-7842. Fax: (514) 343-2309. E-mail: [email protected].
2 Assistant Professor, Department of International Health and Development, Tulane University School of
Public Health and Tropical Medicine, 1440 Canal Street, Suite 2200, New Orleans, LA 70112. Phone: (504) 988-3659. Fax: (504) 988-3653. E-mail: [email protected].
3 Associate Professor, Department of International Business, HEC Montréal, 3000, chemin de la
Côte-Sainte-Catherine, Montréal (Québec) H3T 2A7, Canada. Phone: (514) 340-7043, Fax: (514) 340-6987. Email: [email protected].
4 Project Manager, Malawi Diffusion and Ideational Change Project, Population Studies Center, University of
Pennsylvania, 3718 Locust Walk, 239 McNeil Building, Philadelphia, PA 19104. Phone: (215) 898-6441. Fax: (215) 898-2124. E-mail: [email protected].
5
1. Introduction
Because the household is the primary unit of production throughout sub-Saharan African countries, AIDS-related morbidity and mortality are likely to have the most immediate economic impact at the household level (de Waal and Whiteside 2004; Zaba et al. 2004; Barnett et al. 2005; Masanjala 2005). This impact may be particularly severe when compared to the impact of other diseases, since HIV/AIDS usually affects prime-age adults at the peak of their economically productive years, and incapacitates them for significant periods of time before causing their death (Beegle 2005). Moreover, because HIV is sexually transmitted, the impact is often compounded if one spouse is infected by the other. Finally, HIV/AIDS often affects both production and consumption patterns in sub-Saharan Africa: i.e., production is reduced because of prolonged illness and untimely death due to AIDS, and consumption is affected because of increased expenditures on treatment, transportation, and funerals. When income drops below expenditures, assets are depleted as households use them to meet their augmented needs.
The direct effects of illness and death on production may be mitigated by a variety of coping strategies (see McIntyre et al. 2006 for a comprehensive review of these strategies). Existing studies have found that intra-household labor substitution is a particularly important strategy for compensating for production losses in households afflicted by illness (Weisbrod 1973; Nur 1993; Sauerborn et al. 1996; Goudge and Govender 2000). To our knowledge, however, no such study has focused on AIDS-related morbidity and mortality. Estimating the effects of HIV/AIDS on intra-household labor is indeed quite demanding of the data: it requires not only time-use data, but also information on the HIV status of household members, which is rarely collected. Most of the empirical evidence on the economic impact of the epidemic in sub-Saharan Africa thus comes from a small number of studies that lack data on intra-household labor allocation (Beegle 2005 is an exception) and on HIV status, which is typically proxied simply by illness and death (Booysen 2002; Oni et al. 2002; Yamano and Jayne 2004).
coped with AIDS-related morbidity and mortality, including time allocation. We anticipate that labor supply will serve as an important response mechanism to household morbidity and mortality.
The remainder of this paper is structured as follows. In Section 2, we present a model of time allocation that incorporates household morbidity and mortality. Section 3 describes the data used for the analysis, and introduces the context for the study. Section 4 gives a descriptive overview of MDICP-3 respondents’ time allocation in broad categories of work (agricultural, non-agricultural, and domestic) as well as of the burden of AIDS-related morbidity and mortality carried by their households. Section 5 presents univariate and multivariate results about the association between our outcome of interest (time allocation) and selected indicators of HIV/AIDS-related household morbidity and mortality. Section 6 provides concluding remarks.
2. Analytical framework
To evaluate the association between HIV morbidity and AIDS-related mortality and individual time allocation in rural Malawi, we expand the framework developed by Beegle (2005) in her Tanzanian study. Beegle approached time allocation across household activities as a utility maximization problem, and hypothesized that the preceding illness and subsequent death of a household member affects the allocation of time of the remaining members through several pathways: (i) the total stock of time available for allocation in the household, primarily because the total time of the deceased is gone; (ii) the effective time of the dying household member, because the illness preceding the death might be associated with physical disabilities or limited activities; (iii) and the expenditures associated with death and asset stocks (if they are inherited by individuals outside the household after a death), which may result in a reduction in the full household income. Beegle thus models the time allocated to activity j by individual i (Tji) in the reduced form as follows:
ih h h
i h j
i V X Z D
T =β0+β1 +β2 +β3 +β4 + +ε (1)
ih
ε
where Vh is a vector of village-level characteristics (such as wage rates, prices, and
infrastructure), Xi is a vector of individual-level characteristics (including age,
education, and headship), Zh is a vector of household production characteristics, Dh is a
individual error term that is assumed to be independently and identically distributed with a mean of zero and a variance 2.
ε
σ
h I
β3 +
The main limitation of Beegle’s approach is that no direct information on the burden of AIDS-related illness is available in her Tanzanian data set when estimating equation 1. This is an important issue because, as was mentioned above, the constraints imposed on the effective time of household members by the debilitating illness of the deceased is one of the main pathways through which AIDS-related mortality may affect household income. To take this limitation into account, Beegle assumed that “future deaths”—that is, deaths occurring in between two survey waves—should identify households with very ill household members, and that in these households time allocation is likely to be affected because of an ex ante illness response, and an ex post death response. As will be explained in detail below, we seek to better address this issue by drawing on the rich data set of the 2004 Malawi Diffusion and Ideational Change Project, which enables us to use direct measures of the burden of HIV-related household morbidity. Specifically, we estimate a model that can be formalized as follows:
ih h h
i j
i X Z D
T =β0+β1 +β2 + β4 +ε (2)
In this equation, Xi is a vector of individual characteristics, including age and
education. Zh is a vector of household characteristics, which include the following: district of residence (north, center, or south), household wealth (as measured by a set of dichotomous assets indicators and land ownership), and type of family arrangement (household size, polygamous/monogamous household).6 Ih is a set of variables describing the burden of illness in the household, which include the following: the respondent’s HIV status (if tested); information on whether the respondent, his/her spouse, or both (if married) were ill at the time of the survey; and information about whether other household members were ill at the time of the survey. Finally, the burden of AIDS-related household mortality is represented by Dh, a dummy variable for the occurrence of a dependent death (child or elderly) or prime-age adult death in the household during the five years preceding the survey.
We acknowledge that there are unobserved factors that could be associated with both AIDS-related morbidity and mortality and income earning. It is, however, difficult
6 We exclude from the set of regressors household composition variables which might be endogenous because
to control for these factors due to the cross-sectional nature of the data used for the study (described in detail in the next section), and we thus cannot establish a causal link between AIDS-related morbidity and mortality and time allocation. When possible, however, we use qualitative evidence to inform our interpretation of the results and the conc usions that we draw from the study. l
3. Data and methods
3.1 Study setting
Malawi is one of the poorest countries in Africa, and it has the ninth-highest HIV prevalence in the world (UNAIDS 2006). According to the 2004 Malawi Demographic Health Survey, among men and women aged 15-49 who were tested for HIV, HIV prevalence was 17.1% for those who lived in urban areas, compared to 10.8% for those who were living in rural areas (National Statistical Office and ORC Macro 2005).
Malawi is a predominantly rural country, with approximately 80% of men and women living in rural areas (National Statistical Office and ORC Macro 2005). As might be expected in this rural setting, approximately 90% of the total workforce is involved in the agricultural sector (UNDP 2002). Most of the production is for subsistence and small-scale retail, but cash crops (primarily tobacco, cotton, and tea) are also grown. In addition, agricultural production is supplemented by wage labor, either in the modern sector, or in the form of casual, part-time agricultural labor for others.
homegrown produce or baked goods, while men sell higher-end items, such as clothing, which require greater capital input. Finally, there are differences in cultural practices across regions that may affect farming patterns. For example, the northern region of Malawi follows a patrilocal tradition, and the southern and central regions are primarily matrilocal. These traditions exert different influences on land access (Green and Baden 1994; Kerr 2005).
3.2 Data source and analytical samples
We use quantitative and qualitative data collected by the Malawi Diffusion and Ideational Change Project to evaluate the association of AIDS-related morbidity and mortality and individual time allocation to different activities (farming, non-farming including cash-generating activities, and household labor). Since 1998, the MDICP has collected longitudinal data for a population-based sample of approximately 3,000 respondents to examine the role of social networks in changing attitudes and behavior regarding HIV/AIDS, family size, and family planning. The MDICP was designed as a couples’ survey, targeting approximately 1,500 ever-married women and 1,000 of their husbands in rural areas of three Malawian districts, one in each of the three regions of the country (north, center, and south).7 After household enumeration of the three survey sites was conducted, a random sample of approximately 500 ever-married women aged 15 to 49 were selected to be interviewed at each site. If these women were currently married, their spouses were also eligible to participate in the survey (Watkins et al. 2003). Each successive wave of the MDICP followed up the respondents in the 1998 sample, and researchers also interviewed any new spouses if the respondents had remarried between survey waves.
The quantitative data used in the present study come from the third wave of the MDICP, which was carried out in the summer of 2004 (henceforth, MDICP-3). In the MDICP-3, respondents from the original MDICP-1 sample—and, if they had remarried between survey waves, their new spouses8— yielded interviews with 1,526 women and 1,071 men aged 15 or older. The response rate for the MDICP-3 was 66.2% for women
7 While there are different definitions of “marriage” across and within countries in sub-Saharan Africa
(Meekers 1992; van de Walle 1968), the MDICP relies on respondents’ self-reported descriptions of their status as “married,” regardless of whether or not there had been any sort of public marriage ceremony.
8
and 57.9% for men. The two main reasons for non-response were having moved since the previous survey wave, and being away at the time of the interview.9
The MDICP-3 is well-suited for our purposes, because respondents were questioned about their time allocation during the previous workday, as well as about the burden of household morbidity and mortality, which will be discussed in detail in the following sections. In addition, the MDICP-3 offered individual voluntary biomarker testing, which allowed us to determine whether the respondents and his/her spouse (if married and tested) were infected with HIV at the time of the survey (details of the MDICP-3 biomarker testing protocol are provided in Section 3.3.2). The response rate for the MDICP-3 HIV testing program was quite high. Of all the respondents interviewed, 1,256 women (82.3%) and 841 men (78.5%) agreed to be tested for HIV. The main reason for non-response was not being found by the HIV testing team (because away). Since individual HIV status is a key variable in our analytical framework, MDICP-3 respondents who were interviewed and tested for HIV represent the sample for the present analysis.
It is important to note that, although the MDICP-3 is the third wave of a longitudinal panel, because time-use data, HIV biomarker data, and information about household composition were not collected prior the MDICP-3, we could not exploit the longitudinal information from previous waves for the purposes of the present analysis.
In addition, the men seem to have had higher remarriage rates than the women in the MDICP-3 sample. As a result, of all of the 841 men interviewed and tested for HIV by the MDICP-3, only two (0.2%) were not married at the time of the survey because they were separated, divorced, or widowed. In contrast, the corresponding figure for women was 153 (12.2%) of 1,256.10 Time-use models (described in more detail in Section 3.4) cannot be estimated separately for this latter group because of its sheer size. For the purposes of the present analysis, we thus focus on the MDICP-3 samples of currently married adults (1,103 women and 839 men), but we also provide a descriptive overview of time-use patterns and AIDS-related morbidity and mortality for formerly married women.
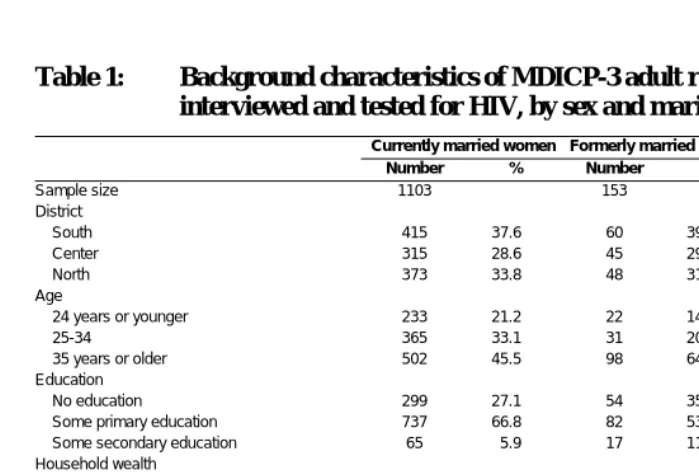
The background characteristics of our chosen samples are presented in Table 1. Overall, the respondents were almost equally distributed among the three survey sites
9 The MDICP-3 sample is thus skewed towards non-mobile individuals and, obviously, survivors. Deaths or
illness may result or hamper moves. Moves, in turn, may be linked with economic outcomes (moving to a better job, for example). It follows that our results may be under- or overstated, depending on assumptions about the economic impact of moving. Yet the data do not allow us to make assumptions in this regard, and the economic impact of moving in this sample remains speculative.
10 Among MDICP-3 respondents who were interviewed but not tested for HIV, the proportion of formerly
married is 11.1% for women (chi-squared test for difference in HIV testing status by marital status: 0.24,
p=0.623) and 7.0% for men (chi-squared test for difference in HIV testing status by marital status: 49.3,
(north, center, and south). 45.5% of respondents was 35 years or older (with formerly married women and currently married men being slightly older, as expected, than currently married women) and they tended to have some primary education. Household wealth was generally low, with less than 15% of respondents lived in a household with a tin roof. Almost one-quarter of currently married women and one-tenth of currently married men lived in a polygamous household. Finally, the majority of spouses of currently married respondents (62.4% for women and 75.1% for men) were also interviewed and tested for HIV. Compared to wives, husbands were less likely to participate in the survey, which is consistent with higher male mobility in the study setting.
Table 1: Background characteristics of MDICP-3 adult respondents who were interviewed and tested for HIV, by sex and marital status
Currently married women Formerly married women Currently married men
Number % Number % Number %
Sample size 1103 153 839
District
South 415 37.6 60 39.2 313 37.3
Center 315 28.6 45 29.4 246 29.3
North 373 33.8 48 31.4 280 33.4
Age
24 years or younger 233 21.2 22 14.4 99 9.2
25-34 365 33.1 31 20.3 235 21.9
35 years or older 502 45.5 98 64.1 690 64.4 Education
No education 299 27.1 54 35.3 127 15.1 Some primary education 737 66.8 82 53.6 543 64.7 Some secondary education 65 5.9 17 11.1 132 15.7 Household wealth
Household has iron roof 141 12.8 21 13.7 105 12.5 Household owns radio 800 72.5 65 42.5 661 78.8 Household owns bicycle 599 54.3 51 33.3 487 58.1 Household owns cattle 105 9.5 21 13.7 92 11.0 Household owns land 815 73.9 136 88.9 763 90.9 Family arrangement
Currently in polygamous household 256 23.2 n.a. n.a. 91 10.9 Interview and HIV testing status of spouse
Spouse neither interviewed nor tested for HIV 266 24.1 n.a. n.a. 135 16.1 Spouse interviewed only 115 10.4 n.a. n.a. 60 7.2 Spouse tested for HIV only 34 3.1 n.a. n.a. 14 1.7 Spouse interviewed and tested for HIV 688 62.4 n.a. n.a. 630 75.1
3.3 Measures
3.3.1 Measures of individual time use
The MDICP-3 individual questionnaire contained a section on time allocation (henceforth “time diary”), in which respondents were asked to provide information on the number of hours they had spent on different work or leisure activities during their most recent workday from the time they woke up until the time they went to sleep.
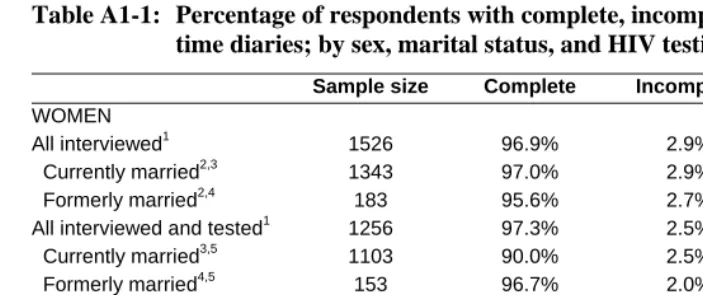
Overall, item non-response for the MDICP-3 time diary was low (Appendix 1, Table A1-1). Of all of the 1,526 women interviewed by the MDICP-3, only 44 (2.9%) respondents had incomplete, and four (0.3%) had missing time diaries. The corresponding figures for all men interviewed were 27 (2.5%) and two (0.2%). Among the currently married respondents who were tested for HIV (i.e., our analytical sample), item non-response for the time diary was even lower: 2.5% and 0.1% of women had, respectively, incomplete or missing time diaries; and the corresponding figures for men were 1.8% and 0.1%.11
We use information from the MDICP-3 time diary to calculate the respondent’s time allocation ( ij
T in equation 2) in the following three broad categories of work: agricultural labor, non-agricultural self-employment and wage employment, and domestic work (see Table A2-1 in Appendix 2 for details on the activities included in each group).
3.3.2 Measures of HIV-related household morbidity
To evaluate the burden of HIV-related household morbidity (Ih in equation 2) in our
sample, we use two measures: individual HIV status, and current illness of the respondent and other co-residing household members.
The first measure, HIV status, is imperfect. For sub-Saharan Africa, the median survival time from HIV infection to death has been estimated to be 9-11 years, but the duration from AIDS-related symptoms to death is approximately 5-9 months (Boerma et al. 1998). Thus, it is only at the end of the prolonged period of apparent health that there are likely to be illnesses that affect the allocation of time to household production. It is nonetheless interesting to include HIV status in our analysis, because at the time
11 As it can be seen in Appendix 1, Table A1-1 the difference in the item non-response between currently
the data were collected, antiretroviral treatment for HIV was not available. Thus, even when people knew their serostatus or believed they were infected, they assumed it would not be long before they died, which would reasonably affect their motivation to work.
HIV status for respondents in our sample was determined through voluntary biomarker testing. According to the MDICP-3 biomarker protocol (Bignami-Van Assche et al. 2004), after the survey interview was administered by locally recruited interviewers, all interviewed respondents were approached by a biomarker testing team. Written informed consent (either a signature or thumbprint) was obtained from all respondents who agreed to be tested. Then nurses trained in biomarker collection obtained saliva samples from respondents who consented. The biomarker samples were sent to a laboratory in Lilongwe, Malawi, where HIV antibody status was assessed using enzyme-lined immunosorbent asseys (ELISA) kits for initial screening, and positive results were confirmed by a Western Blot test. After the fieldwork, all of the respondents tested were given the opportunity to receive their results at temporary counseling centers set up in central locations within MDICP sample villages. The HIV test results were presented together with post-test counseling by a trained nurse within four months of testing (Thornton 2005).
The second measure of HIV-related morbidity that we use in the analysis is derived from information on current illness that was collected for all household members during the household interview. Before the beginning of the woman’s interview, a household informant (generally the household head) was asked to provide basic information about all household members. This information includes name, sex, regular membership in the household, relationship to the household head, age, parental survival, year of arrival in the household, education, marital status, and health status. The latter refers to whether each household member was ill at the time of the survey, was often ill, and/or was seriously ill at the time of the survey. We use this information to determine whether at the time of interview the respondent was ill or often ill,12 whether the respondent’s spouse (if married) was ill or often ill, and how many household members other than the respondent and his/her spouse (if any) were ill at the time of the survey.
Unfortunately, the household roster was not collected before the man’s interview. It follows that household-level information (including the burden of household morbidity) was not available for currently married men whose wives were not interviewed. As can be seen in Table 1 above, this group represents 17.8% of all currently married men interviewed and tested for HIV in the MDICP-3.
12
3.3.3 Measures of AIDS-related household mortality
To measure the burden of AIDS-related household mortality (Dh in equation 2) in our
sample, we rely on information that was collected in the individual questionnaire about the number of deaths experienced by the household in the five years preceding the survey, as well as about the ages at which those deaths occurred and the sex of the deceased household members. We had to rely on this self-reported information about household mortality because information about household composition was not collected prior to the MDICP-3.
As has been done in other studies (e.g.; Beegle 2005, Yamano and Jayne 2004; Evans and Miguel 2005), we use this information as a proxy for the potential impact of AIDS-related deaths in the household. An analysis of verbal autopsies of deaths between the 1998 and 2001 MDICP surveys indeed found that approximately two-thirds of all prime-age adult deaths were due to AIDS (Doctor and Weinreb 2003; Doctor 2004).
3.4 Methods of analysis
We begin the analysis by presenting a descriptive overview of time allocation patterns and the burden of AIDS-related morbidity and mortality for our study samples (currently married women, formerly married women, and currently married men). Next, we evaluate the univariate association between selected indicators of AIDS-related household morbidity and mortality, and the individual time allocation of currently married women and men. Finally, we estimate the model described in our analytical framework (i.e., equation 2) by fitting a series of tobit models (Tobit 1958; Amemiya 1984) to the MDICP-3 time-use data for currently married respondents.
To elaborate on the results of the quantitative analysis, we draw from a set of in-depth qualitative interviews with MDICP-3 respondents in 18 households, which were carried out in the southern and central districts of Malawi between June and August of 2005 under the supervision of Van de Ruit and Fleming. A purposive sample of MDICP-3 households was employed: a third of sampled households were selected on the basis of one or more members being HIV-positive, another third were chosen because they had experienced a death during the three years before the MDICP-3, and the remaining households were selected because they had neither HIV-positive members nor recent household deaths.13 The study sought to understand accounts of
13
negative socioeconomic shocks (including ill health and death) and their social outcomes (including changes in livelihoods, family disruption, and changes in relationships within extended kin networks). Emphasis was placed upon the timing and sequence of events to explore the relationship between crises and their consequences.14
4. Patterns of time allocation and burden of AIDS-related household
morbidity and mortality: An overview
4.1 Individual time allocation patterns
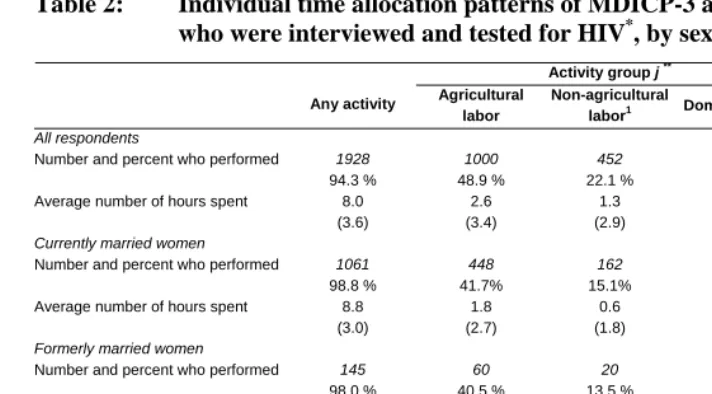
As can be seen in Table 2, 94.3% of respondents in our sample with complete time diaries reported having performed some type of work during the most recent workday. This proportion was found to be higher for women (regardless of their marital status) than for men, because most of the women (98.3% of currently married and 98.0% of formerly married women) reported having done domestic work in the previous workday, compared to less than one third (27.8%) of currently married men. In contrast, the proportion of respondents who indicated they carried out agricultural or non-agricultural work was found to be higher for men than for women, and the average number of hours spent doing either type of work was also shown to be considerably higher for men than for women.
14 The Malawian interviewers who carried out the qualitative data collection had an interview guide that
Table 2: Individual time allocation patterns of MDICP-3 adult respondents who were interviewed and tested for HIV*, by sex and marital status
Activity group j **
Any activity Agricultural labor
Non-agricultural
labor1 Domestic labor Sample size 2
All respondents
Number and percent who performed 1928 94.3 % 1000 48.9 % 452 22.1 % 1430 69.9 % 2045
Average number of hours spent 8.0 (3.6) 2.6 (3.4) 1.3 (2.9) 4.1 (3.7) Currently married women
Number and percent who performed 1061 98.8 % 448 41.7% 162 15.1% 1056 98.3% 1074
Average number of hours spent 8.8 (3.0) 1.8 (2.7) 0.6 (1.8) 6.4 (2.8) Formerly married women
Number and percent who performed 145 98.0 % 60 40.5 % 20 13.5 % 145 98.0 % 148
Average number of hours spent 8.0 (3.3) 1.9 (2.9) 0.5 (1.7) 5.6 (2.8) Currently married men
Number and percent who performed 722 87.7 % 491 59.7 % 270 32.8 % 229 27.8 % 823
Average number of hours spent 6.9 (4.1) 3.7 (3.9) 2.2 (3.8) 0.9 (2.2)
Notes: *Among respondents with complete time diaries, number and percent who performed any labor activity and specific
activities, and average number of hours spent doing any activity and specific activities during the last workday (with standard deviations in parentheses)
**
See Appendix 2 for details on the activities included in each group.
1 Includes non-agricultural self-employment and wage employment.
2 Excludes respondents with incomplete or missing time diaries (29 currently married women, five formerly married women,
Approximately half of the entire sample (59.7% of currently married men and 41.7% of currently married women) said they had farmed their own field or the fields of others during the most recent workday. As has been shown to be the case in other sub-Saharan African countries (e.g.; Beegle 2005), individual farm hours were low relative to Western standards, as they averaged slightly less than four hours daily among men, and slightly more than two hours daily among women. Since the MDICP-3 was carried out after the harvesting season15 and we do not have information about seasonal peak times, we cannot establish whether this is evidence of labor underemployment in agriculture.
Non-farm self-employment and wage employment were found to be less common economic activities than farming in the MDICP-3 sample. Only one-fifth of all respondents (one third of all married males) reported performing non-agricultural work, such as basket weaving and other artifact production, during the most recent workday.
All of the observed differences between women and men in the time spent doing any activity or specific activities are statistically significant (not shown). By contrast, the differences in time use found between currently and formerly married women respondents are not statistically significant, which suggests that the results of our multivariate analyses are not biased by the exclusion of this latter group. In addition, because the patterns of time use for respondents who agreed to be tested for HIV (shown in Table 2) and those who did not (shown in Appendix 1, Table A1-2) are not statistically different, the results are not likely to be biased because of our recruitment criteria.
4.2 Burden of AIDS-related household morbidity
As can be seen in Table 3, HIV prevalence in our sample is 6.7% among currently married women, 18.3% among formerly married women, and 7.4% among currently married men. Among the currently married respondents whose spouse was interviewed, the majority (55.3% of women and 66.4% of men) were HIV-negative concordant couples. In addition, in couples where at least one spouse was HIV-infected, serodiscordance (especially with the husband infected and the wife not infected) is slightly more common than concordance of HIV-positive status.
15 For the staple maize, the farming cycle begins in September or October. At this time, agricultural labor
Table 3: Burden of AIDS-related morbidity in households of MDICP-3 adult respondents who were interviewed and tested for HIV: individual HIV status and couple HIV status, by sex and marital status
Currently married women Formerly married women Currently married men Number % Number % Number %
Sample size 1103 153 839
Individual HIV status
HIV negative 1022 92.7 125 81.7 772 92.0 HIV positive 74 6.7 28 18.3 62 7.4
Indeterminate 7 0.6 0 0.0 5 0.6
Couple HIV status1
Concordant HIV+ 17 1.5 n.a. n.a. 16 1.9 Concordant HIV- 610 55.3 n.a. n.a. 557 66.4
W+, H- 23 2.1 n.a. n.a. 21 2.5
W-, H+ 31 2.8 n.a. n.a. 29 3.5
Other2 7 0.6 n.a. n.a. 7 0.8
Spouse not tested 415 37.6 n.a. n.a. 209 24.9
Notes: W+: wife is HIV+; W-: wife is HIV-; H+: husband is HIV+; H-: husband is HIV-.
1
Among currently married respondents whose spouse was interviewed.
2 Includes cases in which both spouses were tested for HIV, but one had an indeterminate HIV test result.
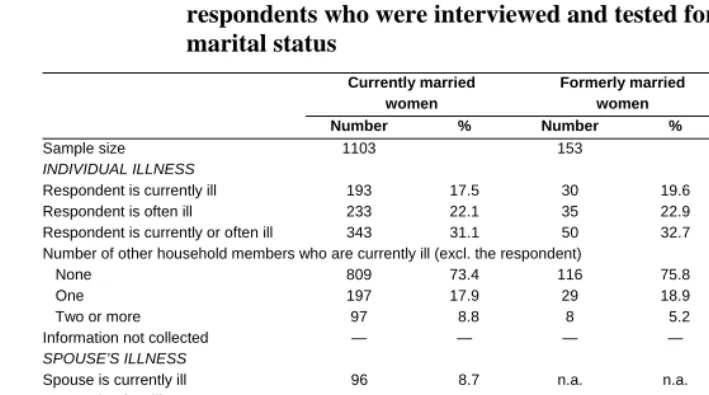
Table 4: Burden of AIDS-related morbidity in households of MDICP-3 adult respondents who were interviewed and tested for HIV, by sex and marital status
Currently married
women
Formerly married women
Currently married men
Number % Number % Number %
Sample size 1103 153 839
INDIVIDUAL ILLNESS
Respondent is currently ill 193 17.5 30 19.6 84 10.1 Respondent is often ill 233 22.1 35 22.9 100 11.9 Respondent is currently or often ill 343 31.1 50 32.7 141 16.8 Number of other household members who are currently ill (excl. the respondent)
None 809 73.4 116 75.8 474 56.5
One 197 17.9 29 18.9 163 19.4
Two or more 97 8.8 8 5.2 88 10.5 Information not collected — — — — 112 13.6 SPOUSE’S ILLNESS
Spouse is currently ill 96 8.7 n.a. n.a. 135 16.1 Spouse is often ill 131 11.9 n.a. n.a. 160 19.1 Spouse is currently or often ill 177 16.0 n.a. n.a. 237 28.2 Number of other household members who are currently ill (excl. the respondent and
his/her spouse)
None 819 74.3 n.a. n.a. 545 65.0
One 154 14.0 n.a. n.a. 113 13.5
Two or more 76 6.9 n.a. n.a. 60 7.2 Information not collected 54 4.9 n.a. n.a. 97 11.6
The proportion of currently married women whose husbands were also currently or often ill is lower than the proportion of women who were ill themselves; whereas the opposite can be seen for currently married men. Finally, 20.9% of currently married women and 20.7% of currently married men lived in households in which at least one other household member was ill at the time of the survey.
4.3 Burden of AIDS-related household mortality
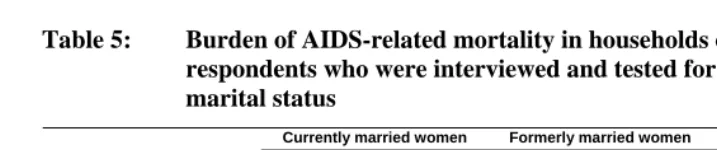
Approximately a quarter of the currently married respondents in our sample (24.9% of females and 24.6% of males) had experienced at least one death in their household during the five years preceding the survey (Table 5). This proportion is, as expected, much higher for formerly married women (41.8%). On average, 1.4 deaths occurred in the households of currently married women and men; the corresponding figure for the households of formerly married women is 1.6.
Table 5: Burden of AIDS-related mortality in households of MDICP-3 adult respondents who were interviewed and tested for HIV ‡, by sex and marital status
Currently married women Formerly married women Currently married men Number % Number % Number % At least one child death1 129 46.9 13 20.3 77 37.4 At least one adult death2 49 17.8 20 31.3 66 32.0
At least one adult & child death 12 4.4 5 7.8 8 3.9 At least one elderly death3 13 4.7 3 4.7 14 6.8
Unknown age at death 72 26.2 23 35.9 41 19.9 Any death 275 24.9 64 41.8 206 24.6
Notes: ‡ Occurrence of any household death and of at least an adult or child death in the five years preceding the survey. See Appendix 1 Table A1-3 for a more detailed breakdown.
1 Deaths of children less than 10 years old. 2
Deaths of adults 10-59 years old.
3 Deaths of adults age 60 years or older.
As can be seen in Table 5, one limitation of the data is that about 25% of respondents (and about 40% of formerly married women) could not remember or did not know the age at death of recently deceased household members. Yet the main problem we face when relying on individual reports to measure the occurrence of household deaths in highly AIDS-affected areas is that we may be trying to measure something that is not there (Zaba et al. 2004). This is because AIDS deaths stimulate a variety of responses, including an increase in household dissolution and in sending children to live elsewhere (Heuveline 2004; Monasch and Boerma 2004), so that household surveys might miss the surviving members who have relocated. Indeed, the MDICP-2 data indicate that 36% of the surviving spouses of respondents who had died could not be interviewed because they had relocated (comparable data for the MDICP-3 are not available). In addition, if the surviving household members had joined other households, survey questions addressed to the new household head may not shed light on the events that led to the relocation, because these events occurred in another household.
Another limitation of individual reports on the occurrence of deaths in the MDICP-3 households is that the definition of household membership of the deceased was left to the respondent. It is therefore not possible to evaluate whether the deceased had recently entered the household specifically because he or she was seriously ill and was seeking terminal care (Chimwaza and Watkins 2004), or had wished to die in his or her home area to save the family the cost of shipping a body. The qualitative interviews indeed contain several accounts of sick kin joining households to receive care. For example, Absalom16 told the story of his brother, who came back from Zambia with his wife and two children when he fell ill “because all his relatives were here [in Malawi] and that is where he could get more care than where he was.” Similarly, Delia Lungu, widowed and in ill health, reported that she returned to her brother’s compound after her husband’s death, where her nephew came to live with her to care for her. Indeed, among households in our sample that received new adult members (excluding new spouses) in the previous five years, a slightly higher proportion had experienced a death during the same period (for women: 27.9 vs 26.8%, p=.733; for men: 32.4 vs. 23.8, p=.109). It is, however, not possible to evaluate whether these new household members were indeed those who then died, or whether they arrived instead after the death of an existing member to help the surviving ones in dealing with the loss. This raises concerns that the event of an adult death in a household might be endogenous if fatally ill individuals are selecting households in which they intend to die (Chapoto and Jayne 2008).
5. Association of time allocation and AIDS-related household
morbidity and mortality
5.1 Univariate analysis
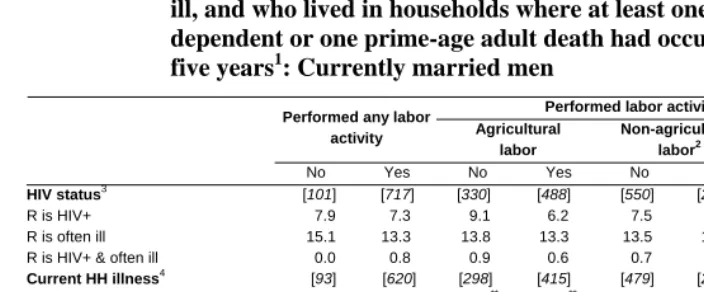
We begin by evaluating the univariate associations between our outcome of interest (time allocation) and selected indicators of AIDS-related household morbidity and mortality (Tables 6 and 7). Our univariate analysis leads to two main findings. First, AIDS-related household morbidity and mortality affect women’s time allocation, but not men’s, with only few exceptions. Second, for women, AIDS-related morbidity influences individual time allocation for labor-intensive activities, such as farming and domestic work; whereas AIDS-related mortality affects only the time allocated to cash-generating activities.
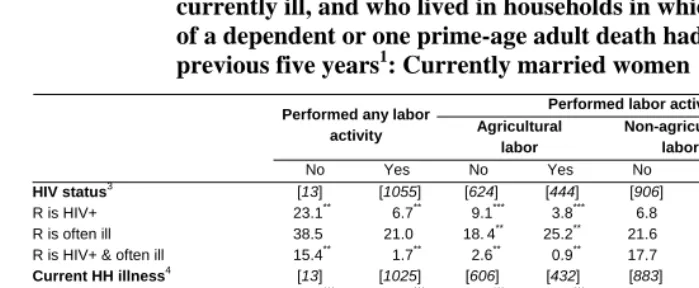
This is because the proportion of women who were HIV-positive was lower among those who had been engaged in agricultural labor and domestic labor during the previous workday than among those who had not done these activities (agricultural labor: 3.8% vs. 9.1%, p< .001; domestic labor: 6.8% vs. 16.7%, p<0.1). It is, however, the compounded effect of being HIV positive at the time of the survey, and of having been often ill prior to the survey date, that was associated with the largest differentials in time allocation: 15.4% of women who did not perform any work in the previous workday had been often ill and were HIV-positive, compared to only 1.7% of women who performed any work. This is because having been often ill and HIV-positive reduces the time spent in labor-intensive activities, such as domestic work and farming.
Table 6: Among MDICP-3 respondents who were interviewed and tested for HIV and who performed any labor activity or specific activities, percent who were HIV positive, who were HIV positive and often ill, who were currently ill, whose spouse was also currently ill or who lived in households in which other households members were currently ill, and who lived in households in which at least one death of a dependent or one prime-age adult death had occurred in the previous five years1: Currently married women
Performed labor activities in group j ‡
Performed any labor
activity Agricultural labor
Non-agricultural labor2
Domestic labor
No Yes No Yes No Yes No Yes HIV status3 [13] [1055] [624] [444] [906] [162] [18] [1050]
R is HIV+ 23.1** 6.7** 9.1*** 3.8*** 6.8 7.4 16.7* 6.8*
R is often ill 38.5 21.0 18.4** 25.2** 21.6 18.8 44.4** 20.8** R is HIV+ & often ill 15.4** 1.7** 2.6** 0.9** 17.7 2.5 11.1* 1.7*
Current HH illness4 [13] [1025] [606] [432] [883] [155] [18] [1020] R is currently ill 61.5*** 13.6*** 14.2*** 14.1*** 14.6 11.6 55.6*** 13.4***
R & S are currently ill 0.0*** 4.0*** 3.0*** 5.3*** 3.7 5.2 0.0*** 4.0***
Others are currently ill 15.4*** 18.3*** 24.5*** 23.6*** 18.1 19.4 16.7*** 18.3***
No one is currently ill 23.1*** 64.1*** 68.3*** 56.9*** 63.5 63.9 27.8*** 64.2***
Deaths in the HH in past 5 years5 [13] [988] [582] [419] [853] [148] [17] [984] At least one dependent death6 23.1 13.7 14.1 13.6 14.4** 10.8** 17.7 13.8
At least one prime-age adult death7 7.7 6.1 5.7 6.7 5.4** 10.1** 5.9 6.1 No deaths 69.2 80.2 80.2 79.7 80.2** 79.1** 76.5 80.1
Notes: ‡ See Appendix 2 for details on the activities included in each group. R: respondent; S: spouse; Others: other HH members (excluding respondent and spouse).
1 Sample sizes are indicated in parentheses above each set of percentages. For each set, we also indicate next to the
percentages the significance of chi-square tests for differences between those who performed any activity or specific activities, and those who did not (*p<0.1; **p<0.05; ***p<0.001).
2
Includes non-agricultural self-employment and wage employment.
3 Sample sizes exclude respondents with indeterminate HIV test results. 4
Sample sizes exclude 36 respondents for who did not provide information about current illness of household members.
5 Sample sizes exclude 73 respondents who could not indicate the age at death of recently deceased household members. 6 Includes only deaths of children less than 10 years old and deaths of adults age 60 years or older.
7
Table 7: Among MDICP-3 respondents who were interviewed and tested for HIV and who performed any labor activity or specific activities, percent who were HIV positive, who were HIV positive and often ill, who were currently ill, whose spouse was also currently ill or who lived in households where other households members were currently ill, and who lived in households where at least one death of a
dependent or one prime-age adult death had occurred in the previous five years1: Currently married men
Performed labor activities in group j ‡
Performed any labor
activity Agricultural labor
Non-agricultural labor2
Domestic labor
No Yes No Yes No Yes No Yes HIV status3 [101] [717] [330] [488] [550] [268] [592] [226]
R is HIV+ 7.9 7.3 9.1 6.2 7.5 7.1 7.3 7.5 R is often ill 15.1 13.3 13.8 13.3 13.5 13.7 12.5 16.4 R is HIV+ & often ill 0.0 0.8 0.9 0.6 0.7 0.7 0.8 0.4 Current HH illness4 [93] [620] [298] [415] [479] [234] [522] [191] R is currently ill 5.4 7.1 6.7** 7.0** 6.5 7.7 6.5 7.9
R & S are currently ill 6.5 4.7 3.7** 5.8** 5.0 4.7 5.6 3.1
Others are currently ill 17.2 27.4 21.5** 29.4** 26.5 25.2 26.6 24.6
No one is currently ill 71.0 60.8 68.1** 57.8** 62.0 62.4 61.3 64.4
Deaths in the HH in past 5 years5 [100] [682] [320] [462] [525] [257] [568] [214] At least one dependent death6 9.0 11.9 10.3 12.3 11.8 10.9 10.2* 15.0*
At least one prime-age adult death7 11.0 9.2 9.7 9.3 9.3 9.7 8.9* 11.2* No deaths 80.0 78.9 80.0 78.4 78.9 79.4 81.0* 73.0*
Notes: ‡ See Appendix 2 for details on the activities included in each group. R: respondent; S: spouse; Others: other HH members (excluding respondent and spouse).
1 Sample sizes are indicated in parentheses above each set of percentages. For each set, we also indicate next to the
percentages the significance of chi-square tests for differences between those who performed any activity or specific activities, and those who did not (*p<0.1; **p<0.05; ***p<0.001).
2
Includes non-agricultural self-employment and wage employment.
3 Sample sizes exclude respondents with indeterminate HIV test results. 4
Sample sizes exclude 110 respondents for who did not provide information about current illness of household members.
5 Sample sizes exclude 41 respondents who could not indicate the age at death of recently deceased household members. 6 Includes only deaths of children less than 10 years old and deaths of adults age 60 years or older.
7
Finally, deaths in the household during the five years before the survey affected only the proportion of women who carried out non-agricultural labor during the previous workday. Yet the effect was found to differ depending on the age of the deceased household members: in the case of a prime-age adult death, the proportion of women who engaged in cash-generating activities was higher than the proportion of women who did not; but the reverse was true if a dependent (child or elderly relative) had recently died.
5.2 Multivariate regression analysis
Table 8 presents the multivariate regression results for the response regarding daily hours spent farming, in non-farm self-employment and wage employment, and doing domestic work to AIDS-related morbidity and mortality.17 The main finding of our multivariate regression analysis is that, as with the univariate analysis (presented in the previous section), AIDS-related morbidity modifies individual time allocation for labor-intensive activities, such as farming and domestic work; whereas AIDS-related mortality affects the time allocated to cash-generating activities. In the two sections that follow, we look at each of these findings in greater detail. In addition, the brunt of household AIDS-related sickness and death seems to have fallen on female household members, whereas men’s time allocation remained unaffected by these shocks. For this reason, in the discussion below we will concentrate on the results for women.
17
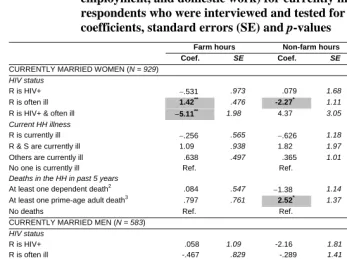
Table 8: Association between selected indicators of AIDS-related household morbidity and mortality and daily hours spent doing different labor activities (farming, non-farm self-employment and wage
employment, and domestic work) for currently married MDICP-3 respondents who were interviewed and tested for HIV, by sex1: coefficients, standard errors (SE) and p-values
Farm hours Non-farm hours Chores hours
Coef. SE Coef. SE Coef. SE
CURRENTLY MARRIED WOMEN (N = 929) HIV status
R is HIV+ −.531 .973 .079 1.68 −.270 .432 R is often ill 1.42** .476 -2.27* 1.11 −.048 .237 R is HIV+ & often ill −5.11** 1.98 4.37 3.05 −.740 .784 Current HH illness
R is currently ill −.256 .565 −.626 1.18 -.612** .269 R & S are currently ill 1.09 .938 1.82 1.97 −.713 .475 Others are currently ill .638 .497 .365 1.01 .122 .243
No one is currently ill Ref. Ref. Ref.
Deaths in the HH in past 5 years
At least one dependent death2 .084 .547 −1.38 1.14 .473* .260
At least one prime-age adult death3 .797 .761 2.52* 1.37 −.776** .371
No deaths Ref. Ref. Ref.
CURRENTLY MARRIED MEN (N = 583) HIV status
R is HIV+ .058 1.09 -2.16 1.81 .770 1.23 R is often ill -.467 .829 -.289 1.41 .961 .939 R is HIV+ & often ill -1.21 3.10 -2.94 6.25 -1.79 3.91 Current HH illness
R is currently ill -1.52 1.09 3.32 1.79 -.605 1.25 R & S are currently ill 1.42 1.18 2.61 2.01 -2.48 1.48 Others are currently ill 0.26 .586 .796 .996 -.017 .683 No one is currently ill Ref. Ref. Ref.
Deaths in the HH in past 5 years
At least one dependent death2 .619 .810 -.481 1.37 .477 .917
At least one prime-age adult death3 .318 .995 -1.24 1.75 .650 1.15
No deaths Ref. Ref. Ref.
Notes: *p<0.1; **p<0.05; ***p<0.001.
1 The covariates included in the models are: district of residence, age, education, socioeconomic status, family arrangement
(polygamous or monogamous), and household size.Coefficients, standard errors, and p-values for the other covariates are presented in Appendix 1, Table A1-4.
2 Includes only deaths of children less than 10 years old and deaths of adults aged 60 years or older. 3
5.2.1 Individual time allocation and AIDS-related household mortality
A prime-age adult death increases the time that surviving female household members spend doing non-agricultural work by approximately 2.5 hours daily. This finding is not surprising given that wage employment and non-farm self- employment have been shown to be the main cash-generating activities for MDICP households. When a family member dies, the extra cash flow the women generate helps to replace the lost income of the deceased, and to cover immediate expenditures for both medical expenses and funeral activities. Other studies have indeed shown that, in Malawi, ganyu(casual labor) is an important source of livelihood, especially for the poorer categories of households, and that it is also often the only coping strategy for these households when they are faced with stress in their livelihoods (Shah et al. 2002). The qualitative interviews support this result, and help in clarifying the type of cash-generating activities women are engaged in, typically casual work and micro-enterprise activities. For example, after the death of her husband, Felicity Sindo started a small-scale business selling banana fritters at the market in order to make up for the reduced farm output associated with the loss of her husband’s manpower. Similarly, Nat Mkandawire recounted that her family’s efforts to sustain their tobacco cultivation were undermined by the illness and subsequent death of her two children, and that the family had to rely on subsistence agriculture and ganyulabor to sustain their livelihood. These strategies must be seen in the context of wider challenges to income diversification in rural Malawi, which include land shortages, environmental conditions such as drought, increasing land rental rates, and limited infrastructural support for both agricultural and small enterprises in the form of loans (Peters 2006).
The time spent doing domestic work also appears to be affected by the recent death of an adult: women slightly decrease their chore hours (by about three-quarters of an hour) following the death of a prime-age household member, which could be due to the fact that the deceased had required care prior to death. Interestingly, women slightly increase their chore hours (by about half an hour) following the death of a dependent, which could suggest that children (who represent, as noted earlier, the largest proportion of household dependents in this setting) share the burden of domestic work, perhaps by providing care for ill household members.
are well-known in rural Malawi, as is the fact that there is no cure for AIDS. Thus, once it is evident that an individual may have AIDS, or if a person is suspected of having AIDS, households are likely to anticipate a death. An alternative coping mechanism is drawing on hired or non-hired labor (e.g., assistance from family members, friends, or neighbors) to maintain agricultural output. Adjustments in household composition might also be important in coping with an adult death (see Beegle 2005 for a similar argument). As noted earlier, households in our sample that experienced adult deaths were indeed more likely to have received new adult co-residents. This suggests that the households most vulnerable to prime-age deaths may be those without access to new household members, making them prone to dissolution.
5.2.2 Response of individual time allocation to HIV-related household morbidity
AIDS-related household morbidity seems to have a larger effect than household mortality on women’s time allocation. As we noted earlier, HIV status is an imperfect measure of morbidity, since the infected may remain asymptomatic for several years. Indeed, HIV status alone is not significantly associated with individual time allocation in any model. It is rather the compounded effect of being HIV-positive, and of having been often ill prior to the survey, that is negatively and significantly associated with decreased farm hours (about five) and about three quarters of an hour less spent doing domestic work, although this latter effect is not statistically significant. Having been often ill is also significantly associated with decreased time spent doing non-agricultural work (approximately two hours).
Unlike having been often ill prior to the survey date, being currently ill does not have a significant association with either farm or non-farm hours. Rather, and perhaps not surprisingly, being currently ill slightly reduces chore hours (by about half an hour). By contrast, women’s time is unresponsive to the illness of her spouse or of other household members. It therefore appears that women do not offer replacement labor when other household members, including their spouses, are incapacitated or bedridden. In addition, this raises the possibility that the burden of caring for sick household members falls on others living in the household, mostly notably children. Once again, this is consistent with our finding about the changes in time allocation in response to recent household deaths. Further research is needed to better address the question of how children’s caregiving roles fit into the broader patterns of care and support provided by households (Robson et al. 2006).
6. Conclusion
HIV/AIDS morbidity and mortality are expected to have a large economic impact in Malawi, since they reduce the time that adults can spend on subsistence production and income-generating activities. However, the data demands for estimating this impact are high, limiting the amount of empirical evidence. In this paper, we took advantage of quantitative and qualitative data collected by the 2004 Malawi Diffusion and Ideational Change Project to analyze the association between AIDS-related morbidity and mortality and time allocation decisions for rural Malawians.
7. Acknowledgements
References
Adato, M., Lund, F., and Mhlongo, P. (2003). Innovations in mixed methods to understand poverty dynamics: A multidisciplinary approach to longitudinal research in KwaZulu-Natal, South Africa. In: Moser, C. (ed.). Urban Longitudinal Research Methodology: Objectives, Contents and Summary of Issues Raised at the Joint DPU-ODI-World Bank-DFID Workshop. London: University College London: 78-82.
Amemiya, T. (1984). Tobit models: A survey. Journal of Econometrics 24(1-2): 3-61.
doi:10.1016/0304-4076(84)90074-5.
Barnett, T., Tumushabe, J., Bantebya, G., Ssebuliba, R., Ngasongwa, J., Kapinga, D., Ndelike, M., Drinkwater, M., Mitti, G., and Haslwimmer, M. (2005). The social and economic impact of HIV/AIDS on farming systems and livelihoods in Rural Africa: Some experience and lessons from Uganda, Tanzania and Zambia. Journal of International Development 7(1): 163-176. doi:10.1002/ jid.3380070111.
Barwell, I. (1996). Transport and the village: findings from African village level travel and transport surveys and related studies. Washington, D.C.: The World Bank. (World Bank Discussion PaperNo. 344).
Beckerson, S.A. (1983). Seasonal labour allocation food supply and nutrition in subsistence and semi-subsistence farming households in Malawi, Africa.
[Master's thesis] Canada: University of Guelph.
Beegle, K. (2005). Labor effects of adult mortality in Tanzanian households. Economic Development and Cultural Change 53(3): 655-683. doi:10.1086/427410.
Bignami-Van Assche, S., Smith, K., Reniers, G., Anglewicz, P., Thornton, R., Chao, L.W., Weinreb, A.A., Watkins, S., Hoffman, I. (2004). Protocol for biomarker testing in the 2004 Malawi Diffusion and Ideational Change Project. Philadelphia, P.A.: Population Studies Center, University of Pennsylvania. (SNP Working Paper No.6).
Boerma, J.T., Nunn, A.J., and Whitworth, J.A. (1998). Mortality impact of the AIDS epidemic: Evidence from community studies in less developed countries. AIDS 12(Supplement 1): 1-14.
Brummett, R.E. (2002). Seasonality, labor and integration of aquaculture into Malawian smallhold farming system. The Worldfish Quarterly 25(1): 23-27.
Bryceson, D.F. and Howe, J. (1993). Rural household transport in Africa: Reducing the burden on women? World Development 21(11): 1715-1728. doi:10.1016/0305-750X(93)90079-O.
Chapoto, A. and Jayne, T.S. (2008). Impact of AIDS-related mortality on farm household welfare in Zambia. Economic Development and Cultural Change 56(2): 327-374. doi:10.1086/522894.
Chimwaza, A. and Watkins, S.C. (2004). Giving care to people with symptoms of AIDS in rural sub-Saharan Africa. AIDS Care 16(7): 795-807.
doi:10.1080/09540120412331290211.
Davison, J. (1992). Changing relations of production in Southern Malawi’s households: Implications for involving rural women in development. Journal of Contemporary African Studies 11(1): 72-84. doi:10.1080/02589009208729522.
De Waal, A. and Whiteside, A. (2004). New variant famine: AIDS and food crisis in Southern Africa. Lancet 362(9391): 1234-1237. doi:10.1016/S0140-6736(03)14548-5.
Doctor, H.V. (2004). Adult mortality in rural Malawi. Southern African Journal of Demography 9(1): 49-66.
Doctor, H.V. and Weinreb, A.A. (2003). Estimation of AIDS adult mortality by verbal autopsy in rural Malawi. AIDS 17(17): 2509-2513. doi:10.1097/00002030-200311210-00014.
Evans, D. and Miguel, E. (2005). Orphans and schooling in Africa: a longitudinal analysis. Berkeley, CA: Center for International and Development Economics Research, Department of Economics, University of California at Berkeley. (Working Paper No. C05-143).
Glaser, B.G. and Strauss, A.L. (1967). The Discovery of Grounded Theory: Strategies for Qualitative Research. New York: Aldine Publishing Company.
Green, C. and Baden, S. (1994). Women in Development in Malawi. United Kingdom: Institute of Development Studies, University of Sussex. (Bridge Development and Gender Report #23).
Heuveline, P. (2004). Impact of the HIV epidemic on population and household structure: The dynamics and evidence to-date. AIDS 18(Supplement 2): 45-53.
Kerr, R.B. (2005). Informal labor and social relations in Northern Malawi: The theoretical challenges and implications of Ganyu labor for food security. Rural Sociology 70(2): 167-187. doi:10.1526/0036011054776370.
Masanjala, W.H. (2005). HIV/AIDS, Household Income, and Consumption Dynamics in Malawi. In: Gillespie, S (ed.). AIDS, Poverty and Hunger: Challenges and Responses. Washington, D.C.: International Food Policy Research Institute: 57-74.
McIntyre, D., Thiede, M., Dahlgren, G., and Whitehead, M. (2006). What are the economic consequences for households of illness and of paying for health care in low and middle-income country. Social Science & Medicine 62(4): 858-865.
doi:10.1016/j.socscimed.2005.07.001.
Meekers, D. (1992). The process of marriage in African societies: A multiple indicator
approach. Population and Development Review 18(1): 61-78.
doi:10.2307/1971859.
Monasch, R. and Boerma, J.T. (2004). Orphans and child care patterns in Sub-Saharan Africa: An analysis of 40 national surveys. AIDS 18(Supplement 2): 55-65.
Morrow, S. and Smith, M. (1995). A grounded theory study: Constructions of survival and coping by women who have survived childhood sexual abuse. In: Cresswell, J. (ed.). Qualitative inquiry and research design: Choosing among five traditions. Thousand Oaks, CA: Sage Publications: 297-321.
Mtika, M.M. (2000). Social and cultural relations in economic action: The embeddedness of food security in Rural Malawi amidst the AIDS epidemic. Environment and Planning 32(2): 345-360. doi:10.1068/a31190.
National Statistical Office (NSO) [Malawi] and ORC Macro (2005). Malawi Demographic and Health Survey 2004. Calverton, Maryland: NSO and ORC Macro.
Oni, A., Obi, C.L., Okorie, T.D., and Jordan, A. (2002). The economic impact of HIV/AIDS on rural households in Limpopo Province. South African Journal of Economics 70(7):551-562. doi:10.1111/j.1813-6982.2002.tb01189.x.
Robson, E., Ansell, N., Huber, U.S., Gould, W.T.S., and van Blerk, L. (2006). Young caregivers in the context of the HIV/AIDS pandemic in sub-Saharan Africa's Population. Space and Place 12(2): 93-111. doi:10.1002/psp.392.
Rosenzweig, M. (1988). Risk, implicit contracts and the family in rural areas of low-income countries. Economic Journal 98(393): 1148-1170. doi:10.2307/ 2233724.
Sauerborn, R., Adams, A., and Hien, M. (1996). Household strategies to cope with the economic costs of illness. Social Science and Medicine 43(3): 291-301.
doi:10.1016/0277-9536(95)00375-4.
Shah, M.K., Osborne, N., Mbilizi, T., and Vilili, G. (2002). Impact of HIV/AIDS on Agricultural Productivity and Rural Livelihoods in the Central Region of Malawi. Zomba, Malawi: CARE International.
Thornton, R. (2005). The impact of incentives on learning HIV results. Paper presented at the Eric M. Mindich Conference on experimental social science. Cambridge, USA, March 1, 2005.
Tobit, J. (1958). Estimation of relationships for limited dependent variables. Econometrica 26(1): 24-36. doi:10.2307/1907382.
UNAIDS (2006). 2006 Report on the Global AIDS Epidemic. Geneva: UNAIDS.
United Nations Development Program [UNDP] (2002). The Economic Impact of the HIV Epidemic. Geneva: UNDP. http://www.undp.org/hiv/publications/ issues/english/issue02e.htm (March 3, 2010).
Van de Walle, E. (1968). Marriage in African censuses and inquiries. In: Brass, W. (ed.). The demography of tropical Africa. Princeton, Princeton University Press: 183-238.
Vaughan, M. and Chipande, G. (1986). Women in the Estate Sector of Malawi: The Tea and Tobacco Industries. Geneva: International Labour Office.
Weisbrod, B. (1973). Disease and Economic Development: the Impact of Parasitic Disease in St Lucia. Madison, WI: University of Wisconsin Press.
Wodon, Q. and Beegle, K. (2006). Labor shortages despite underemplyment? Seasonality in time use in Malawi. In: Blackden, C.M. and Wodon, Qu. (eds.). Gender, Time Use, and Poverty in Sub-Saharan Africa. Washington, D.C.: World Bank.
World Health Organisation [WHO] (2006). Mortality Country Factsheet 2006 – Malawi. Geneva: World Health Organisation. http://www.who.int/ whosis/mort/profiles/mort_afro_mwi_malawi.pdf (March 3, 2010).
Yamano, T. and Jayne, T.S. (2004). Measuring the impact of working-age adult mortality on small-scale farm households in Kenya. World Development 32(1): 91-119. doi:10.1016/j.worlddev.2003.07.004.
Young, A. (2005). The gift of the dying: The tragedy of AIDS and the welfare of future African generations. The Quarterly Journal of Economics 120(2): 423-466.
doi:10.1093/qje/120.2.424.
APPENDIX 1
Table A1-1: Percentage of respondents with complete, incomplete, or missing time diaries; by sex, marital status, and HIV testing status, MDICP-3
Sample size Complete Incomplete Missing
WOMEN
All interviewed1 1526 96.9% 2.9% 0.3%
Currently married2,3 1343 97.0% 2.9% 0.1%
Formerly married2,4 183 95.6% 2.7% 1.6%
All interviewed and tested1 1256 97.3% 2.5% 0.2%
Currently married3,5 1103 90.0% 2.5% 0.1%
Formerly married4,5 153 96.7% 2.0% 1.3%
MEN
All interviewed6 1071 97.3% 2.5% 0.2%
Currently married7 1053 97.2% 2.6% 0.2%
All interviewed and tested6 841 98.1% 1.8% 0.1%
Currently married7 839 98.1% 1.8% 0.1%
Notes: Figures for formerly married men are not presented because of small sample size.
1 Chi-squared test for difference in completeness of time use data by whether the respondent was tested for HIV, among all
women interviewed = 4.53; p=0.104.
2 Chi-squared test for difference in completeness of time use data by marital status, among all women interviewed = 15.1;
p=0.001.
3 Chi-squared test for difference in completeness of time use data by whether the respondent was tested for HIV, among
currently married women = 3.13; p=0.209.
4 Chi-squared test for difference in completeness of time use data by whether the respondent was tested for HIV, among
formerly married women = 2.78; p=0.249.
5
Chi-squared test for difference in completeness of time use data by marital status, among women interviewed and tested for HIV = 8.51; p=0.014.
6
Chi-squared test for difference in completeness of time use data by whether the respondent was tested for HIV, among all men interviewed = 9.67; p=0.008.
7 Chi-squared test for difference in completeness of time use data by whether the respondent was tested for HIV, among