in the population sciences published by the Max Planck Institute for Demographic Research Konrad-Zuse Str. 1, D-18057 Rostock · GERMANY www.demographic-research.org
DEMOGRAPHIC RESEARCH
VOLUME 24, ARTICLE 1, PAGES 1-44
PUBLISHED 07 JANUARY 2011
http://www.demographic-research.org/Volumes/Vol24/1/ DOI: 10.4054/DemRes.2011.24.1
Research Article
Thou shalt not pass?
Examining the existence of an immigrant
glass ceiling in Sweden, 1970-1990
Jonas Helgertz
This publication is part of the proposed Special Collection “Social Mobility and Demographic Behaviour: A Long-Term Perspective”, organized by Guest Editors Cameron Campbell, Jan Van Bavel, and Martin Dribe.
© 2011 Jonas Helgertz.
1 Introduction and background 2
2 Previous research 5
3 Data and method 9
3.1 Sampling and data source 9
3.2 Variable design 10
3.3 Methodological discussion 13
4 Results 15
4.1 Descriptive results 15
4.2 Estimation of empirical models 23
4.3 Interpreting the models using predicted probabilities 25
4.3.1 Private manufacturing sector 28
4.3.2 Public sector 31
4.3.3 Private service sector 34
4.4 Sensitivity analyses 37
5 Conclusions 38
6 Acknowledgements 40
Thou shalt not pass?
Examining the existence of an immigrant
glass ceiling in Sweden, 1970-1990
Jonas Helgertz1
Abstract
The paper studies a sample of natives and 18 immigrant nationalities in the Swedish labor market between 1970 and 1990. The purpose is examining the existence of an immigrant specific glass ceiling. Results suggest a considerable overall advantage in terms of the probability of experiencing upward occupational mobility for native Swedish males. Despite this, the pattern does not correspond to the theoretical expectations of a glass ceiling. Using the ISEI classification of occupational status, the advantage experienced by Swedish males is consistent in the private manufacturing and private service sectors, compared to the experience of immigrants and women. The public sector generally suggests a similar pattern according to linguistic background. In this sector, certain groups of women are, however, observed to experience an advantage from low occupational status origins.
1. Introduction and background
This paper addresses the existence of a labor market glass ceiling in a population of first generation immigrants and native Swedes in late 20th century Sweden. The term “glass ceiling” refers to a phenomenon where peripheral groups in the labor market experience disadvantages in their efforts to attain further upward mobility. This is a disadvantage that increases with the elevation of the position of origin. The concept is most frequently used in sociological research on gender-related differences. The glass ceiling hypothesis is, however, theoretically equally relevant in describing mechanisms in the labor market that may cause individuals, based on factors related to their country of origin, to face obstacles in progressing past a certain hierarchical level. In this paper, the focus will be on examining to what extent the presence of a glass ceiling can be attributed to characteristics related to gender and country of origin. This study will, furthermore, examine whether these mechanisms operate differently in various sectors of the Swedish labor market, which could entail certain particularities in terms of career opportunities. In the paper, the labor market outcomes in terms of upward occupational status transitions will be studied using a longitudinal sample of around 70,000 first generation immigrants and native Swedes from 1970 until 1990.
In the United States, the hypothesized existence of a glass-ceiling for immigrants and women led to the appointment of a federal body, “The Glass Ceiling Commission.” The Commission’s work resulted in a number of research papers regarding the issue in the mid 1990s. More generally, most studies with this hypothesis consider a post-1990 context and conclude by confirming the presence of disadvantaged groups. Regardless of whether the study focuses on the entire labor market or a smaller segment of it, this is sometimes taken to indicate the existence of a glass ceiling (Fernandez 1998, Tang 1993, 1997, Woo 1994). Confirmation of the hypothesis, implying disproportionate difficulty in attaining further upward mobility for peripheral groups, also appears robust despite differences in definitions of the dependent variables, which range from income to occupational status.
immigrants to Sweden has consisted mainly of refugees, to a large extent of non-European origin.2
Until the beginning of the 1970s and essentially coinciding with the shift in the immigrant inflow from labor to refugee migration, labor market outcomes for immigrants in Sweden were very favorable. Calculations by Ekberg (1990) show an even higher labor market participation rate for immigrants than for natives until the beginning of the 1970s. Thereafter, this rate decreased considerably and averaged 17% below that of the native population at the end of the 1980s. Therefore, the period examined in this paper was characterized by a continuously deteriorating situation for immigrants in the Swedish labor market. This result cannot be understood without taking into account several important differences between immigrant cohorts. Those migrating before 1970 – predominantly European labor migrants – consistently display a labor market attachment similar to that of the native population. Also, the earlier immigrant population shows a distribution across occupational categories that are considerably more similar to that of natives. Unsurprisingly, an increasing distributional discrepancy between the native and the immigrant population consistently implies that immigrants are occupying a growing share of the unskilled - low status - occupations.
Wadensjö (1976) shows that immigrants’ distribution across occupational categories in Sweden in 1970 was much more similar to that of natives among immigrants arriving between 1941- 1945 than among those arriving in 1970. Virtually the same pattern emerges in Ekberg (1990), suggesting that immigrants’ distribution across occupations becomes more similar to that of the native population as time spent in the country of destination increases. Using cross-sectional data from 1987, he reports that the occupational distribution pattern among immigrants arriving in Sweden before 1970 is much more similar to that of the total population than those immigrants that arrived in the 1980s. Overall, however, foreign citizens were clearly over-represented in manual, low-skill occupations. Whereas both studies show a certain degree of occupational mobility among immigrants, neither study addresses to what extent this process, which seems to represent a pattern of occupational assimilation, is increasingly or decreasingly restricted for access to high status occupations.
The gender dimension of the glass ceiling issue has been examined in empirical labor market research in a Swedish context, where the smaller share of women in advanced positions typically is viewed as confirmation of the glass ceiling’s existence. Stanfors (2007) reports distinct gender differences between labor market sectors, where only 30% of the management positions in the public sector were occupied by women in 1990, despite the fact that this sector is considered to be relatively favorable for women.
However, this figure is considerably higher than in the private sector, where it has been reported that only one out of ten management positions is held by a woman. Another study that exclusively examines the Swedish private sector suggests that the situation has improved over time, with women’s share in management positions increasing considerably from 1970 until 1990. Despite this, the share is still substantially lower than the corresponding figures for men (Meyerson and Petersen 1997). Interestingly, the authors of this study do not attribute the distinction to outright discrimination. Instead they claim that it depends more on gender differences in educational attainment and labor market participation. Another potential explanation for patterns of labor market outcomes may be related to horizontal segregation. Knocke (2001) reports that, in 1985, eight of the ten most common occupations were the same for both foreign and Swedish-born women. The result does not, however, indicate if the shares employed in elevated positions differ between native and immigrant women.
2. Previous research
The term “glass ceiling” refers to a labor market phenomenon in which women and minorities experience fewer opportunities for career progress, with an increasing disadvantage as the individual moves up the occupational status hierarchy. More specifically, a glass ceiling manifests itself in the form of increasing difficulty in achieving further career advancement, such as a promotion or a raise, when the individual rises higher in the hierarchy (Woo 1994). Whereas this phenomenon is universally expected, as opportunities for further advancement are negatively correlated with the level of the position of origin, the glass ceiling hypothesis also postulates that these problems disproportionally impact women and minorities. Furthermore, the disadvantage experienced by the peripheral groups is not determined by different endowments of labor market relevant characteristics. Explanations for the existence of a glass ceiling are typically dominated by demand side mechanisms. As will be argued here, it is also essential to consider supply side factors such as the varying returns to human capital, in particular when focusing on differences between natives and immigrants.
One of the most common explanations for the existence of a glass ceiling, as proposed in the literature that focuses on demand-side mechanisms, pertains to the top sphere of the occupational hierarchy as being “homo-social” (Bihagen and Ohls 2006). This implies that the top segment of the occupational hierarchy is dominated by native men who maintain its homogeneity by mainly recruiting individuals who resemble themselves. As a result, this effectively leads to a demand-side driven exclusion of women and minorities. Correspondingly, immigrant women could be expected to face a “double-penalty,” because they diverge from the “elitist” stereotype – typically represented by the native men - in two respects (Tang 1997).
immigrants exists, making the same arguments potentially relevant in this context as well. Regardless of what is the key mechanism for creating labor market segregation based on gender and country of origin, occupations in which females and certain immigrant groups are relatively dominant may, according to the theory potentially offer limited opportunities for upward mobility.
Despite the likelihood of a relative shortage of advanced positions in female or immigrant dominated occupations, being a male in such an occupation or sector is not necessarily believed to be associated with the same limitations as the peripheral group’s experience. Overall, men are considered to possess a “social vicinity” to the most influential actors regardless of their sector. This could lead to what has been argued to be a universal advantage in the promotion process that at least partly could compensate for the inherently poorer opportunities associated with a certain position (ibid). Also, according to Williams (1989), women in female dominated occupations tend to welcome men as potential “prestige-and-pay-raisers” and view them as better-suited representatives in negotiations. Theoretically, the same does not apply to women in the male-dominated sector because the presence of individuals with minority status in that context cannot be expected to provide any additional prestige. Instead, potential resistance from coworkers and managers based on the inappropriateness of a woman carrying out a “man’s job” could lead to the exclusion from valuable social networks and instead diminish opportunities for further professional advancement (Hultin 2003).
Employers have empirically been shown to typically rely on various methods of recruitment, a pattern that is linked to their labor market sector. The literature has indicated two types of recruitment channels, labeled formal or informal (SOU 2005). The main difference between the methods as regards this paper pertains to differences in how individuals are likely to be exposed to the recruitment methods of employers depending on their sector. At the time of interest for this study, the main formal recruitment channel in the labor market was represented by the employer’s posting a job vacancy through the National Labor Market Board. This channel arguably represents the most generally accessible source for becoming informed regarding an available position. While Swedish employers by law are required to inform the National Labor Market Board regarding their vacant positions, few indications would suggest this as actually being the case (Korpi 2001). Other formal channels of recruitment include the company posting the vacancy in various media, also a comparatively accessible form of information (Klingvall 1998).
recruitment channel for the employer as it is associated with considerably lower costs. Due to the immigrant’s typically less extensive network in the labor market, they are believed to be less able to utilize informal job search channels. While informal channels today emerge as the dominant recruitment method, it was only the third most popular method in 1989 (Harkman 1990). While empirical research on Sweden for the time period before 1990 are scarce, studies on the subsequent period suggest noteworthy differences between the typical recruitment methods used by the labor market sectors.
Employers in the public sector appear to be over-represented in the use of formal channels such as the National Labor Market Board or advertisements in the media (Ekström 2001). The employment procedure in the public sector should also be characterized by considerably more formalized recruitment procedures, potentially translating to a more transparent process (SOU 2005). Correspondingly, actors in the private sector emerge as more likely to use informal recruitment channels (Ekström 2001). Empirical research has also shown informal methods as increasingly being used in the recruitment of personnel for positions requiring more advanced formal competence, frequently also associated with country specific skills, such as language (SOU 2005; Ekström 2001). The lack of empirical evidence regarding the recruitment methods used during the time period examined in this paper cannot, unfortunately, be a guide as to what extent such differences in the use of recruitment channels existed prior to 1989. It would appear to be reasonable to assume such differences as having emerged over an extended period of time and therefore potentially explaining why immigrants could be particularly penalized in the private sector.
Human capital theory remains the most commonly utilized theory in explaining individual labor market outcomes (Becker 1975; Mincer 1974). In explaining the suboptimal labor market outcomes frequently observed among immigrants, this theory has been linked to immigrants’ inability to fully transfer an education obtained in a foreign country as well as labor market experience to the new context. The problem has been identified to be related to the difficulty the potential Swedish employer has in gauging the productivity associated with a degree obtained in a foreign country. Furthermore, immigrants are believed to suffer from an inability to properly signal their capabilities. As a result, the immigrant may experience suboptimal labor market outcomes in terms of their returns to formal skills (Chiswick, Lee and Miller 2003). In the context examined here, the problems related to the untransferability of human capital may cause a foreign-educated attorney-at-law to accept employment in a lower status occupation, such as a janitor or bus driver, either for a period of time or permanently.
necessity in that it allows an individual to interpret and respond to labor market demand. It would, however, appear that such ability to acquire a new language is strongly dependent on the individual’s language background. This has been suggested by Chiswick and Miller (2005) and Beenstock, Chiswick and Repetto (2001) among others, suggesting the existence of an objectively defined distance between different languages. Although it is difficult to quantify such a distance, languages belonging to a common language family share a common historical origin and are more likely to have vocabularies and grammars that are similar than languages belonging to distant language families. This distinction may potentially have an effect on the process of linguistic assimilation. Moreover, individuals from countries whose official language not only belongs to a different language family but also use a writing system based on an alphabet other than Latin may, apart from learning a new grammar and vocabulary, face yet another obstacle in adapting to the language of the destination country.
In absolute terms, whereas an immigrant often suffers from a lower payoff from formal skills than will an otherwise similar native individual, the general conclusion from empirical labor market research on immigrants is that the return in absolute terms increases with the individual’s skill level (Dustmann 1993; Friedberg 2000; Nordin 2007). However, one should also consider the payoff that the individual expected to enjoy in terms of occupational attainment at the time the human capital investment was made. Therefore, one may conceptualize the post-migration situation for immigrants with advanced formal degrees and from countries suffering from elevated transferability problems as relatively worse than that for individuals of the same origin but with less advanced formal human capital. The increased transferability problems associated with advanced formal skills are also believed to be linked to differences in the typical demands between high and low status occupations. Occupations on the low status end of the distribution involve the performance of manual labor to a greater extent, leaving the employer with a comparatively easier task in assessing the potential immigrant employee’s productivity. Therefore, making such an assessment based on the individual’s formal credentials should be relatively minor. On this basis, immigrants with more basic formal skills are believed to be able to more quickly adapt to the destination country labor market because it is easier to match their formal skills with the skill requirements of the intended occupation.
formally low skilled individuals on average experience a better initial post migration matching between their occupation and their skill set, highly skilled immigrants may be forced to make extensive post migration investments. Such investments would be directed towards adjusting their human capital to the new context so that they would be able to attain an occupation similar to the one enjoyed prior to migration. Until these adjustments take place, the employer’s potential failure to recognize the true value of a degree obtained in a foreign country may lead to the upper end of the occupational status hierarchy being largely unavailable to affected individuals. Also, the pattern of an initial occupational status downgrading may be emphasized for individuals who speak languages that are the most dissimilar to the new language. With lower proficiency in the language of the destination country and fewer informal skills, the individuals will experience another obstacle for mobility into highly skilled occupations, especially given the assumed higher demands for Sweden-specific skills.
3. Data and method
3.1 Sampling and data source
This paper follows approximately 70,000 individuals of different origins throughout a part of their labor market career in Sweden between 1970 and 1990. The data used for the analysis comes from the Swedish Longitudinal Immigrant database (SLI), which contains information from a number of administrative registers; for example, the income register, into which data are recorded on a yearly basis and which provides information on income and various transfers. Another source are the censuses3 that are
undertaken every five years between 1970 and 1990, which contain essential information used to derive the individual’s occupational status. Due to the time interval between the censuses, observations related to the individual’s occupational status – which form the basis for the dependent variable - are recorded every five years. Furthermore, the database is equipped with information on various demographic events, internal migration and individual-level characteristics such as educational attainment. The database is essentially longitudinal, and individuals are followed from whichever date is latest: their birth, their arrival in Sweden or the year 1968.
The sample consists of natives and first-generation immigrants born in 18 different countries.4 Individuals were followed for at least six consecutive years in the Swedish
labor market - defined by their having an occupation - and for no longer than when they
turned 60 years of age. The empirical strategy employed here consists of analyzing the determinants of upward transitions in terms of occupational status, meaning that every individual needs to report an occupation during at least two consecutive censuses to be included in the sample. Thus, an individual reporting an occupation during every census in the period studied here (1970, 1975, 1980, 1985 and 1990) first becomes eligible for a transition in 1975. In this procedure, those individuals who remain under observation for five years or less or who fail to report an occupation during two separate censuses were excluded from the study. As is always the case for studies using self-reported information, this study may suffer from individuals reporting inaccurate information. To minimize such incorrect information influencing the results, income thresholds for all coded occupations according to the NYK78 occupational classification (Statistics Sweden 1989) were created based on the work incomes of the total Swedish working population. An individual stating that he/she is working as a nurse is therefore only treated as enjoying that occupational status if their disposable income exceeds the 25th percentile for individuals with a similarly coded occupation.5 Otherwise, they are
treated as unemployed. An additional purpose for applying an income threshold below which individuals are excluded from the analysis, is that this serves to mainly include individuals who are participating in the labor market to a noteworthy extent. The aim is to avoid biasing the results in the way that could otherwise result from the upward mobility expected of individuals working part time in low skill occupations while studying and subsequently advancing to an occupation matching their formal skills.6
3.2 Variable design
The outcome variable is based on changes in the individual’s occupational status and is coded according to the International Socio Economic Index (ISEI) classification of occupations.7 The classification arranges occupations continuously along a one
dimensional hierarchical scale on which a higher status score is synonymous with a higher occupational status. Due to the continuous nature of the ISEI classification, an increase of X status points can be interpreted as an equally large status improvement regardless of the status from which the transition occurs. The ISEI is designed to
5 Own calculations based on the Swedish Census of the Population.
6 In order to effectively exclude individuals who could still be in school, Model 4 is restricted to individuals over the age of 30. See tables A1 and A2, Appendix.
represent the educational requirements and earnings potential of an occupation and is constructed from weighted sums of the education and earnings of the individual’s in each occupation (Ganzeboom, De Graaf and Treiman 1992; Ganzeboom and Treiman 1996, 2003). The scores range from 16, the score for restaurant cleaners, to 90, the score for judges. The outcome variable in the study is categorical, and upward occupational mobility is defined as an increase in occupational status of five or more status points.8 Due to the design of the dependent variable, observations for individuals
with an origin status score exceeding 85 are excluded; these individuals are obviously unable to experience an upward transition past the threshold.
To estimate the effect of a given parameter on the probability of upward occupational mobility across various labor market sectors, multinomial logit models were estimated in which the outcome variable indicates whether an upward transition occurs in an occupation belonging to the public sector, the private service sector or the private manufacturing sector. These three categories of the labor market are intended to represent segments that potentially possess particular attributes and prerequisites for career progress.
The private manufacturing9 sector can be expected to be male dominated and
diminishing in terms of the share of the labor force employed over the time period here examined, potentially affecting the available opportunities for career progress. The private manufacturing sector includes occupations within the manufacturing of fabricated metal products, machinery and equipment, and building construction. Whereas the private manufacturing sector in itself is rather heterogeneous, it is also believed to fundamentally differ from the private service sector10 in that the latter
represents occupations that to a larger extent require language skills if one is to successfully perform typical tasks. Among others, occupations within different forms of retail trade, and jobs within real estate and engineering are allocated to the latter sector. The public sector11 contains traditionally female-dominated occupations within
education or health care, but also occupations within defense and policing that typically are male dominated. Lastly, the agricultural sector is excluded from the analysis because it is assumed to be largely different from the regular labor market, especially in terms of career dynamics and the mechanism linking formal qualifications to remuneration in terms of occupational status.
8 Sensitivity tests with different thresholds for transition (increase in ISEI of 10 or more status points) have been carried out, showing results not differing notably. See Model 3 in Tables A1 and A2, Appendix. 9 Including occupations within metal ore mining, manufacturing industry, electricity, gas and heating services, construction, repair, and other services.
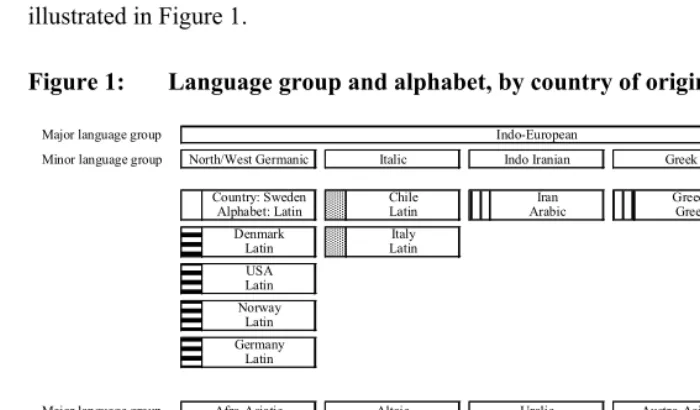
The utility of a particular formal education is expected to be related to the individual’s difficulty in adjusting to the destination country in terms of linguistic assimilation. To capture the influence of linguistic distance on the utility of a given degree, three discrete categories of educational attainment interact with categories representing characteristics of the official language of the individual’s country of origin, illustrated in Figure 1.
Figure 1: Language group and alphabet, by country of origin
Major language group Minor language group
Country: Sweden Chile Iran Greece Poland
Alphabet: Latin Latin Arabic Greek Latin
Denmark Italy Soviet Union
Latin Latin Cyrillic
USA Yugoslavia
Latin Cyrillic/Latin
Norway Czechoslovakia
Latin Latin
Germany Latin
Major language group
Iraq Turkey Finland Vietnam
Arabic Latin Latin Latin
Ethiopia Hungary
Amharic Latin
Legend: Swedish Germanic Latin Non-Latin
Indo-European
North/West Germanic Italic Indo Iranian Greek Slavic
Afro-Asiatic Altaic Uralic Austro-Asiatic
Source: Lewis (2009).
The sector-specific demand side mechanisms that affect the chances of upward occupational mobility are modeled by controlling for the individual’s original occupational status. As suggested by the background and theoretical sections, these demand side factors may also depend on factors linked to the individual’s sex and/or country of origin. In order to model this properly, original occupational status interacts with sex and the four constructed linguistic categories. The link between an individual’s occupational status and their likelihood for experiencing upward occupational mobility isnot likely to be linear. This motivates the inclusion of a second and third polynomial of the main origin occupational status effect. Also, the original design of the occupational status measurement – ranging from 16 through 90 – was altered for use in the econometric analysis in order for it to originate from zero. Hence the values 0/69 on the original occupational status variable used in the econometric analysis represent a real origin status of 16/85. The estimated models also control for a number of other individual and contextual variables, such as age, years since migration, and regional unemployment.
3.3 Methodological discussion
Following the previous literature, two conditions need to be fulfilled in order to confirm the existence of a glass ceiling (Baxter and Olin Wright 2000; Cotter et al. 2001). Firstly, the likelihood of further upward mobility from a given position in the occupational hierarchy must be lower for the peripheral group, in this case immigrants and women. The lower likelihood cannot, furthermore, be explained by differences in the individual’s job-relevant characteristics. Secondly, the relative difference in the likelihood of further upward mobility between the groups must increase when the original position in the occupational hierarchy is higher. In order to test the glass ceiling hypothesis empirically, the probability of experiencing upward mobility into each of the three aforementioned sectors are jointly estimated by multinomial logistic regression analysis. In order to account for the panel data structure with repeated observations for a given individual, STATA’s cluster command was used to obtain robust standard errors.
of upward mobility between different levels of origin occupational status. Therefore, using either the absolute or the relative differences in the predicted probabilities to examine the existence of a glass ceiling is associated with various problems. Illustrating between-group differences by using the absolute size of the probability difference means ignoring the fact that the magnitude of a 2% absolute difference in probability when the reference probability is 60% is highly different from when it is 1%. Therefore, it could be argued that such a procedure becomes rather uninformative. But to calculate a relative probability based on two groups’ predicted probabilities introduces another problem: the creation of an asymmetrical scale. In the situation in which the reference group’s probability of attaining upward mobility is higher, the relative probability approaches an infinitely positive value. This is illustrated by a scenario in which the reference group enjoys a probability of 90% and the comparison group experiences a probability of 1%, resulting in a relative probability of 90 (90/1). The opposite situation results in a relative probability of 0.01 (1/90) in which the probability approaches but never descends below zero.
In order to ameliorate the problems associated with these mentioned methods in examining the existence of a glass ceiling, probabilities are first transformed into their natural logarithm. From the transformed values, the comparison groups’ situation vis à vis that of the native male reference group is obtained by calculating the difference between log probabilities. A value of zero is interpreted as indicating that the comparison group experiences a probability of upward mobility equal to that of a native man, whereas a positive value indicates an advantage experienced by the native man.12
A pedagogically appealing feature of differences between the logarithmically transformed probabilities is that it yields a scale on which the native male’s advantage theoretically ranges between plus and minus infinity. Also, the log probability advantage easily transforms into more straightforwardly interpretable figures via exponentiation. The exponent of a given log probability advantage indicates the size of the actual native man’s probability of upward mobility in relation to that of the comparison group. A difference in the log probability of +1 yields an exponentiated figure of exp(1) = 2.7 that thus must be interpreted as indicating that the native man enjoys a likelihood of upward mobility 1.7 (2.7-1) times higher than the comparison group.13
12 Log(Probability, native man) – log(Probability, other group).
4. Results
4.1 Sample characteristics
The sample is comprised of 71,747 unique individuals, of whom 39,129 are men and 32,618 are women. The typical individual is observed at risk of experiencing a status transition 1.7 times, which means that these individuals’ average time under observation amounts to about 12 years. As emerges from Table 1, which contains the variable means, a greater linguistic difference between native language and Swedish appears to be associated with lower post migration occupational status, on average amounting to 10 status points less than the corresponding figures for the native individual. While not an unexpected observation, this could also be the result of the groups’ differing distribution across educational levels. For example, the Non-Latin group stands out as including a comparatively large share of individuals with only primary education. In fact, controlling for educational level, only rather small differences in the average occupational status between the groups can be observed, suggesting that average occupational status is strongly linked to these groups’ average formal educational attainment.
Table 1: Variable means
Sweden Germanic Latin Non-Latin
Year 1983.6 1983.4 1984.4 1984.5
Age 37.5 43.9 40.5 40.6
Sex (% women) 43.1% 41.3% 47.0% 39.3%
Civil status (% married) 54.2% 65.8% 67.1% 77.5%
Child under the age of 2 (%) 1.9% 5.0% 5.8% 8.1%
Primary education (%) 36.0% 37.6% 51.1% 58.4%
Secondary education (%) 49.6% 48.2% 39.0% 30.9%
University education (%) 14.4% 14.2% 9.9% 10.8%
Municipal share in high skill occupations* 29.8% 29.7% 32.1% 35.2%
Regional unemployment rate (%) 1.8% 1.7% 1.7% 1.5%
Immigration year - 1965.8 1970.8 1972.6
Years since migration - 17.7 13.7 12.1
Swedish citizen (%) - 29.5 39.4 49.4
Years since becoming Swedish citizen
(if citizen) - 8.58 7.07 5.71
Private manufacturing sector (%) 32.8 39.9 46.8 35.1
Private service sector (%) 29.2 24.2 22.5 23.4
Public sector (%) 38 35.9 30.7 41.5
ISEI occupational status 41.3 39.4 34.7 31.3
Country of origin
(ISO 3166-1-alpha-2 code****) SE
US, DE, DK, NO
CL, FI, IT, PL, CZ, TR, YU**, HU, VN
ET, GR, IR, IQ, RU***
N (observations) 138.423 13.774 42.202 7.769
n (individuals) 46.371 5.299 16.897 3.180
* Share of working individuals in high skill occupations within municipality (ISCO skill level 4) ** Former Yugoslavia
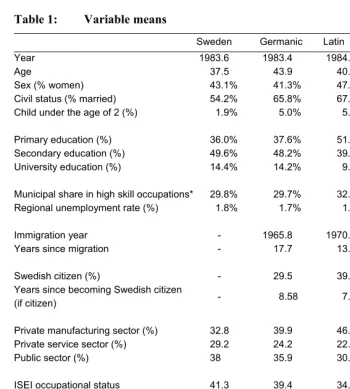
The structural transformation of the Swedish labor market that was occurring from 1970 to 1990 is clearly reflected in the data, wherein the share of individuals employed in occupations in the private manufacturing sector decreased considerably from 1970 (47%) to 1990 (31%). During the same period, the public sector increased its share of the sample from 18% to 32%. Taking into account the expected dominance of comparatively unskilled jobs in the private manufacturing sector, its decline undoubtedly resulted in a decreasing proportion of low status occupations in the labor market as a whole. Furthermore, the growth of the public sector, believed to offer relatively favorable career prerequisites for more marginalized groups in the labor market, could entail gradual improvement to opportunities for upward mobility. As a result of the labor market changes, towards the end of the period studied here, the sample was distributed across the three sectors in shares that were about equally large, as seen in Figure 2.
Figure 2: Sample distribution across labor market sectors
0% 5% 10% 15% 20% 25% 30% 35% 40% 45% 50%
1970 1975 1980 1985 1990
Private manufacturing Public Private service
Source: Swedish Longitudinal Immigrant database, own calculations
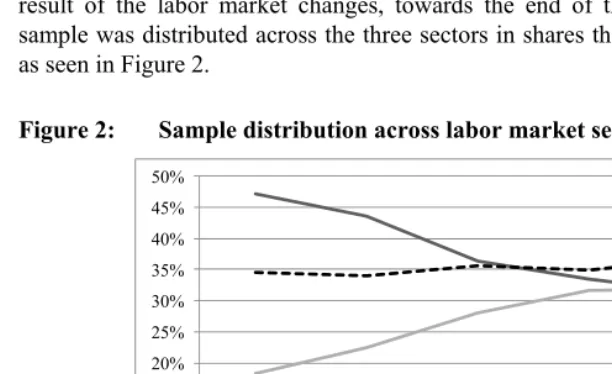
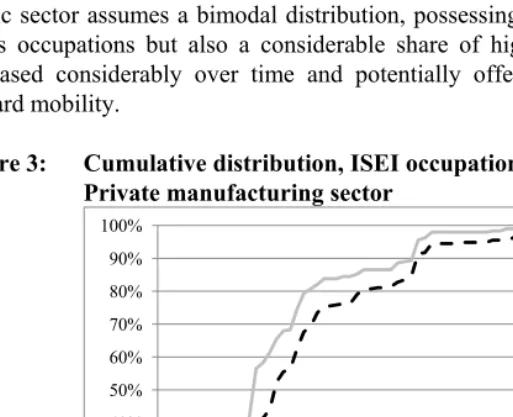
status occupations increased over time. The dramatic changes occurring over time in the public sector indeed appear likely to be associated with changing opportunities for upward mobility, due to the considerable increase in the share of occupations with a status score exceeding 35. In 1970, the distribution of occupations in the public sector closely resembled that of the private manufacturing sector. More specifically, both sectors were characterized by around 50% of individuals employed in occupations with status scores below 30 and only about 10% in occupations with occupational status scores above 50. As the share of high status occupations in the private service sector at the time amounted to about 30%, this sector is confirmed as hosting the largest share of high status occupations in 1970. While the distribution of occupations within the private manufacturing and private service sector in terms of occupational status maintains a rather constant pattern over time, the major changes instead occur in the public sector. Whereas the public sector still is characterized by a rather high share of low status occupations in 1990, its share of occupations with a status score exceeding 50 has increased to about the same magnitude as in the private service sector. Over time the public sector assumes a bimodal distribution, possessing not only a large share of low status occupations but also a considerable share of high status occupations that has increased considerably over time and potentially offers expanded opportunities for upward mobility.
Figure 3: Cumulative distribution, ISEI occupational status. Private manufacturing sector
0% 10% 20% 30% 40% 50% 60% 70% 80% 90% 100%
16 26 36 46 56 66 76 86
1970 1990
Source: Swedish Census of the Population 1970/1990, own calculations.
Figure 4: Cumulative distribution, ISEI occupational status. Public sector
0% 10% 20% 30% 40% 50% 60% 70% 80% 90% 100%
16 26 36 46 56 66 76 86
1970 1990
Source: Swedish Census of the Population 1970/1990, own calculations.
Y-axis: Cumulative distribution (percent), X-axis: ISEI occupational status.
Figure 5: Cumulative distribution, ISEI occupational status. Private service sector
0% 10% 20% 30% 40% 50% 60% 70% 80% 90% 100%
16 26 36 46 56 66 76 86
1970 1990
Source: Swedish Census of the Population 1970/1990, own calculations.
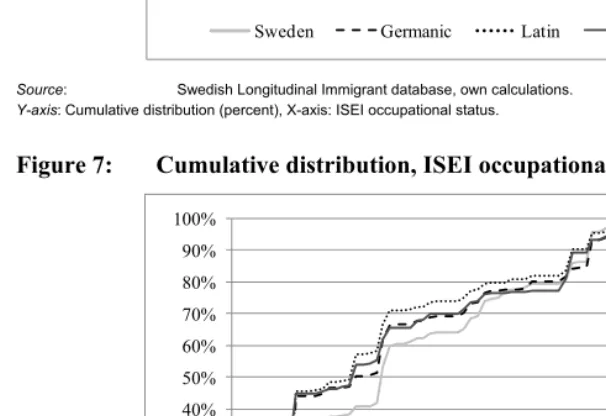
Based on the sample and shown in Figures 6 through 8, within and between sectors, noteworthy distributional differences emerge that are linked to the constructed linguistic groups. Consistently, though, native individuals appear to be occupying the most favorable positions across all sectors. The comparatively high demands for skills in the Swedish language that are believed to exist in occupations in the private service sector may explain the accentuating disadvantage with linguistic difference that is observed. Whereas natives and immigrants with mother tongues that belong to the Germanic language family share virtually the same distribution across occupations in the private service sector, immigrants without prior knowledge of the Latin alphabet are particularly overrepresented in low status occupations such as janitorial work and cleaning. A similar pattern according to linguistic difference is also visible in the public sector, with a disproportionally large share of individuals from the Non-Latin group in low status occupations. However, the linguistic groups’ distributions converge at higher occupational status levels. As a result, the proportion of individuals in public sector occupations that have an occupational status above 40, the score corresponding to work as a school teacher, does not differ greatly between the groups. This suggests a relative absence of obstacles to advancement into occupations at medium and high status levels in the public sector. Lastly, obstacles to mobility into the private manufacturing sector appear to be present for medium level to high status occupations, again showing Latin and Non-Latin immigrants as being worse off than Natives and immigrants who speak a Germanic language. More specifically, the differing distributions suggest that Latin/Non-Latin immigrants are over-represented in machine operation jobs, whereas natives and immigrants who speak a Germanic language occupy a disproportionally large share of managerial positions with status scores around 55.14
Figure 6: Cumulative distribution, ISEI occupational status. Private manufacturing sector
0% 10% 20% 30% 40% 50% 60% 70% 80% 90% 100%
16 26 36 46 56 66 76 86
Sweden Germanic Latin Non-Latin
Source: Swedish Longitudinal Immigrant database, own calculations.
Y-axis: Cumulative distribution (percent), X-axis: ISEI occupational status.
Figure 7: Cumulative distribution, ISEI occupational status. Public sector
0% 10% 20% 30% 40% 50% 60% 70% 80% 90% 100%
16 26 36 46 56 66 76 86
Sweden Germanic Latin Non-Latin
Source: Swedish Longitudinal Immigrant database, own calculations.
Figure 8: Cumulative distribution, ISEI occupational status. Private service sector
0% 10% 20% 30% 40% 50% 60% 70% 80% 90% 100%
16 26 36 46 56 66 76 86
Sweden Germanic Latin Non-Latin
Source: Swedish Longitudinal Immigrant database, own calculations.
Y-axis: Cumulative distribution (percent), X-axis: ISEI occupational status.
Table 2 shows the non-sector specific transition probabilities by origin status categories, suggesting a rapidly decreasing probability of upward mobility as the occupational status increases. Using the native man as a benchmark category, the unadjusted likelihood of upward mobility at status origins below 66 always exceeds 10%, above which it approaches zero. This implies that upward transitions from such status origins are somewhat of an anomaly and that such occupations are largely “final destination” jobs. Non-Latin women display the most clearly diverging pattern, with a very low proportion of those individuals originating with a status in the range of 16-49 experiencing an upward transition; in fact, this figure is consistently about half as large as that for native men.
Table 2: Upward status transitions by ISEI origin occupational status, percent
Sweden Germanic Latin Non-Latin
Origin occupational status male female male female male female male female
16-32 22.88 22.48 19.62 19.26 18.67 18.16 18.3 11.4
33-49 17.12 20.4 16.31 17.34 9.35 12.45 11.59 8.44
50-66 12.7 6.16 11.16 7.2 9.54 6.33 9.75 7.1
67-85 1.8 1.66 1.51 3.3 1.27 2.29 3.59 0
4.2 Estimation of empirical models
Models are run on the pooled sample, that are intended to capture how the sector specific mechanisms of career opportunities differ depending on region-of-origin, sex and formal human capital. Model 1 represents a somewhat naïve depiction of the assumed reality, estimating a common payoff for a given educational level regardless of origin and sex.15 The extended Model 2 is designed to more accurately capture the
theoretical expectation that the payoff of a given skill set may vary depending on the individual characteristics in terms of linguistic background and sex. The models were estimated as multinomial logit models, which possess the unappealing feature that their unadjusted parameter estimates cannot be interpreted based on either the size or the direction of the estimate (Borooah 2000). Therefore, the results section employs an alternative way of interpreting the results.
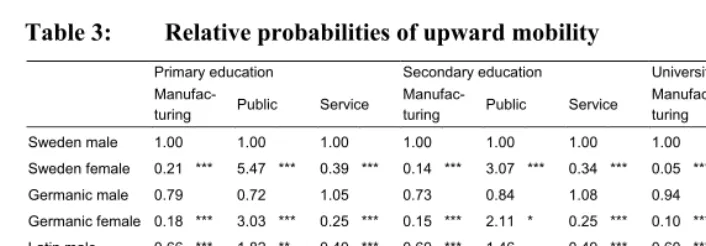
Table 3 shows the sector specific relative probabilities16 of upward mobility
compared to that of a native male with a comparable formal education, using sample means. The degree to which between-group differences in the combined effect of formal education, gender and linguistic distance are statistically significant are determined using Wald tests. Almost consistently, the native male experiences an advantage in terms of upward mobility in the private manufacturing and private service sector. Compared to an otherwise similar native man, an immigrant woman in either of the mentioned sectors and originating from a country with a mother tongue based on an alphabet other than Latin will experience a most considerable disadvantage in terms of her likelihood of upward mobility. Across all educational levels, the relative probabilities suggest that the likelihood of upward mobility for a female with a Non-Latin mother tongue never to exceed a probability being 10 percent that experienced by the native man. Furthermore, the increasing disadvantage according to linguistic distance that can be observed in the private service sector is theoretically appealing because of the assumed comparatively high demands for country specific skills expected in this sector. This explains the linguistic component of the varying payoff to formal human capital. A similar pattern arises in the private manufacturing sector, with an accelerating decrease in the returns to formal skills according to linguistic distance. Again, this finding suggests problems related to skill transferability. The pattern in the mentioned sectors is also consistent in terms of the distinction it makes between men and women, always favoring the former, albeit not always within the boundaries of statistical significance.
Table 3: Relative probabilities of upward mobility
Primary education Secondary education University education
Manufac-turing Public Service
Manufac-turing Public Service
Manufac-turing Public Service Sweden male 1.00 1.00 1.00 1.00 1.00 1.00 1.00 1.00 1.00 Sweden female 0.21 *** 5.47 *** 0.39 *** 0.14 *** 3.07 *** 0.34 *** 0.05 *** 1.74 * 0.15 *** Germanic male 0.79 0.72 1.05 0.73 0.84 1.08 0.94 1.22 1.11 Germanic female 0.18 *** 3.03 *** 0.25 *** 0.15 *** 2.11 * 0.25 *** 0.10 *** 1.49 0.13 *** Latin male 0.66 *** 1.82 ** 0.40 *** 0.60 *** 1.46 0.49 *** 0.60 *** 1.46 0.66 *** Latin female 0.20 *** 2.61 *** 0.14 *** 0.13 *** 2.08 ** 0.18 *** 0.06 *** 1.56 0.12 *** Non-Latin male 0.09 *** 0.11 *** 0.08 *** 0.12 *** 0.23 *** 0.16 *** 0.13 *** 0.18 *** 0.19 *** Non-Latin female 0.08 *** 0.30 *** 0.03 *** 0.04 *** 0.28 *** 0.05 *** 0.05 *** 0.21 *** 0.06 ***
Notes: Relative probabilities calculated at sample means, showing the effect of a 1 unit change in the independent variable. Reference category is Swedish male with primary/secondary/university education. Figures are calculated using the estimates of Model 2, which simultaneously controls for age, civil status, children, years since migration, regional labor market
characteristics, time period, origin occupational status, Swedish citizenship and Nordic/Non-Nordic immigrant. Statistical significance refers to Wald test comparing estimate to that of the Swedish male at a given level of education. *** p<0.01, ** p<0.05, * p<0.1
The landscape indicated in the public sector differs quite substantially from those in the private manufacturing and private service sectors. Firstly, the gender pattern is reversed, suggesting that women on average are more likely to experience upward mobility than a man of a the same language background. This tendency is particularly pronounced at lower educational levels, however, where probabilities of upward mobility are consistently low. Despite the advantages observed, which are sometimes quite considerable, their real implications in terms of the differences between the groups’ prospects for upward mobility should therefore not be exaggerated at the lowest educational level. With this in mind, although a Swedish females’ likelihood of upward mobility in the public sector is roughly 5.5 times that of the Swedish male, the actual probabilities in question only amount to 2.7% and 0.5%, respectively. Another striking finding is that the favorable situation observed in this sector appears to apply to all groups apart from Non-Latin immigrants. While not as evident as in the manufacturing and service sector, this group again emerges as disadvantaged.
4.3 Interpreting the models using predicted probabilities
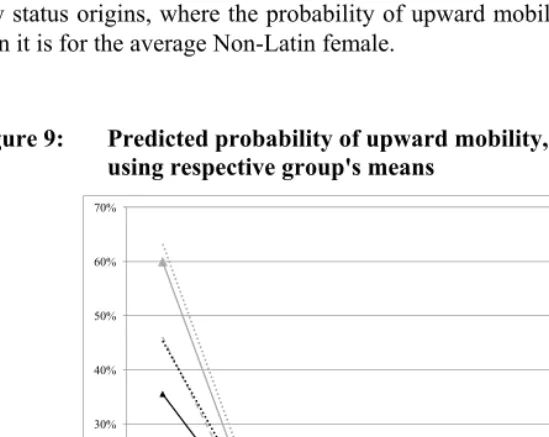
differences in the prerequisites for upward mobility across labor market sectors were observed, linked to mentioned individual characteristics. This procedure, however, neglects the potential existence of differing opportunity structures across the labor market sectors. Attention is now therefore directed toward predicting the probability of upward mobility using the groups’ respective characteristics and thereby generating a more accurate illustration of the differences in transition probabilities. Figure 9 shows findings that correspond quite well to indications already obtained from the relative probabilities presented in Table 3. Ignoring differences between the sectors and looking at the labor market as a whole by adding together the sector specific probabilities for upward mobility, linguistic distance is suggested as being more important than sex in determining labor market outcomes. The expectation that native men experience overall favorable opportunities is confirmed, and this pattern is seemingly most accentuated at low status origins, where the probability of upward mobility is about six times greater than it is for the average Non-Latin female.
Figure 9: Predicted probability of upward mobility, using respective group's means
0% 10% 20% 30% 40% 50% 60% 70%
16 25 35 45 55 65 75 85
Non-Latin female Non-Latin male Latin female Latin male
Another observation that emerges from the figure is that all probabilities approach zero at origin occupational status scores of 65 and above, evidence that occupations at such status levels to a large extent are “final destination” occupations. This does not, have any implications for the degree of mobility into such occupations; it only reflects the degree of mobility out of them.
As for the question of whether a glass ceiling exists, the low probability of upward mobility for individuals at high status origins has implications for the usefulness of comparing predicted probabilities. In the situation where the native man enjoys a probability of upward mobility being twice as large as that of another group, such probability differences only appear meaningful if they translate into any tangible differences in terms of real labor market opportunities. For instance, a probability of upward mobility of 0.2%, while twice as large as a probability of 0.1%, could be argued to represent an advantage with no real life implications. To keep such nonsense probabilities from potentially distorting the subsequent analysis, the predicted probabilities will only be compared if the highest probability from a given origin exceeds an arbitrarily chosen threshold probability of two percent.
Whereas the results observable in Figure 9 show that individuals experience widely differing opportunities for career progress that are strongly associated with both sex and region-of-origin, the extent to which the disadvantage is due to a lower payoff to a given set of skills rather than resulting from possessing a less suitable set of characteristics cannot be determined. The following section therefore removes the influence of differences in the endowment of labor market relevant characteristics.
To observe differences in sector-specific probabilities that are due to differences in the returns to a consistent and theoretically relevant skill set, the average characteristics of the native man are used. Should an immigrant experience a lower probability of upward mobility when predicted using the characteristics for native men and immigrant and/or female parameter estimates, it will indicate that the group in question does indeed experience a less beneficial payoff to a consistent set of characteristics. The figures in which the results are presented are intended to mirror an orthodox interpretation of the glass ceiling. Therefore, the superior likelihood of upward mobility experienced by the native man is visualized as a difference in log probabilities greater than zero. Furthermore, consistent with the notion of an increasing advantage at higher status origins, such a dynamic should be reflected in a positively sloping curve. Lastly, sector specific probabilities are calculated to properly address whether career opportunities differ depending on the sector into which the transition of status occurs.17
4.3.1 Private manufacturing sector
As already observed in the descriptive section, the region-of-origin groups’ distribution in occupations with status scores below 30 in the manufacturing sector differed only to a negligible extent. However, a pattern of divergence among more advanced positions suggests the potential existence of different promotion mechanisms into occupations belonging to the upper segment of the sector’s occupational status hierarchy according to linguistic distance. More specifically, the obstacles place the Latin and Non-Latin immigrants at a disadvantage. According to the estimates of Model 2, predicted at the native male means, evidence of an accelerating disadvantage in the probability of upward mobility as the individual moves up the status hierarchy indeed exists for the Non-Latin immigrant group. This is demonstrated in Figures 10-12, which show the difference between the log-probability of upward mobility for the native man and all seven comparison groups.
and 8.7%, respectively. This is to be compared to the predicted probabilities of Non-Latin immigrant men and women amounting to 1.9% and 0.8%, respectively.
Another striking pattern contributing to the advantage of native males is observed along gender lines, where women consistently experience a lower probability of upward mobility than both native men and men belonging to the same linguistic group. This pattern of disadvantage also clearly increases with educational level, which generally can be assumed to be a formal prerequisite for achieving the highest level status positions. Thereby, these are suggested as particularly disadvantaged when it comes to their opportunities to experience a transition into a high-status occupation in the private manufacturing sector. Particularly accentuated among the university educated, the disadvantage for women constantly remains greater than a difference of 0.5 log-probability units, implying the log-probability for a native man is consistently at least 65% higher than that of a woman.18
Figure 10: Log differences in probability of upward mobility for individuals with primary education. Private manufacturing sector
-3 -2 -1 0 1 2 3
16 25 35 45 55
L
og prob
ab
ili
ty
di
ff
eren
ce
Origin occupational status
Non-Latin female Non-Latin male Latin female
Latin male Gemanic female Germanic male
Swedish female
Figure 11: Log differences in probability of upward mobility for individuals with secondary education. Private manufacturing sector
-3 -2 -1 0 1 2 3
16 25 35 45 55
L
og
pr
obabi
lit
y
di
ff
er
enc
e
Origin occupational status
Non-Latin female Non-Latin male Latin female
Latin male Gemanic female Germanic male
Swedish female
Figure 12: Log differences in probability of upward mobility for individuals with university education. Private manufacturing sector
-3 -2 -1 0 1 2 3
16 25 35 45 55
L
og
p
ro
b
ab
ili
ty
d
if
ference
Origin occupational status
Non-Latin female Non-Latin male Latin female
Latin male Gemanic female Germanic male
Differences in the log probability are calculated up to and including a status origin of 55, motivated by the consistently very low probability of upward mobility observed past this level of occupational status. On this basis, if one wishes to draw any conclusions regarding the existence of a glass ceiling up to and including occupations with status scores of 85, one must recognize that the figures converge for origin status levels above 65. Looking only at the above-displayed figures, we can conclude that no group strictly demonstrates the specific required characteristics of a group struggling against a glass ceiling. Instead, the main finding for the sector is that women experience a general disadvantage that appears to be rather constant across status origins but that also seems to increase with educational level.
4.3.2 Public sector
The public sector was argued to potentially be characterized by a relative absence of obstacles to upward mobility that would otherwise result from immigrants not possessing similar access to networks with valuable labor market information. More specifically, linked to a recruitment process which relies more on formal channels, immigrants should to a considerably lesser extent be excluded from positions within the public sector, and thereby from improving their opportunities for upward mobility. Indeed, compared to the situation in the previously discussed private manufacturing sector, the native man experiences a considerably less advantageous position in the public sector.
Again, log-probability differences are calculated for the origin status range 16-55, and the general findings presented in Figure 13-15 indicate a distinctly different situation than previously observed in the private manufacturing sector. The main difference is that women no longer are consistently disadvantaged categories. Instead, with the exception of Non-Latin women, females typically experience an advantage over both men of the same origin and native men. Given identical observable characteristics as the native male, the female advantage is largest for women at low-status origins. This suggests that the public sector is a good candidate destination for status transitions into occupations in the middle of the status hierarchy among women.19
In fact, originating from the lowest status origin, a female with a primary education belonging to the Latin group experiences a probability of upward mobility amounting to almost 8%, compared to a probability of 2% for the native male. Indicative of the immigrant’s process of socioeconomic assimilation, the inflated probabilities of upward
mobility from low status occupations in particular could be evidence of such upward status adjustments as most likely to occur into occupations belonging to the public sector. Among the aforementioned Latin women, predicted at the secondary and university educated individuals’ parameter estimates, probabilities of upward mobility from the lowest occupational status origin amounts to 22% and 62%, respectively.
From status origins exceeding a score of 25, the groups’ probabilities of upward mobility into an occupation belonging to the public sector converge. The pattern of convergence as regards the predicted probabilities at high status origins suggests that the general female advantage primarily exists at low status origins. While the probabilities of upward mobility typically become more alike at high status origins, the consistent female disadvantage that is observed in the private manufacturing sector clearly does not exist in the public sector.
Figure 13: Log differences in probability of upward mobility for individuals with primary education. Public sector
-3 -2 -1 0 1 2 3
16 25 35 45 55
L
og prob
ab
ili
ty
di
ff
eren
ce
Origin occupational status
Non-Latin female Non-Latin male Latin female
Latin male Gemanic female Germanic male
Figure 14: Log differences in probability of upward mobility for individuals with secondary education. Public sector
-3 -2 -1 0 1 2 3
16 25 35 45 55
L
og p
rob
abi
lit
y
di
ff
erence
Origin occupational status
Non-Latin female Non-Latin male Latin female
Latin male Gemanic female Germanic male
Swedish female
Figure 15: Log differences in probability of upward mobility for individuals with university education. Public sector
-3 -2 -1 0 1 2 3
16 25 35 45 55
L
og
pr
obabi
lit
y
di
ff
er
enc
e
Origin occupational status
Non-Latin female Non-Latin male Latin female
Latin male Gemanic female Germanic male
An exception to the favorable pattern observed for women emerges among the Non-Latin group, who, together with men of similar linguistic origin, experience a consistent disadvantage compared to native men. Although this disadvantage is less severe than the situation experienced in the manufacturing sector, it suggests that problems of human capital transfer are an obstacle to obtaining upward mobility in the public sector as well. Recalling the large share of immigrants belonging to the Non-Latin and the Non-Latin group that are working in low status occupations, a relatively high degree of upward mobility could be expected as these individual undergo a process of socioeconomic assimilation. However, whereas the average university educated Latin female working in an occupation with a status of 35 experiences a predicted probability of upward mobility amounting to 19%, the corresponding figure for the Non-Latin female is only 8%. Comparing the situation observed in the public sector to what would be expected in the presence of a glass ceiling, the lack of a consistent and increasing native male advantage, makes it easy to reject any such hypothesis.
4.3.3 Private service sector
The prerequisites for upward mobility into occupations belonging to the private service sector were theoretically assumed to be the most likely to follow a pattern of linguistic distance-determined disadvantage. More specifically, this would result from the comparatively high demands on country specific skills that characterize jobs within the sector. Furthermore, due to employers to a large extent relying on informal recruitment methods, immigrants in general could be disadvantaged.
Figure 16: Log differences in probability of upward mobility for individuals with primary education. Private service sector
-3 -2 -1 0 1 2 3
16 25 35 45 55
L
og
p
ro
b
ab
ili
ty
d
if
ference
Origin occupational status
Non-Latin female Non-Latin male Latin female
Latin male Gemanic female Germanic male
Swedish female
Figure 17: Log differences in probability of upward mobility for individuals with secondary education. Private service sector
-3 -2 -1 0 1 2 3
16 25 35 45 55
L
og pr
obabi
lit
y
di
ff
ere
nc
e
Origin occupational status
Non-Latin female Non-Latin male Latin female
Latin male Gemanic female Germanic male
Figure 18: Log differences in probability of upward mobility for individuals with university education. Private service sector
-3 -2 -1 0 1 2 3
16 25 35 45 55
L
og pro
b
ab
ili
ty
di
ff
erence
Origin occupational status
Non-Latin female Non-Latin male Latin female
Latin male Gemanic female Germanic male
Swedish female
From a status origin of 16, the native male enjoys a predicted probability of upward mobility into the private service sector amounting to 21%, to be compared with 4% and 1% for the Latin and Non-Latin female, respectively. The disadvantage increases with linguistic distance, why the pattern in the private service sectors corresponds to the à priori expectations. Again, however, the disadvantage neither increases at high status origins, nor with an increasing level of formal education. Instead, the disadvantage enjoyed by any given comparison group is rather consistent across status origins, while holding educational level constant. The native male advantage is of course far from negligible, particularly at more advanced levels of formal qualifications. According to the results, from an occupational status origin of 45, the university educated native male enjoys a predicted probability of 16%, compared to 9% and 7% for the Latin and Non-Latin male.
hey are net of the influence of any compositional differences between the grou
cted. Similar to the other sectors, the notio of a glass ceiling must also be rejected.
4.4 Sensitivity analyses
ameter across model specifications can be o
o be statistically significant remain so regardless of how the model is spec
women, illustrating a gender pattern among university educated individuals in the private service sector. Furthermore, as the predictions are calculated at native man means, t
ps.
The à priori theoretical expectation suggested that the problems involved in the transferability of formal human capital are positively related to linguistic distance and increasing with the individual’s level of formal education. Whereas the findings show that an increasing linguistic distance is associated with fewer opportunities for upward mobility into occupations in the private service sector, the expectation that such obstacles increase with education must be reje
n
In order to investigate the robustness of the presented results, comparison models were estimated. Table A3 presents marginal effects estimated at sample means and thus indicates the change in the probability of upward mobility in respective labor market sector resulting from a one unit increase in a given independent variable. Therefore, the consistency of the estimated effect of a given par
btained by comparing its direction and size.
In the main model specification of the paper, an upward transition was defined as a status change of five ISEI status points or more, a definition which essentially was not guided by theory as much as by previous research. Model 3 instead defines an upward transition as occurring when the individual changes to an occupation with an ISEI status score that is no less than 10 points higher. Consequently, the model excludes individuals in occupations with status scores above 80, due to their inability to experience an upward transition. Comparing the estimates of Model 3 with Model 2, while the size of the marginal effects typically become somewhat different as a result of the different model specifications, the direction of the effects remain largely consistent. More specifically, as regards the influence of formal education, all estimates that were statistically significant according to Model 2 maintain the same direction in the alternative specification, labeled Model 3. Hence, it would appear that the parameters, according to the preferred specification of the paper, are estimated with sufficient precision t
ified.
ared to Model 2 strongly suggests the results as unaffected by such a sampling choice.
5. Conclusions
man advantage theoretically is belie
ly does not comply with a theo
included have entered the labor market properly. More specifically, the intention is to exclude upward transitions enjoyed by individuals who may be working part time in an occupation requiring fewer skills during their studies, only to thereafter experience a substantial upward transition to an appropriate position subsequent to the studies. The similarity of the marginal effects as comp
An empirical observation from contemporary western societies is an overrepresentation of immigrants in disadvantaged positions in the labor market. The time period examined in this paper represents a time period when this disadvantage was emerging, along with a dramatically changing labor market structure. The glass ceiling therefore represents a theoretically appealing concept in describing immigrants’ exclusion from the socioeconomically most desirable positions in the labor market. In this paper, this has been examined in terms of differences in the probability of experiencing upward mobility into higher status occupations, where the native
ved to increase at high occupational status origins.
Using a sample of about 70,000 natives and immigrants in Sweden, the contributions of this paper is that it delves deeper into how the labor market sector-specific opportunities for upward mobility vary depending on individuals’ linguistic distance to Sweden, formal education and sex. By doing so, the paper not only examines a previously unstudied research question as regards Sweden, but it also provides further precision into differences in the career opportunities of natives and immigrants. Furthermore, by comparing how opportunities for upward occupational mobility differ across labor market sectors, the paper provides empirical evidence regarding the existence of differing sector specific demand mechanisms. While immigrants to a varying extent are observed to be disadvantaged in all three labor market sectors examined, the overall pattern clear
retically orthodox representation of a glass ceiling.