Simulation of a New Hybrid Solar and Organic Cycle as a
Combined Cooling, Heat and Power (CCHP) Unit in Off Design
Condition
Mohammad Ameri*
,
Hamid Mokhtari1Mechanical and Energy Engineering Department, Shahid Beheshti University, Tehran, Iran
Received: 6 January 2017 /Accepted: 27 March 2016 Abstract
In this paper, using parabolic mirrors, a solar field was designed, which was related to a storage tank for a residential complex in the city of Tafresh located in the center of Iran. The design was performed for the existing oils: VP1, THERMINOL 66, THERMINOL 59. Finally, considering an organic cycle with R123 as working fluid and assuming a minimum length required for oil flow rate to reach a specified temperature, VP1 was selected both as working fluid and for the storage system. Position of single-effect absorption chiller in the outlet of the organic turbine in hot seasons for cooling and also using a condenser in cold seasons due to the lack of need for cooling provide the possibility of selecting two different working pressures in the cycle, which leads to increased storage in winter. The overall performance of solar cycle was calculated with variable electrical demand load of 63%. In off-design condition, on the longest day of the year, the considered cycle was shown to be able to uninterruptedly generate power, cooling, and heating for 20 h for hygienic purposes. Also, it could generate power and heating for 10 h and 50 min on average on the shortest day of the year.
Keywords: CCHP, Solar, organic cycle, Storage, off-design
Introduction
Mathematical modeling of solar parabolic collectors has been performed by many researchers (e.g. Tao and He, 2010; Kothdewila et al., 1995). One dimensional energy balance model developed by Tao and He (2010), was adapted here. For short receivers (<100m) a one-dimensional energy balance gives reasonable results; for longer receivers a two one-dimensional energy balance becomes necessary. The model determines the performance of a parabolic trough solar collector’s linear receiver, also called a heat collector element (HCE). Inputs of the model include collector and HCE geometry, optical properties, heat transfer fluid (HTF) temperature. Outputs include collector efficiency, outlet HTF temperature, heat gain, and heat and optical losses. Modeling assumptions and limitations are also discussed, along with recommendations for model improvement. Karellas and Braimakis (2016) studied the thermodynamics and economics of a micro turbine which generated cooling, heating and electricity. The output heat was used to produce the required energy for an organic Rankine
cycle. This system was applied for an apartment building as a case study. The internal rate of return and pay back period for this system were estimated to be 12% and 7 years respectively. Yağlıa et al. (2016) investigated an organic Rankine cycle in critical and supercritical conditions for heat recovery from a biogas system. The CHP system was located in Belgium and R245fa was selected as the working fluid. The results revealed that the critical cycle had a better performance than the supercritical one. The thermal and exergy efficiencies were calculated to be 79.2% and 15.51% respectively.
Freeman et al. (2016) studied the electricity and heat generation from a hybrid system of solar and organic cycles. The system consisted of a solar and an auxiliary M2.15 motor which was optimized for the Britain climatic conditions. The results showed that the efficiency for the conversion of the solar energy to electricity by PV was 6.3%. The thermal efficiency for the organic cycle with the 126 o C saturated temperature was 32%.
Ungureşan et al. (2016) presented a mathematical model to assess the application of a cogeneration system which consisted of a PV and organic cycle for the Romania input data. They showed that the system could provide the demand without the application of any auxiliary system.
Ameri and Jorjani (2016) Mokhtari et al. (2016) studied the thermo-economic as well as modeling of the heat recovery from a gas turbine combined with ORC and a multi-effect desalination (MED) plant. The system was optimized by maximizing the water production and minimizing the cost rate simultaneously. Mokhtari et al. (2016) investigated the organic Rankine cycle application for the energy recovery from a gas turbine to generate electricity and water from a hybrid system consisted of a solar parabolic receiver and a reverse osmosis desalination plant.
Solar
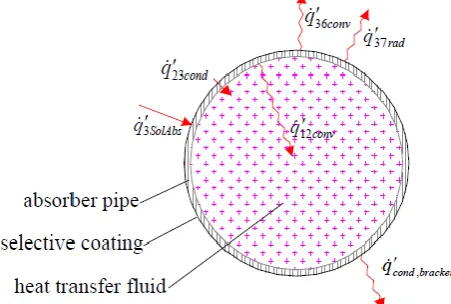
Figure 1 shows the one-dimensional steady-state energy balance for a cross-section of an HCE, without the glass envelope intact. The optical losses are due to imperfections in the collector mirrors, tracking errors, shading, and mirror and HCE cleanliness.
The effective incoming solar energy (solar energy minus optical losses) is absorbed by the absorber selective coatingq3SolAbs. Some energy that is absorbed into the selective coating is conducted through the absorber (q23 cond) and transferred to the HTF by convection (q12conv); remaining energy is transmitted back to (is lost) to the environment by convection (q36 conv) and radiation (q37 rad) and through the HCE support bracket through conduction (qcond ,bracket). The model assumes all temperatures, heat fluxes, and thermodynamic properties are uniform around the circumference of the HCE. Also, all flux directions shown in Figure 1 are positive.
( 1 )
cond
conv q
q12 23
( 2 ) bracket cond cond rad conv
SolAbs q q q q
q3 36 37 23 ,
( 3 ) bracket cond rad conv
HeatLoss q q q
q 36 37 ,
From Newton’s law of cooling, the convection heat transfer from the inside surface of the absorber pipe to the HTF is:
( 4 )
2 1
1
12 h D T T
qconv HTF
( 5 ) D k Nu hHTF D
2 1 2
To model the convective heat transfer from the absorber to the HTF for turbulent and transitional cases (Reynolds number > 2300) the following Nusselt number correlation developed by Gnielinski (1976) is used:
( 6 )
11 . 0 2 1 3 / 2 1 1 2 Pr Pr 1 Pr 8 12.7 1 Pr 1000 Re 8 f f NuD ( 7 )
22
10 Re 1.64
log 82 .
1
D
f
In which f is the friction factor for the inner surface of the absorber pipe and Pr1 and Pr2 are Prandtl number evaluated at the HTF temperature, T1, and the inner surface temperature, T2 respectively.
Fourier’s law of conduction through a hollow cylinder describes the conduction heat transfer through the absorber wall (Incropera and DeWitt, 1990):
( 8 )
2 1
1 2
23 2 k T T /ln D /D
q cond
The conduction coefficient depends on the absorber material type. In this research, the HCE performance model includes three stainless steels: 304L, 316L, and 321H, and one copper.
If there is a wind, the convection heat transfer from the glass envelope to the environment will be forced convection. The Nusselt number in this case is estimated with Zhukauskas’ correlation for external forced convection flow normal to an isothermal cylinder (Incropera and DeWitt, 1990):
(9) 1 4
3 3 4
3 Pr 4 Re Pr Pr m n D D
Nu C
The net radiation transfer between the absorber pipe and sky becomes (Incropera and DeWitt, 1990):
( 10 )
sur
sur
rad AF J J
q37 1 1
( 11 )
1
1 1
1
1 b
J E q
D ( 12 ) 4 sur Sky
J T
( 13 ) 360
sur
In which σ is the Stefan-Boltzmann constant, ε is the emissivity of the pipe outer surface, D is the pipe outside diameter and θ is the collector angle with the sky. Sky temperature Tsky, is calculated using Malica et al. (2013) correlation.
Other terms in equations 1 to 3 can be calculated using models and equations of other references (e.g. Dudley et al., 1994; Touloukian and DeWitt, 1972) and is not mentioned here to prevent elongation of the paper.
ORC cycle
The isentropic efficiency of the pump, turbine efficiency and thermal retention co-efficient are considered to be 80%, 75% and 0.9%, respectively.
- Mass balance equation:
mi mo(14) Using the first and second thermodynamic laws computed production/consumption power and repulsion absorption heat in energy component of the cycle, the applied energy balance Eq(15) is:
(15) Where subscripts i and o refer to streams entering and leaving the control volume, respectively.
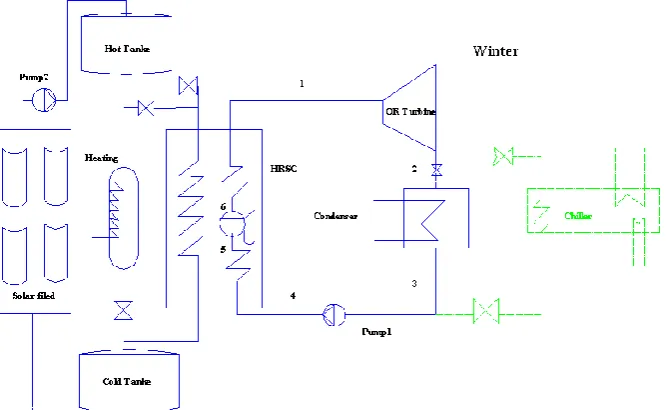
The energy balance equations for the various parts of the turbine cycle as shown in Fig. 2 and 3 are as follow:
-Evaporator:
) ( o i i
evap m h h
Q
(16) -Turbine: s o i a o i s T a T T h h h h W W , , , ,
(17)
i i o o
a
T mh m h
W ,
(18)
-Condenser:
i i o o
con mh m h
Q (19)
The pressure drop in condenser/evaporator is assumed to be pand as a result:
) 1 (
/p p
po i (20)
-Pump: i o i o i a p s p p h h P P W W ( ) , , (21)
o i W E QScenario definition
Considering the conditions of the region, a solar field with parabolic mirrors was used which had a bracket without any coverage (it will be more explained in modeling solar field). Also, owing to high thermal capacity of the existing oils, they can be used for storage. Their low freezing point also leads to the possibility of more reduction in temperature, which was -4°C for VP1 in this paper. The heat exchangers was designed with the pinch and approach temperatures of 65 and 5°C, respectively, and had a super-heater, which was due to using organic fluid in the chiller in summer (Fig. 2). In cold seasons during which no cooling is needed, a condenser with lower pressure is used to be able to generate power at lower flow rate of oil and spend more share of the generated flow rate in the field for storage (Fig. 3). Moreover, designing the solar field at the end of July was selected due to increased performance factor of the field.
Figure 2. Schematic of the organic cycle combined with solar field in hot seasons in the absence of condenser
Case study
The project was established using a small-scale power plant working as a combined heat and power generation (CHP). The construction site was located in a land in the vicinity of a 16-unit residential complex with the area of 70 and 80 m in 8 stories (2 units per floor). This complex was inside Professors Town of TafreshUniversity, at the entrance to city of Tafresh located in Markazi province, Iran. Geogrophical conditions and design parameters of the solar field are as shown in Table 1.
Table 1. Environmental conditions and design parameters
Value Unit
Constant Parameter
31.1
Latitude of Tafresh
92 Day
Number of freezing days
1980 m
Height from sea level
40 %
Humidity of the environment
15
C
Mean temperature of the environment
926 W/m2
Intensity of sun radiation (end of July)
0.935 %
Efficiency of cleanliness of mirrors
0.925 %
Reflection efficiency
65 mm
Internal diameter of pipes of solar field
75 mm
External diameter of pipes of solar field
steel 321H -
Material of pipes of solar field
5.76 m
Collector width
135
Angle of collectors with the sky
Calculating electrical load
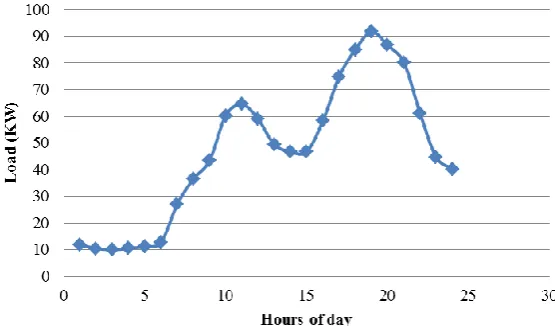
Profile of consumed power considering home appliances and their function time per day at the end of June was calculated as demonstrated in Fig. 4.
Figure 4. Profile of electrical load of the residential complex
This point should be also mentioned that the load was calculated on one of the days of June which had maximum consumed load during the year. For determining total consumption demand and field size, maximum consumption or peak load is required. This curve was calculated based on the cooperation coefficients of home consumers.
Calculating thermal load
1. Heat required for providing hot water needed for the heating system 2. Heat required for providing hot water needed for hygienic purposes 3. Heat required for providing hot water needed for cooling
The point is that hot water need of apartments is divided into three parts: 1. 90°C hot water needed for heating for 6 months of the year
2. 60-90°C hot fluid required for cooling for 4 months of the year 3. 60°C hot water needed for hygienic consumption for the entire year
The value of thermal load for the considered cold region can be observed in Table 2. Table 2.Value of cooling and heating thermal load for separate needs in the case study
Parameter Value
Heat required for providing hot water in hygienic consumptions (Q1) 103
Heat needed for providing hot water for heating system (Q2) 193
Hear required for providing hot water in cooling consumptions 228
Solar collector validation
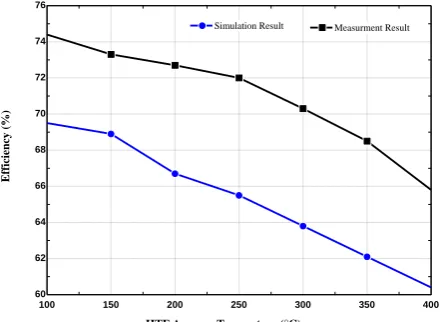
Validation of developed code has been proved by comparison of the obtained results with the reported data of Dudley et al. (1994) as showed in Figure 6. In this figure thermal efficiency of the collector as a function of HTF average temperature has been compared with measured data and a maximum of 5% discrepancy has been investigated. The model well predicted the collector behavior i.e. by increasing HTF temperature, heat losses will increase which in turn leads to decreasing the collector thermal efficiency (Fig. 5).
Figure 5. Effect of HTF average temperature on collector efficiency in compaction with measured data of Dudley et al. (1994)
Results
Solar field simulation results
To reach proper accuracy, total pipe length is divided to 4000 small distances. As the first comparison criteria, we considered different maximum temperature limits for different oils.therefore different pipe lengths have been considered for different oils as shown in table 4. Pipe pressure drop versus pipe segment has been shown in figure 6. From the beginning of the pipe up to 1000 segments, oil density and viscosity are decreased because of temperature rise and therefore, pressure drop is decreased. Since the mass flow rate is constant, after about 4500 segments, decreasing the density leads to increasing volume flow rate and HTF velocity. This
100 150 200 250 300 350 400
60 62 64 66 68 70 72 74 76
HTF Average Temprature (°C)
E
ff
ic
ie
n
cy
(
%
)
Measurment Result Measurment Result Simulation Result
effect overcomes the viscosity effect and leads to increasing the pressure drop. It is important to note that THERMINOL 66 has the minimum pressure drop among the different oils. Considering both pipe length and pressure drop, from data of table 3, it can be concluded that pumping power is minimum for THERMINOL 59 while THERMINOL VP1has the maximum outlet temperature, maximum pipe length (maximum pipe cost) and the maximum pumping power (maximum pump cost). On the other hand, this oil can produce more live organic which in turn causes to produce more power.
Figure 6. Pressure drop vs. pipe segments for different thermal oils
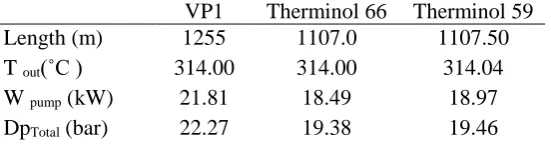
As the second comparison criteria, outlet temperature was considered to be 314°C for all oils which corresponds to the maximum acceptable temperature of VP 59. With this assumption, simulation results have been summarized in table 4. In this case, THERMINOL 66 has the minimum pipe length and the minimum pumping power.
Table 3. Comparison of solar field parameters for different thermal oils considering maximum temperature limit for different oils
VP1 Therminol 66 Therminol 59 Length (m) 2455.50 1381.00 1107.50 T out(˚C ) 399.02 344.04 314.04
W pump (kW) 45.60 23.15 18.97
DpTotal (bar) 46.55 24.27 19.46
Table 4. Comparison of solar field parameters for different thermal oils considering outlet temperature of 315°C for all the oils
VP1 Therminol 66 Therminol 59
Length (m) 1255 1107.0 1107.50
T out(˚C ) 314.00 314.00 314.04
W pump (kW) 21.81 18.49 18.97
DpTotal (bar) 22.27 19.38 19.46
At the pipe inlet section, the surface temperature is low; therefore the convective heat loss is more important than the radiation heat loss. While at pipe outlet section, the surface temperature is higher, and therefore the radiative heat loss becomes dominant. It can be verified from Figure 7 that from the pipe inlet to the pipe outlet segments, inside convective heat transfer coefficient increases, therefore pipe surface temperature will be closer to the HTF higher temperature.
0 1000 2000 3000 4000
0.00875 0.009 0.00925 0.0095 0.00975 0.01 0.01025 0.0105
Part of length
P
er
ss
u
re
d
ro
p
(
b
a
r)
VP1 VP1
VP 66 VP 66
Figure 7. Inside heat transfer coefficient vs. pipe segment for different thermal oils
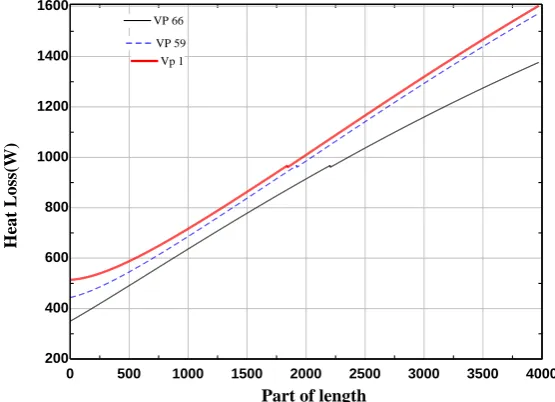
Sum of heat losses during pipe segments is shown in Figure 8 for different oils. THERMINOL VP1 has the maximum heat loss rather than the others.
Figure 8. Total heat loss vs. pipe segments for different thermal oils
Since we are going to gain maximum solar energy, it is a good idea to use the oil with maximum temperature limit that is THERMINOL VP1. Although it involves the greatest heat losses and the maximum pumping power among the others, but its performance to produce higher power is more attractive technically and economically. Therefore we have selected this oil for the rest of calculations.
Consequently, according to the conducted analysis in the solar field, THERMINO VP1 oil was selected as the working fluid of the field. This fluid was also applied in the storage system owing to its high thermal capacity.
CCHP results
Considering the limitation applied by the inlet temperature into the chiller generator for preventing the crystallization of lithium bromide, organic cycle has to select higher pressure of 420 kPa; in cold seasons and lack of need for cooling, the chiller is taken out of the circuit and,
0 500 1000 1500 2000 2500 3000 3500 4000 450
900 1350 1800 2250 2700
Part of lenght
hi (
W
/m
2.°
C
) b
VP 1 VP 1 VP 66 VP 66 VP 59 VP 59
0 500 1000 1500 2000 2500 3000 3500 4000
200 400 600 800 1000 1200 1400 1600
Part of length
H
ea
t
L
o
ss
(W
)
considering the type of design, pressure of 120 kPa can be utilized for its exploitation, which is accompanied by increased power of turbine. In summer, since the absorption chiller is in the circuit, the outlet temperature from the turbine is considered to be 60°C. Nevertheless, this temperature is reduced to 35°C in winter to increase storage and generate electrical demand with less mass flow rate of organic fluid.
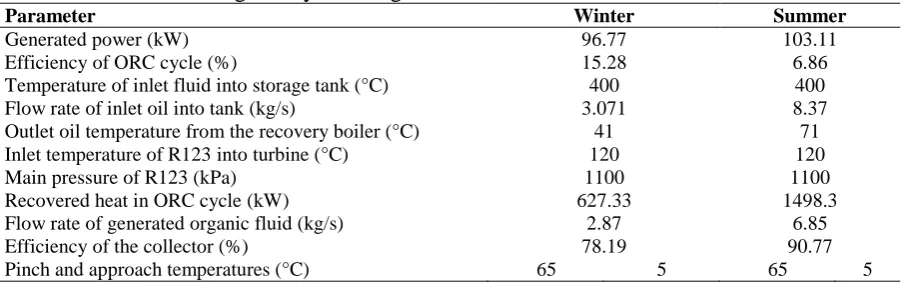
In Table 5, a comparison is made in terms of cycle parameters and heat recovery boiler on the important days of the year. In this investigation, considering the curve of the generated load, almost the same amount of generation was made in cold and hot seasons and this consumption was reduced in cold seasons by itself. As a result, power generation also decreased. Considering the equal pinch and approach temperature for heat recovery boiler of ORC cycle, it can be observed that, with increased oil mass flow rate, the produced mass flow rate of organic fluid increased, which led to more thermal gain from the exchanger. Considering constant length determined in design mode, flow rate of oil at 400°C in cold seasons was much less than that in hot seasons, which led to reduced efficiency of collectors. Based on less energy gain compared to summer and also reduced ambient temperature, oil with less mass flow rate was generated which finally decreased collector efficiency.
Table 5.Parameters of organic cycle along with solar field
Parameter Winter Summer
Generated power (kW) 96.77 103.11
Efficiency of ORC cycle (%) 15.28 6.86
Temperature of inlet fluid into storage tank (°C) 400 400
Flow rate of inlet oil into tank (kg/s) 3.071 8.37
Outlet oil temperature from the recovery boiler (°C) 41 71
Inlet temperature of R123 into turbine (°C) 120 120
Main pressure of R123 (kPa) 1100 1100
Recovered heat in ORC cycle (kW) 627.33 1498.3
Flow rate of generated organic fluid (kg/s) 2.87 6.85
Efficiency of the collector (%) 78.19 90.77
Pinch and approach temperatures (°C) 65 5 65 5
In Table 6, the hour of generated power, cooling, and heating can be observed as an example for two important days of the year. Considering the design, in summer, cooling and power of the residential complex can be supplied in total for 20 h and 42 min. This value was equal to 20 h and 40 min in terms of supplying hot water for hygienic consumption. In sum, the considered cycle had capacity factor of 90% on that day, which was equal to 45% for winter (January). At the beginning of winter, considering the generated power and condenser pressure led to storage improvement on that day. The undertaken measures caused application of the generated power of this cycle for 10 h and 54 min on the shortest day of the year.
In this modeling, mean weather conditions of the month were also considered for more precise calculation of heat loss.
Table 6. Generation hours of power, cooling, and heating in a direct way and along with storage system
Generated power Cooling period Q1 Q2 COP Tamb
Directly (h)
With storage
(h)
Directly (h)
With storage
(h)
Heating period (h)
Heating
period (h) (-)
Mean (°C) Beginning
of summer 9:06 11:36 9:06 11:36 - 20:40
0.165
2 20
Beginning
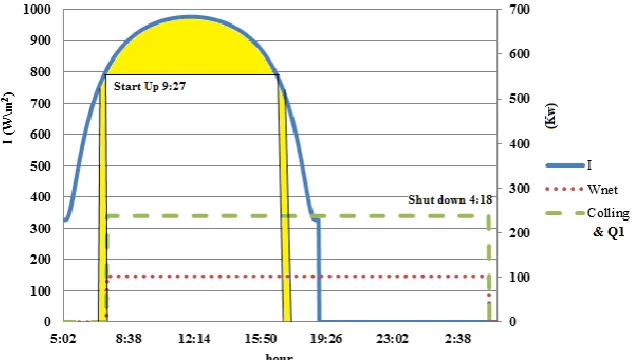
Figure 9 demonstrates turning-on and -off time of the cycle. The specified region shows storage hours of VP1 oil. Storage hour started from 07:03 and continued until 16:57. Considering the high flux volume in this region and suitable storage time, it can be observed that power and cooling generation is supplied for a suitable period. This trend is represented in Fig. 10 for heating the residential complex on the shortest day of the year.
Figure 9. Functioning period of solar cycle for CCHP of the residential complex on the longest day of the year
Figure 10. Functioning period of solar cycle for CCHP of the residential complex on the shortest day of the year
Considering the conducted calculations, factor of overall performance of solar cycle during the year was 63% which was equivalent to 5519 h per year. The power support system should generate mean of 100 kW for 3241 h per year.
Conclusion
temperature did not exceed 60°C. In winter, placing the condenser in circuit at lower pressure led to generating appropriate power and optimal storage on the shortest day of the year. Selecting this cycle caused increase in performance coefficient of the considered cycle by 63% of hours of the year.
Reference
Dudley, V.E., Kolb, G.J. and Mahoney, A.R. (1994). Test Results: SEGS LS-2 Solar Collector. SAND94-1884. Albuquerque, NM: SANDIA National Laboratories.
Karellas, S. and Braimakis, K. (2016). Energy–exergy analysis and economic investigation of a cogeneration and trigeneration ORC–VCC hybrid system utilizing biomass fuel and solar power, Energy Conversion and Management, 107: 103–113.
Yağlıa, H., Koça, Y., Koça, A., Görgülüb, A. and Tandiroğlu, A. (2016). Parametric optimization and exergetic analysis comparison of subcritical and supercritical organic Rankine cycle (ORC) for biogas fuelled combined heat and power (CHP) engine exhaust gas waste heat, Energy, 111: 923–932.
Freeman,J., Hellgardt,K. and Markides,C. N. (2016). Working fluid selection and electrical performance optimization of a domestic solar-ORC combined heat and power system for year-round operation in the UK, Applied Energy. Corrected Proof.
Ungureşan,P., Petreuş,D., Pocola,A. and Bălan,M. (2016). Potential of Solar ORC and PV Systems to Provide Electricity under Romanian Climatic Conditions, Energy Procedia, 85: 584-593.
Ameri, M. and Jorjani, M. (2016). Performance assessment and multi-objective optimization of an integrated organic Rankine cycle and multi-effect desalination system Desalination. 392: 34-45.
Mokhtari, H., Ahmadisedigh, H. and Ebrahimi, I. (2016). Comparative 4E analysis for solar desalinated water production by utilizing organic fluid and water, Desalination. 377: 108-122.
El-Dessouky, H. T., Ettouney, H. M. and Mandani, F. (2000). Performance of parallel feed multiple effect evaporation system for seawater desalination. Appl. Thermal Eng., 20: 1679– 1706.
Farouk Kothdewila, A., Norton, B. and Eames, P. C. (1995). The effect of variation of angle of inclination on the performance of low concentration ratio compound parabolic solar collector. Solar Energy, 55: 301-309.
Gnielinski, V. (1976). New Equations for Heat and Mass Transfer in Turbulent Pipe and Channel Flow. International Chemical Engineering, 16: 359–363.
Incropera, F. and DeWitt, D. (1990). Fundamentals of Heat and Mass Transfer, Third Ed. NY: John Wiley and Sons, New York.
Malika, O., Abdallah, K. and Larbi, L. (2013). Estimation of the temperature, heat gain and heat loss by solar parabolic trough collector under Algerian climate using different thermal oils. Energy Conversion and Management, 75: 191–201.
Tao, Y. B. and He, Y. L., (2010). Numerical study on coupled fluid flow and heat transfer process in parabolic trough solar collector tube. Solar Energy 84, 1863–1872.
Touloukian, Y.S. and DeWitt, D.P. (1972). Radiative Properties, Nonmetallic Solids. Thermophysical Properties of Matter, 8, New York, NY: Plenum Publishing.