0 INTRODUCTION
Electro discharge machining (EDM) has a one-off significant process for the machining of hard materials and superalloys. Heat-resistant superalloys (HRSA), especially the Inconel alloy, find applications in aerospace and marine components, cryogenic storage tanks, and nuclear reactor components. Understanding the importance of the Inconel alloy, manufacturing scientists and engineers are attempting to understand the behaviour of it through EDM processes. In the machining of Inconel 718, Shen et al. [1] applied high-speed EDM with air as a dielectric medium and produced components with better surface quality. The importance of powder-mixed dielectric fluid in the EDM for machining Inconel alloy was analysed by Talla et al. [2]. The researchers revealed better results for surface quality and accuracy while using
different powders, such as graphite, silicon, and aluminium [3] and [4]. Torres et al. [5] investigated the behaviour of an Inconel 600 alloy through EDM process. They studied the electrical parameters’ influence and concluded that the change in polarity has a significant influence on surface quality.Tanjilul et al.[6] reported that a novel flushing method and a machining current significantly influences the debris removal. The size of the debris particles increases with increasing machining current. Rajesha et al.
[7] studied the effect of process parameters such as
current, duty cycle, sensitivity control, inter-electrode gap control, and flushing pressure on the material removal rate (MRR) and surface roughness (SR). They found that the pulse current and duty factor has the highest influence. Kuppan et al. [8] reported that the MRR and SR increase with the increase in peak current, duty factor, and electrode speed.
Analysis of EDM Process Parameters on Inconel 718
Using the Grey-Taguchi and Topsis Methods
Thangavel, Y. – Paramasivam, S. Thangavel Yuvaraj* – Paramasivam Suresh
Muthayammal Engineering College (Autonomous) Rasipuram, Department of Mechanical Engineering, India
Nickel-based superalloys are gaining importance for their growing usage in aerospace industries. Amidst the various advanced machining processes, electro discharge machining (EDM) is considered to be an important one for its ability to machine materials irrespective of its intrinsic properties. In this study, Inconel 718 is considered as a work material, and an L18 orthogonal array (OA) experimental plan is utilized
to machine the work material. The influential factors, which affect the EDM performance characteristics, are identified using analysis of variance (ANOVA). Not much work has been done regarding using grey-Taguchi technique for order of preference by similarity to ideal solution (TOPSIS) methods, although these methods can be easily applied for multi-objective optimization. These methods provide the best results with the available sparse data. The best combination of machining factors is determined using grey-Taguchi and TOPSIS methods. Based on the conducted experiments, voltage (V) and pulse off-time (toff) show a notable contribution on output performance. The optimal combination of
input parameter through grey-Taguchi is found to be 10 A, 30 V, 200 µs, and 20 µs respectively, for the EDM parameters: current (I), V, pulse on-time (ton) and toff for improved response. Moreover, the best parameter setting (I = 10 A, V = 30 V, ton =100 µs and toff = 20 µs) is identified
using the TOPSIS method for the performance measures machining rate (MR), tool wear rate (TWR), overcut (OC), and taper overcut (TOC). Further tool wear behaviour is also studied through scanning electron microscope (SEM) images by varying the voltage.
Keywords: Inconel, ANOVA, grey-Taguchi, overcut, taper
Highlights
• EDM process parameters(voltage, current, pulse on- time and pulse off- time) were optimized through the L18 orthogonal experimental design method, and the grey relational analysis (GRA) method, considering multi-responses, such as machining rate (MR), tool wear rate (TWR), overcut (OC), and taper overcut (TOC).
• The methods grey-Taguchi and TOPSIS were used to study the influential parameters that provide the best results with the available sparse data.
• Based on GRA and TOPSIS, the optimum level parameters for EDM have been identified. Furthermore, the tool wear behaviour is also studied through SEM images by varying the voltage.
• The optimal combination of the input parameter to acquire better responses based on grey-Taguchi has been found to be (10 A), V (30 V), ton (200 µs), and toff (20 µs). According to ANOVA, the voltage and toff plays a prominent role in machining Inconel
718.
558 Thangavel, Y. – Paramasivam, S. Mohanty et al. [9] conducted an L9 orthogonal array
(OA) and optimized the EDM process parameters of Inconel 825 using grey relational analysis (GRA). The parameters combination ( I (1A), ton (10 µs), and duty cycle (75 %)) showed good results for the rate of material removed, surface quality, and radial overcut. Mohanty et al. [10] highlighted the importance of cryogenic treatment of tool in EDM on output performance using technique for order of preference by the similarity to ideal solution (TOPSIS) method and teaching–learning-based optimization algorithm.
Dang [11] optimized the EDM parameters using a kriging model and particle swarm optimization method,finding that the model and method is suitable for the optimization of EDM process. Lin et al. [12] optimized and enhanced the EDM process parameters for Inconel 718 through multi-objective optimization technique using grey-Taguchi. Muthuramalingam and Mohan [13] machined SS 201 through EDM and established the importance of peak current. Lin et al. [14] conducted experiments on Ti-6Al-4V alloy through Micro-EDM and studied the influence of process parameters and gaps using the grey relational analysis (GRA)-Taguchi technique. The use of the GRA with Taguchi technique yields better results for tool electrode wear and overcut.Based on the above literature, the characteristics of EDM for machining holes on Inconel 718 are influenced by various input parameters. Each performance characteristic has different combinations of optimal process parameters and thus, in the case of multiple responses, the selections of optimal machining parameters are difficult. The grey system, proposed by Deng [15], handles the vague information and thus the GRA method is recommended as a principal method for multiple response optimisation. Therefore, researchers optimized the machining of Inconel 718 using electrical parameters and inter-electrode gap (IEG).In this paper, EDM process parameters: I, V, ton and toff were optimized through the L18 orthogonal experimental design method, and the GRA method considering multi-responses, such as machining rate (MR), tool wear rate (TWR), overcut (OC) and taper overcut (TOC). Not much work has been done using the grey-Taguchi and TOPSIS methods although these can be easily applied for multi-objective optimization. The significant contribution of this research is in using these methods to study the influential parameters that provide the best results with the available sparse data.Based on GRA and TOPSIS, the optimum level parameters for EDM have been identified. Furthermore, the tool wear behaviour is also studied
through scanning electron microscope (SEM) images by varying the voltage.
1 EXPERIMENTAL
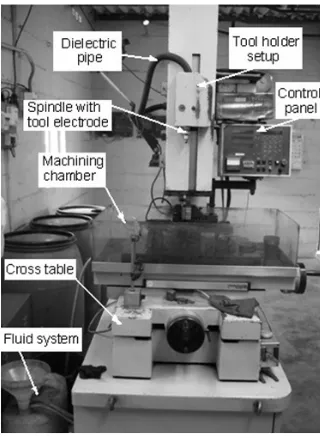
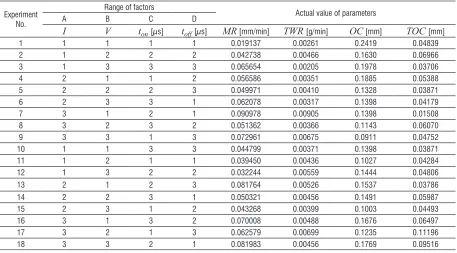
The experimental set-up for EDM machining process is shown in Fig. 1. It consists of a maximum working voltage of 415 V, maximum current of 25 A, work table size of 600 mm × 400 mm, a maximum electrode length of 400 mm, and a servomotor for inter-electrode gap control. Inconel 718 has been selected as a workpiece material, whereas a brass electrode of Ø 0.5 mm is used with EDM oil as the dielectric medium. Tables 1 and 2 provides the details of chemical and mechanical properties of Inconel 718 [16]. The thickness of workpiece is 3.1 mm. Since the discharge energy is primarily determined by current (I), voltage (V), pulse on-time (ton), and pulse off-time (toff), these factors are used as the input parameters. These parameters are selected based on the literature review, and levels are identified based the preliminary experiments;10 A, 12 A and 14 A have been considered as current variables; 30 V, 40 V and 50 V have been chosen as voltage variables;100 µs, 150 µs and 200 µs have been chosen as ton values with toff values of 20 µs, 30 µs and 40 µs. Table 3 shows the experimental layout using an L18 OA. MR is calculated by dividing the length of the through hole with the machining time required to complete the through hole. TWR is calculated using the relation mass is ρ × v, where ρ is brass density, v volume of brass tool (πr2h), h brass tool height. During the start and end of each
experiment, the length of the brass tool is measured, and the difference is noted as h; this value is used to calculate the volume of brass electrode. The ratio of volume of electrode wear to the time taken to complete the experiment is called TWR. OC is calculated using optical microscopic images. OC is defined by ΔR = Re – Rt, where Re is the entrance radius of the machined hole and Rt the tool electrode radius.The difference in Re and Rt results in OC. TOC is defined by TOC = D – d / (2L), where, D is entry diameter of the machined hole, d exit diameter of the machined hole, and L thickness of the workpiece.
Table 2. Mechanical properties of Inconel 718
Hardness [HB] Yield limits [MPa] Tensile stress [MPa]
388 1375 1170
2 RESULTS
MR is the measure of machinability of the material. Hence, for a characteristic like MR, “larger-the-better”
is considered and the obtained MR data values are homogenized as shown below [14]:
x i x i x i
x i x i
j j j
j j
* min
min min ,
( )
=( )
−( )
( )
−( )
(1)where x i*j
( )
are the homogenized MR after thepreprocessing, is the signal-to-noise ratio of the MR, where i = 1 for MR; i = 1, 2, 3, …, 18 for experiments 1 to 18.
EDM performance is also measured using TWR, OC and TOC. Hence, to achieve better machining quality, the “smaller-the-better” is considered in view of minimizing TWR, OC, and TOC. Therefore the actual sequence must be normalized as follows [14]:
x i x i x i
x i x i
j j i
j j
* max
max min ,
( )
=( )
−( )
( )
−( )
(2)where x i0 0j i x ij
* *
, ,
( )
∆( ) ( )
are reference sequence, deviation sequence and comparability sequence, respectively.∆0j
( )
i = x i0( )
−x ij( )
* *
. (3)
Table 1. Chemical composition of Inconel 718 (weight %)
C Mn Si Cr Ni Co Mo Nb+Ta Ti Al Fe
0.040 0.08 0.08 18.37 53.37 0.23 3.04 5.34 0.98 0.50 17.80
Table 3. L18 orthogonal array
Experiment No.
Range of factors
Actual value of parameters
A B C D
I V ton [µs] toff [µs] MR [mm/min] TWR [g/min] OC [mm] TOC [mm]
1 1 1 1 1 0.019137 0.00261 0.2419 0.04839
2 1 2 2 2 0.042738 0.00466 0.1630 0.06966
3 1 3 3 3 0.065654 0.00205 0.1978 0.03706
4 2 1 1 2 0.056586 0.00351 0.1885 0.05388
5 2 2 2 3 0.049971 0.00410 0.1328 0.03871
6 2 3 3 1 0.062078 0.00317 0.1398 0.04179
7 3 1 2 1 0.090978 0.00905 0.1398 0.01508
8 3 2 3 2 0.051362 0.00366 0.1143 0.06070
9 3 3 1 3 0.072961 0.00675 0.0911 0.04752
10 1 1 3 3 0.044799 0.00371 0.1398 0.03871
11 1 2 1 1 0.039450 0.00436 0.1027 0.04284
12 1 3 2 2 0.032244 0.00559 0.1444 0.04806
13 2 1 2 3 0.081764 0.00526 0.1537 0.03786
14 2 2 3 1 0.050321 0.00456 0.1491 0.05987
15 2 3 1 2 0.043268 0.00399 0.1003 0.04493
16 3 1 3 2 0.070008 0.00488 0.1676 0.06497
17 3 2 1 3 0.062579 0.00699 0.1235 0.11196
560 Thangavel, Y. – Paramasivam, S. Similarly, other computation was carried out
for 18 experiments and the values of all Δ0j for j = 1, 2, 3, …, 18 are represented in Table 4.
In continuation of data preprocessing, a coefficient for grey relational analysis is found using the relation given below [14]:
ξ ζ
ζ j
j
i
k
( )
= + ⋅( )
+ ⋅∆ ∆
∆ ∆
min max
max , 0
(4)
where ζ is a unique coefficient and ζ is considered as 0.5 because all parameters are given equal weight.
The grey relational grade (GRG) presented in Table 5 is calculated by averaging the GRC and overall
Table 4. Performance characteristics of the processed data Experiment
run reference sequence
Performance characteristics after data processing Deviation sequences MR
[mm/min] [g/min]TWR [mm]OC TOC [mm] MR
[mm/min] [g/min]TWR [mm]OC TOC [mm]
1 0.0000 0.9197 0.0000 0.6562 1.0000 0.0803 0.0000 0.3438
2 0.3285 0.6270 0.5231 0.4366 0.6715 0.3730 0.5231 0.5634
3 0.6475 1.0000 0.2924 0.7731 0.3525 0.0000 0.2924 0.2269
4 0.5213 0.7921 0.3539 0.5995 0.4787 0.2079 0.3539 0.4005
5 0.4292 0.7069 0.7231 0.7561 0.5708 0.2931 0.7231 0.2439
6 0.5977 0.8399 0.6769 0.7243 0.4023 0.1601 0.6769 0.2757
7 1.0000 0.0000 0.6769 1.0000 0.0000 1.0000 0.6769 0.0000
8 0.4486 0.7697 0.8462 0.5291 0.5514 0.2303 0.8462 0.4709
9 0.7492 0.3289 1.0000 0.6652 0.2508 0.6711 1.0000 0.3348
10 0.3572 0.7634 0.6769 0.7561 0.6428 0.2366 0.6769 0.2439
11 0.2827 0.6695 0.9231 0.7135 0.7173 0.3305 0.9231 0.2865
12 0.1824 0.4937 0.6462 0.6596 0.8176 0.5063 0.6462 0.3404
13 0.8718 0.5416 0.5846 0.7649 0.1282 0.4584 0.5846 0.2351
14 0.4341 0.6418 0.6154 0.5377 0.5659 0.3582 0.6154 0.4623
15 0.3359 0.7221 0.9385 0.6919 0.6641 0.2779 0.9385 0.3081
16 0.7081 0.5952 0.4923 0.4851 0.2919 0.4048 0.4923 0.5149
17 0.6047 0.2939 0.7846 0.0000 0.3953 0.7061 0.7846 1.0000
18 0.8748 0.6418 0.4308 0.1734 0.1252 0.3582 0.4308 0.8266
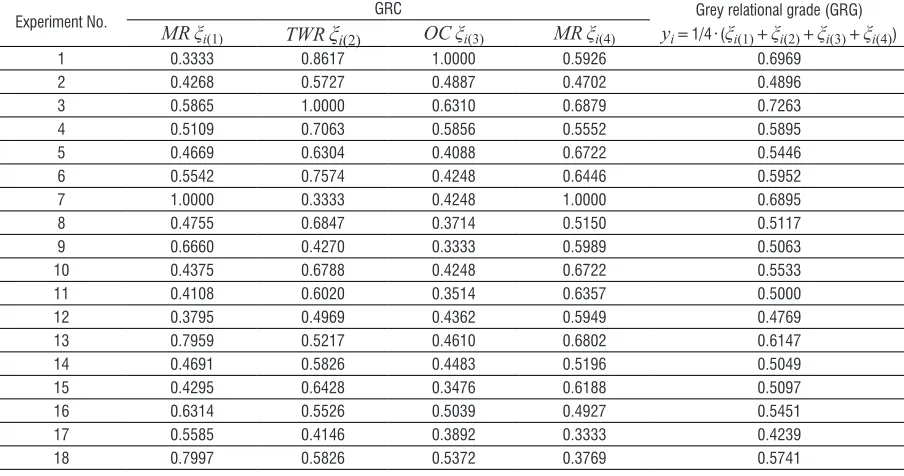
Table 5. Computed Grey relational grade
Experiment No. GRC Grey relational grade (GRG)
yi = 1/4 · (ξi(1) + ξi(2) + ξi(3) + ξi(4)) MRξi(1) TWRξi(2) OCξi(3) MRξi(4)
1 0.3333 0.8617 1.0000 0.5926 0.6969
2 0.4268 0.5727 0.4887 0.4702 0.4896
3 0.5865 1.0000 0.6310 0.6879 0.7263
4 0.5109 0.7063 0.5856 0.5552 0.5895
5 0.4669 0.6304 0.4088 0.6722 0.5446
6 0.5542 0.7574 0.4248 0.6446 0.5952
7 1.0000 0.3333 0.4248 1.0000 0.6895
8 0.4755 0.6847 0.3714 0.5150 0.5117
9 0.6660 0.4270 0.3333 0.5989 0.5063
10 0.4375 0.6788 0.4248 0.6722 0.5533
11 0.4108 0.6020 0.3514 0.6357 0.5000
12 0.3795 0.4969 0.4362 0.5949 0.4769
13 0.7959 0.5217 0.4610 0.6802 0.6147
14 0.4691 0.5826 0.4483 0.5196 0.5049
15 0.4295 0.6428 0.3476 0.6188 0.5097
16 0.6314 0.5526 0.5039 0.4927 0.5451
17 0.5585 0.4146 0.3892 0.3333 0.4239
assessment of the multiple objective optimization determined using Eq. (5).
γj χ
a b
i
b a
=
( )
=
∑
1
1
, (5)
where γj is the GRG of jth experiment and b is the number of performance characteristics.
3 DISCUSSION
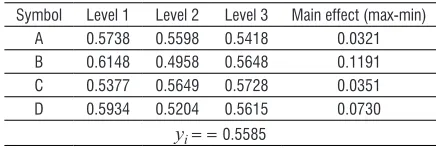
The multi-response performance index presented in Table 6 presents the average value of the GRG for every level. The highest value of GRG indicates the best possible level of the process parameters. The calculated higher GRG value indicates the closeness to the optimal value. The total mean of the GRG for the eighteen runs was estimated and is presented in Table 6. The optimal parameter combination for better MR and lesser TWR, OC and TO is found to be (A1B1C3D1) as given in Table 6.
Table 6. Multi response performance index
Symbol Level 1 Level 2 Level 3 Main effect (max-min)
A 0.5738 0.5598 0.5418 0.0321
B 0.6148 0.4958 0.5648 0.1191
C 0.5377 0.5649 0.5728 0.0351
D 0.5934 0.5204 0.5615 0.0730
yi = = 0.5585
3.1 ANOVA
The influence of process parameter on the performance characteristic was analyzed using analysis of variance (ANOVA). The effect of process parameters is measured by the sum of the squared deviations. It predicts˝the influential process parameter on output performance. The total sum of the squared deviations (SSD) from the total mean of the GRG yi can be calculated as:
SSD j i
j p =
(
−)
=
∑
γ γ 2 1. (6)
In which, p is the number of experiments in the OA and γj is the mean of the GRG for the jth experiment.
The sum of the squares (SS) calculated is divided by degrees of freedom (DoF) to obtain mean square of a factor (MSj) or error (MSe). The percentage contribution (φ) of each of the design parameters is obtained using the Eq. (7) [14].
ϕj j T
ss ss
= . (7)
Moreover, Fisher’s test (F test) is also performed to establish machining parameters’ influence on the performance characteristic [17]. ANOVA for GRG is presented in Table 7. Based on the ANOVA, table voltage and pulse off-time show a higher percentage contribution, hence voltage and pulse off-time are dominant parameters that affect the MR, TWR, OC and TOC. In EDM, increase voltage increase the current required for machining which improves the ionization effect between the tool and electrode. This ionization effect increases the temperature of the tool and electrode, resulting in melting of workpiece material. The molten material resulted from heating is evaporated during pulse off time of the EDM process. Hence, the voltage and pulse off-time are considered as significant factors in EDM.
Table 7. ANOVA table
Factors DoF SS MSj F ratio φ
I 2 0.003 0.0016 0.2931 2.72
V 2 0.042 0.0214 4.056 37.71
ton 2 0.004 0.002 0.3841 3.57
toff 2 0.016 0.008 1.521 14.14
Error 9 0.047 0.0053 41.84
Total 17 0.113 0.0067 100
3.2 Confirmation Test
Confirmation tests were performed to show the improvement of performance characteristics [14]. The calculated GRG (I) is calculated as shown below:
η η
=
+
η η
−
=∑
m i m
i q
(
),
1
(8)
where ηm is the total mean of the GRG, q is the number of significant parameters; ηi is the mean of the GRG at the optimal level. The predicted MR, TWR OC and TOC overcut and GRG for the best possible machining factors are estimated using the Eq. (8). Based on the confirmation test, GRG has improved by 0.0153 from the initial level; hence, as a whole, the performance of EDM process has been improved.
3.3 TOPSIS
562 Thangavel, Y. – Paramasivam, S. Step 1: The decision matrix consists of ‘n’
attributes and ‘m’ alternatives, and it is represented in Eq. (9). A=
T T T
T T T
T T T
n
n
m m mn
11 12 1
21 22 1
1 2 ... ... ... . (9)
Here Tij is the performance of ith alternative with respect to jth attribute.
Step 2: Using Eq. (10), normalize decision matrix values were found.
r T T j n ij ij ij i m = = =
∑
2 1 1 2, , ,, . (10)
Step 3: Weight for each response are calculated, and the associated weights are multiplied with normalized decision matrix to obtain the weighted normalized decision matrix. The weighted normalized decision matrix is obtained as:
Rij = Mi × rij, (11) where i = 1, ..., m and j = 1, ..., n. Mj represents the weight of the jth attribute or criteria.
Step 4: Positive ideal solution (PIS) and negative ideal solution (NIS) are determined as follows: N+ = (n1+, n2+, ..., nx+) maximum values, (12) N– = (n
1–, n2–, ..., nx–) minimum values. (13) Step 5: The separation of each alternative from positive ideal solution (PIS) is calculated as:
αi ij j
j n
T x i m
+ +
=
=
∑
(
−)
2 =1
1 2
, , ,..., . (14)
The separation of alternatives form the negative-ideal solution is expressed in Eq. (15).
αi n
ij j
j T x i m
− −
=
=
∑
(
−)
2 =1
1 2
, , ,..., . (15)
Step 6: Eq. (16) is used to find the relative proximity of the different alternative to the ideal solution.
Pi i i m
i i = + = − + − α
α α , 1 2, ,..., . (16)
Step 7: the Pi values (preference value) are ranked in descending order to find the optimal parameters combination.
3.4 TOPSIS Analysis
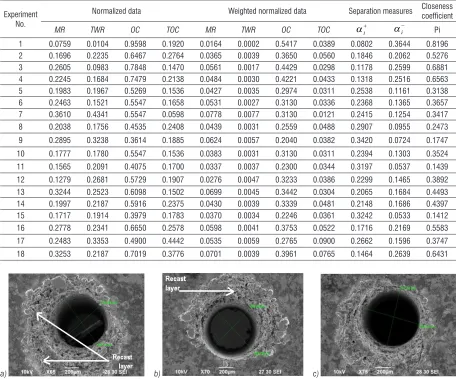
The four responses such as MR, TWR, OC and TOC are normalized using the Eq. (10). In this analysis, the weight criterion for MR, TWR, OC and TOC are 0.2154, 0.0177, 0.5644 and 0.2026, respectively. The relative normalized weight matrix has been computed using the proper weight criteria. The weight criteria are multiplied to obtain the normalized weighted matrix using Eq. (11). The ideal and the negative ideal solutions are calculated from the normalized weighted matrix table; that is, VMR+ = 0.0778, VMR− = 0.0164, VTWR+ = 0.0077, VTWR− = 0.0002, VOC+ = 0.5417, VOC− = 0.2040,
VTOC+ = 0.0900 and VTOC− = 0.0121. The separation measures of each condition from the ideal and negative ideal solutions were computed with Eqs. (14) and (15). Finally, the relative closeness coefficient (CC) value for each combination of factors of EDM process is calculated using Eq. (16), which is shown in Table 8. It is evident from Table 1 that experiment No. 1 is the best experiment and experiment No. 3 is second best alternative. According to this result, it is recommended to choose experiment No. 1, which has the highest proximity coefficient value among alternative experiments. Thus, it is evident from the TOPSIS analysis that the combination of process parameters such as 10 A, 30 V, 100 µs and 20 µs is suitable for the best EDM performance measures.
On comparing the grey-Taguchi and TOPSIS method results, the best level for I, V and toff are 10 A, 30 V and 20 µs. Based on these results, the pulse on time shows two optimal levels, 100 µs and 200 µs, respectively. Although the levels for pulse on time are different, it will not have any significant impact on the performance since the contribution of pulse on time is very minimal, as shown in ANOVA Table 7. Hence, based on the results, it is clear that both these approaches are viable for arriving at the optimal process parameter combination with the available sparse data.
3.5 Analysis of Tool Wear
the other parameters such I, ton, and toff constant. The voltage value is varied as 30 V, 40 V, 50 V by keeping the I, ton,and toff at 14 A, 200 µs, and 40 µs, respectively. Each experiment is repeated once. Based on the SEM micrograph, which is shown in Fig. 2, it is evident that the wear pattern varies with the voltage. It is evident from Fig. 2 that the recast layer pattern observed around the circumference of the hole varies with voltage. It is due to the fact that tool wear on the electrode is not even and, hence, the uneven electrode face will have different proximity towards the workface, resulting in uneven recast layer on the circumference of the hole. Further studies are required to understand the tool wear behaviour when machining Inconel 718.
4 CONCLUSIONS
Machining characteristic optimization of EDM for Inconel 718 is preformed using grey-Taguchi method. The optimal machining parameters were found using GRG for multi-performance characteristics. Eighteen experimental runs based on OA have been performed. The optimal combination of input parameter to acquire better responses based on grey-Taguchi has been found to be I (10 A), V (30 V), ton (200 µs) and toff (20 µs). According to ANOVA, the voltage and toff plays a prominent role in machining Inconel 718. The confirmation test result proves that there is a notable improvement in the GRA value from 0.6969 to 0.7122, when machining is done with the optimal parametric combination. Based on the confirmation Table 8. Normalized data, weighted normalized data, separation measures and closeness coefficient values
Experiment No.
Normalized data Weighted normalized data Separation measures Closeness
coefficient
MR TWR OC TOC MR TWR OC TOC α�i+ α�i− Pi
1 0.0759 0.0104 0.9598 0.1920 0.0164 0.0002 0.5417 0.0389 0.0802 0.3644 0.8196
2 0.1696 0.2235 0.6467 0.2764 0.0365 0.0039 0.3650 0.0560 0.1846 0.2062 0.5276
3 0.2605 0.0983 0.7848 0.1470 0.0561 0.0017 0.4429 0.0298 0.1178 0.2599 0.6881
4 0.2245 0.1684 0.7479 0.2138 0.0484 0.0030 0.4221 0.0433 0.1318 0.2516 0.6563
5 0.1983 0.1967 0.5269 0.1536 0.0427 0.0035 0.2974 0.0311 0.2538 0.1161 0.3138
6 0.2463 0.1521 0.5547 0.1658 0.0531 0.0027 0.3130 0.0336 0.2368 0.1365 0.3657
7 0.3610 0.4341 0.5547 0.0598 0.0778 0.0077 0.3130 0.0121 0.2415 0.1254 0.3417
8 0.2038 0.1756 0.4535 0.2408 0.0439 0.0031 0.2559 0.0488 0.2907 0.0955 0.2473
9 0.2895 0.3238 0.3614 0.1885 0.0624 0.0057 0.2040 0.0382 0.3420 0.0724 0.1747
10 0.1777 0.1780 0.5547 0.1536 0.0383 0.0031 0.3130 0.0311 0.2394 0.1303 0.3524
11 0.1565 0.2091 0.4075 0.1700 0.0337 0.0037 0.2300 0.0344 0.3197 0.0537 0.1439
12 0.1279 0.2681 0.5729 0.1907 0.0276 0.0047 0.3233 0.0386 0.2299 0.1465 0.3892
13 0.3244 0.2523 0.6098 0.1502 0.0699 0.0045 0.3442 0.0304 0.2065 0.1684 0.4493
14 0.1997 0.2187 0.5916 0.2375 0.0430 0.0039 0.3339 0.0481 0.2148 0.1686 0.4397
15 0.1717 0.1914 0.3979 0.1783 0.0370 0.0034 0.2246 0.0361 0.3242 0.0533 0.1412
16 0.2778 0.2341 0.6650 0.2578 0.0598 0.0041 0.3753 0.0522 0.1716 0.2169 0.5583
17 0.2483 0.3353 0.4900 0.4442 0.0535 0.0059 0.2765 0.0900 0.2662 0.1596 0.3747
18 0.3253 0.2187 0.7019 0.3776 0.0701 0.0039 0.3961 0.0765 0.1464 0.2639 0.6431
a) b) c)
564 Thangavel, Y. – Paramasivam, S. test, it is evident that GRA may be applied with sparse
data in manufacturing industries to optimize the EDM process parameters to be competitive in the market. The best combinations identified using the TOPSIS method for better performance measures is 10 A, 30 V, 100 µs and 20 µs. These multi-objective optimization techniques are found to be suitable for optimizing the EDM process parameter. Tool wear behaviour is also studied through SEM images by varying the voltage. The SEM micrographs confirm that the wear pattern varies with the voltage. Hence detail analysis and optimization of electrical parameters may be considered as future work.
5 REFERENCES
[1] Shen, Y., Liu, Y., Dong, H., Zhang, K., Lv, L., Zhang, X., Wu, X., Zheng, C., Ji, R. (2017). Surface integrity of Inconel 718 in high-speed electrical discharge machining milling using air dielectric. The International Journal of Advanced Manufacturing Technology, vol. 90, no. 1-4, p. 691-698,
DOI:10.1007/s00170-016-9332-7.
[2] Talla, G., Gangopadhyay, S., Biswas, C.K. (2016). Effect of powder-suspended dielectric on the EDM characteristics of Inconel 625. Journal of Materials Engineering and Performance, vol. 25, no. 2, p. 704-717, DOI:10.1007/s11665-015-1835-0.
[3] Talla, G., Gangopadhyay, S., Biswas, C.K. (2017). Influence of graphite powder mixed EDM on the surface integrity characteristics of Inconel 625. Particulate Science and Technology: An International Journal, vol. 35, no. 2, p. 219-226, DOI:10.1080/02726351.2016.1150371.
[4] Dhanabalan, S., Sivakumar, K., Sathiya Narayanan, C. (2014). Analysis of form tolerances in electrical discharge machining process for Inconel 718 and 625. Materials and Manufacturing Processes, vol. 29, no. 3, p. 253-259,
DOI:10.1080/10426914.2013.852213.
[5] Torres, A., Luis, C.J., Puertas, I. (2015). Analysis of the influence of EDM parameters on surface finish material removal rate and electrode wear of an Inconel 600 alloy. The International Journal of Advanced Manufacturing Technology, vol. 80, no. 1-4, p. 123-140, DOI:10.1007/s00170-015-6974-9.
[6] Tanjilul, M., Ahmed, A., Senthil Kumar, A., Rahman, M. (2018). A study on EDM debris particle size and flushing mechanism for efficient debris removal in EDM-drilling of Inconel 718.
Journal of Materials Processing Technology, vol. 255, p. 263-274, DOI:10.1016/j.jmatprotec.2017.12.016.
[7] Rajesha, S., Sharma, A.K., Kumar, P. (2012). On electro discharge machining of Inconel 718 with hollow tool. Journal
of Materials Engineering and Performance, vol. 21, no. 6, p. 882-891, DOI:10.1007/s11665-011-9962-8.
[8] Kuppan, P., Rajadurai, A., Narayanan, S. (2008). Influence of EDM process parameters in deep hole drilling of Inconel 718. The International Journal of Advanced Manufacturing Technology, vol. 38, no. 1-2, p. 74-84, DOI:10.1007/s00170-007-1084-y.
[9] Mohanty, A., Talla, G., Gangopadhyay, S. (2014). Experimental investigation and analysis of EDM characteristics of Inconel 825. Materials and Manufacturing Processes, vol. 29, no. 5, p. 540-549, DOI:10.1080/10426914.2014.901536.
[10] Mohanty, C.P.,Satpathy, M.P., Mahapatra, S.S., Singh, M.N. (2018). Optimization of cryo-treated EDM variables using TOPSIS-based TLBO algorithm. Sadhana, vol. 43, no. 51,
DOI:10.1007/S12046-018-0829-7.
[11] Dang, X.P. (2018).Constrained multi-objective optimization of EDM process parameters using kriging model and particle swarm algorithm. Materials and Manufacturing Processes, vol. 33, no. 4, p. 397-404, DOI:10.1080/10426914.2017.129 2037.
[12] Lin, M.-Y., Tsao, C.-C., Hsu, C.-Y., Chiou, A.-H., Huang, P.-C., Lin, Y.-C. (2013). Optimization of micro milling electrical discharge machining of Inconel 718 by Grey-Taguchi method.
Transactions of Nonferrous Metals Society of China, vol. 23, no. 3, p. 661-666, DOI:10.1016/S1003-6326(13)62513-3.
[13] Muthuramalingam, T., Mohan, B. (2013). Taguchi-grey relational based multi response optimization of electrical process parameters in electrical discharge machining. Indian Journal of Engineering & Materials Science, vol. 20, no. 6, p. 471-475.
[14] Lin, M.Y., Tsao, C.C., Huang, H.H., Wu, C.Y., Hsu, C.Y. (2015). Use of the grey-Taguchi method to optimise the micro-electrical discharge machining (micro-EDM) of Ti-6Al-4V alloy. International Journal of Computer Integrated Manufacturing, vol. 28, no. 6, p. 569-576, DOI:10.1080/095 1192X.2014.880946.
[15] Deng, J.L. (1982). Control problems of grey systems. System & Control Letters, vol. 1, no. 5, p. 288-294, DOI:10.1016/S0167-6911(82)80025-X.
[16] Nalbant, M., Altın, A., Gökkaya, H. (2007). The effect of cutting
speed and cutting tool geometry on machinability properties of nickel-base Inconel 718 super alloys. Materials & Design, vol. 28, no. 4, p. 1334-1338, DOI:10.1016/j.matdes.2005.12.008.
[17] Fisher, R.A. (1925). Statistical Methods for Research Worker, Oliver & Boyd, London.