DEMOGRAPHIC RESEARCH
A peer-reviewed, open-access journal of population sciences
DEMOGRAPHIC RESEARCH
VOLUME 29, ARTICLE 35, PAGES 937-948
PUBLISHED 5 NOVEMBER 2013
http://www.demographic-research.org/Volumes/Vol29/35/
DOI: 10.4054/DemRes.2013.29.35
Descriptive Finding
The life cycle dimension of time transfers in
Europe
Emilio Zagheni
Marina Zannella
c
2013 Emilio Zagheni & Marina Zannella.
2 Data and methods 939
3 Results 940
4 Conclusions 946
5 Acknowledgements 947
Demographic Research: Volume 29, Article 35
Descriptive Finding
The life cycle dimension of time transfers in Europe
Emilio Zagheni1
Marina Zannella2
Abstract
BACKGROUND
Reallocation of economic resources between generations and genders has important con-sequences for economic growth and inequality. Unpaid work is a relevant component of intergenerational transfers, but is invisible to traditional accounts. Time use data can complement accounts of monetary transfers.
OBJECTIVE
The main goal of this article is to provide estimates of life cycle profiles of consumption and production of unpaid activities. These profiles can be used to evaluate transfers of time by age and sex.
METHODS
We use data from the Multinational Time Use Study (MTUS) to estimate profiles of time allocated to unpaid productive activities, by age, sex and household structure, for selected European countries. The unpaid working time is then distributed, with a statistical model, to those age groups that benefit from it, in order to estimate age-specific consumption profiles of time.
RESULTS
We observe large transfers of time from females to males, and from adults to children. Life course trajectories are qualitatively similar across countries, but with significant variations in levels. Differences in profiles by household structure may be associated with incentives or disincentives for particular fertility choices in different social and institutional settings.
1Queens College of the City University of New York. E-mail: [email protected].
CONCLUSIONS
This article quantifies household production and non-market transfers. It offers insight into the underestimation of the economic contribution of women.
COMMENTS
This article provides some descriptive findings that could be incorporated with other re-search pursued by scholars in the National Transfer Accounts (NTA) project to monetize the value of time and include it in standard transfer accounts.
1.
Introduction
A large quantity of goods and services are produced by household members for their own consumption, without involving market transactions. Despite the economic and so-cial importance of unpaid work, these productive activities are largely invisible to stan-dard national economic accounts. Consequently, traditional measures of intergenerational transfers typically ignore household production, and thus underestimate the overall value of goods and services produced over the life cycle, in particular, the economic contribu-tion of women.
Recently, there have been some efforts to evaluate the extent of household production, and to integrate it into national accounts (e.g., Abraham and Mackie 2005; Anxo et al. 2007; Donehower and Mejia-Guevara 2012; Sambt and Malacic 2012). The increasing availability of harmonized time use surveys has made possible comparative analyses of non-market activities. The estimation of time transfers between generations and genders is intended to create a map of new and partially unexplored territories. The results of this line of research would complement traditional studies of intergenerational market-based transfers between generations and across countries.
Demographic Research: Volume 29, Article 35
2.
Data and methods
We use data from the Multinational Time Use Study (MTUS) to estimate age- and sex-specific profiles of time consumption and production. MTUS includes a collection of time use surveys that have been harmonized to allow for comparative analyses. Large samples of micro data, with information on the allocation of time to various activities of daily life, are available for several European countries. In this article, we use data for 4 European countries for which we have large samples and recent surveys. More specifically, we analyze data from 51,206 diaries from Italy (2002), 46,774 diaries from Spain (2002), 35,813 diaries from Germany (2001), and 15,441 diaries from France (1998). The large samples allow for disaggregation of the activities by sex and single years of age. For Italy and Spain, there are between 200 and 400 individuals in each single-sex and single-year age group. The sample size is similar for Germany, except for a few sex- and age-groups for which we have around 100 observations, and for people who are older than 70 years, for whom the single-year and single-sex sample size is reduced to about 50 observations. For France, the total sample size is smaller. Nonetheless, most of the single-year and single-sex cells have between 80 and 150 observations.
Data on time use are collected using diaries in which respondents report their main and secondary activities during a randomly assigned day, as well as their locations and the presence of any other person. The MTUS micro data provide valuable information about time dedicated to production and consumption, at both the household and individual levels.
We estimate both age- and sex-specific profiles of time production directly from sur-vey data. First, we identify a set of unpaid productive activities that meet the “third party criterion” (i.e., people can potentially pay somebody else to do the activities for them (Reid 1934)). These activities include childcare, housework, shopping, caregiving, gardening, and other related household activities. Then we evaluate the average time ded-icated to these activities by sex and age group, and use Friedman’s smoother (Friedman 1984) to obtain a smooth profile of time dedicated to unpaid productive activities by age. We assume that the overall time produced within the household is equal to the over-all time consumed, and that time consumption does not vary by sex. We do not have any direct information about how household members consume the time produced at the household level. Hence, in order to generate age-specific profiles of time consumption, we use an indirect method. More specifically, we generate estimates of profiles of time consumption using an approach that has been widely used to evaluate consumption of eco-nomic goods for individuals, by age, from aggregate household-level data (e.g., Mankiw and Weil 1989; Zagheni 2011). The method is based on a regression model with indicator variables for different age groups in the household. The overall consumption of time for
member of the household:
Cj=
M X
k=1
Cjk (1)
whereCjkis the consumption of thekth member of householdj, andM is the household
size. For each individual, consumption of time is considered as a function of age. Thus,
time consumption for an individual of ageacan be expressed asβ(a). In a linear setting,
each age group has its own parameter, so that:
Cjk=β(0)I(0)k+· · ·+β(a)I(a)k+· · ·+β(80)I(80)k (2)
whereI(a)k is equal to 1 if the age of household memberkis equal toa; 0 otherwise.
Combining equation 1 with equation 2, we obtain the following expression, with param-eters that can be estimated using a linear regression model:
Cj =β(0)Nj(0) +· · ·+β(a)Nj(a) +· · ·+β(80)Nj(80) (3)
where:
Cj= total time for domestic activities produced/consumed by householdj
Nj(a)= Number of members of ageafor householdj
β(a)= OLS parameter estimates that represent the effect of an additional person of agea
on household time consumption/production.
Theβ coefficients in equation 3 can be interpreted as demand or consumption of time,
for the respective age groups. We smoothed the series of coefficients for each single age group, using Friedman’s smoother, to obtain a smooth profile of time consumption by age and sex.
The difference between profiles of consumption and production gives a measure of the life cycle deficit for each age group and sex. Positive values for the life cycle deficit indicate that the person in the specific age group considered consumes more household time than he or she produces.
3.
Results
Demographic Research: Volume 29, Article 35
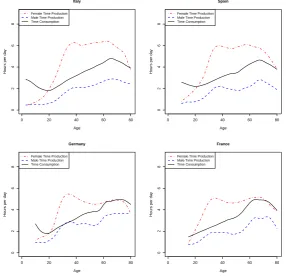
with a tendency to either stabilize or slightly decrease thereafter. In some countries we observe two peaks, one around the typical age at childbearing, and the other around the age at retirement, or the age when women become grandmothers.
Figure 1: Estimates of profiles of time dedicated to unpaid productive
activities by age and sex, and consumption of time, by age, for selected countries
0 20 40 60 80
0 2 4 6 8 Italy Age
Hours per da
y
Female Time Production Male Time Production Time Consumption
0 20 40 60 80
0 2 4 6 8 Spain Age
Hours per da
y
Female Time Production Male Time Production Time Consumption
0 20 40 60 80
0 2 4 6 8 Germany Age
Hours per da
y
Female Time Production Male Time Production Time Consumption
0 20 40 60 80
0 2 4 6 8 France Age
Hours per da
y
Female Time Production Male Time Production Time Consumption
Source: own elaborations on MTUS data
of unpaid household production, regardless of whether it is gardening, chores, or other activities. The difference between profiles of consumption and production by age gives us a measure of the life cycle deficit/surplus of time production. Women tend to generate a surplus of time production, and transfer it to men, throughout most of the life cycle. The gap between women and men becomes small only late in the life cycle. For all the countries considered, the mean age at time production is slightly higher than the mean age at time consumption. This tends to indicate that overall time transfers flow from adults to children. However, our sample is limited to people who are 80 years old and younger. Therefore we may underestimate the flow from adults to the elderly.
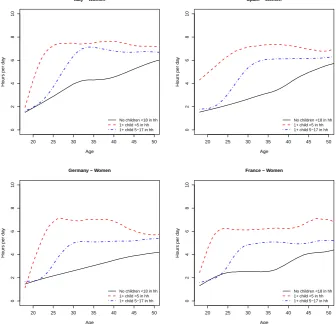
Figures 2 and 3 show our estimates of profiles of the time that women and men, respectively, dedicate to unpaid household production by age and by household structure. We construct profiles of time production for households with no children less than 18 years old, households with at least one child less than 5 years old, and households with at least one child who is 5-17 years old. The analysis is restricted to individuals who are between 18 and 50 years old because of data availability. For each sex and single year of age between 25 and 40, the sample size for households with co-resident children younger than 5 years old is quite large (from several tens to almost 200 observations). The sample size, however decreases quite rapidly for very young men and women, and for individuals in their 50s, for whom we have only a few diaries in each group.
Demographic Research: Volume 29, Article 35
Figure 2: Estimates of profiles of the time that women dedicate to unpaid
productive activities by age and household structure
20 25 30 35 40 45 50
0 2 4 6 8 10
Italy − Women
Age
Hours per da
y
No children <18 in hh 1+ child <5 in hh 1+ child 5−17 in hh
20 25 30 35 40 45 50
0 2 4 6 8 10
Spain − Women
Age
Hours per da
y
No children <18 in hh 1+ child <5 in hh 1+ child 5−17 in hh
20 25 30 35 40 45 50
0 2 4 6 8 10
Germany − Women
Age
Hours per da
y
No children <18 in hh 1+ child <5 in hh 1+ child 5−17 in hh
20 25 30 35 40 45 50
0 2 4 6 8 10
France − Women
Age
Hours per da
y
No children <18 in hh 1+ child <5 in hh 1+ child 5−17 in hh
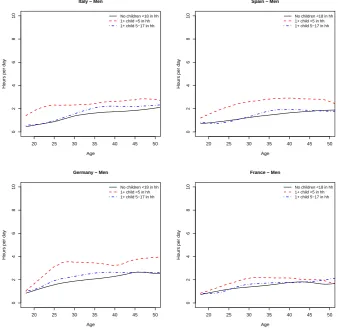
Figure 3: Estimates of profiles of the time that men dedicate to unpaid productive activities by age and household structure
20 25 30 35 40 45 50
0 2 4 6 8 10
Italy − Men
Age
Hours per da
y
No children <18 in hh 1+ child <5 in hh 1+ child 5−17 in hh
20 25 30 35 40 45 50
0 2 4 6 8 10
Spain − Men
Age
Hours per da
y
No children <18 in hh 1+ child <5 in hh 1+ child 5−17 in hh
20 25 30 35 40 45 50
0 2 4 6 8 10
Germany − Men
Age
Hours per da
y
No children <18 in hh 1+ child <5 in hh 1+ child 5−17 in hh
20 25 30 35 40 45 50
0 2 4 6 8 10
France − Men
Age
Hours per da
y
No children <18 in hh 1+ child <5 in hh 1+ child 5−17 in hh
Source: own elaborations on MTUS data
ana-Demographic Research: Volume 29, Article 35
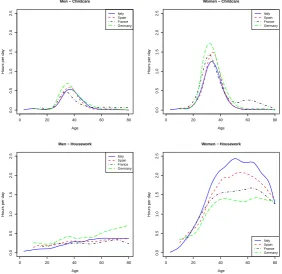
lyzed. In France, the time that young couples dedicate to childcare is lower, but the role of grandmothers is clearly visible from a bump in the age profile for women around age 60. In terms of housework, Italy and Germany are the two extremes. In Italy, women spend more time on housework than women in other countries virtually at all ages. In Germany, the opposite is true. At the same time, men in Italy have one of the lowest profiles of time dedicated to housework. Men in Germany spend more time doing housework than men in other countries, at all ages.
Figure 4: Estimates of profiles of the time that men and women, respectively,
dedicate on average to childcare and housework, by age
0 20 40 60 80
0.0 0.5 1.0 1.5 2.0 2.5
Men − Childcare
Age
Hours per da
y
Italy Spain France Germany
0 20 40 60 80
0.0 0.5 1.0 1.5 2.0 2.5
Women − Childcare
Age
Hours per da
y
Italy Spain France Germany
0 20 40 60 80
0.0 0.5 1.0 1.5 2.0 2.5
Men − Housework
Age
Hours per da
y
Italy Spain France Germany
0 20 40 60 80
0.0 0.5 1.0 1.5 2.0 2.5
Women − Housework
Age
Hours per da
y
Italy Spain France Germany
4.
Conclusions
Our results highlight the economic importance of unpaid productive activities. The time that women dedicate to domestic work is in the order of part-time jobs. Although time spent on unpaid activities decreases at older ages, it remains significantly high for the elderly. Thus, this article shows that there is a large quantity of household work pro-duced by women and the elderly that is invisible to national economic accounts. Previous research has provided evidence that intergenerational transfers within the family tend to flow downwards, from the elderly to younger generations. In this article, we showed that most of the time production, even at older ages, comes from women. The patterns of time production and consumption that we observed are fairly similar across countries, although there are differences in levels.
The work that we presented offers a preview of, and a motivation for, more exten-sive analyses that are underway within the National Transfer Accounts (NTA) project, a large and international collaborative endeavor to measure intergenerational transfers and evaluate their macroeconomic consequences. One of the goals of the NTA project is to monetize the value of time transfers and include it in standard economic accounts. Re-searchers within NTA will use the most detailed time use surveys available in order to evaluate profiles of time production and consumption. Then they will incorporate these estimates in standard (monetary) transfer accounts. The work that will be done within NTA will address one of the major limitations of the current study, that is the difficulty of separating activities that generate within-household time transfers from those that gen-erate between-household time transfers. In this article, we presented results mainly for intra-household transfers, since some information about inter-household transfers could not be isolated in the MTUS. More details about inter-household transfers can be extracted from the original (non-harmonized) diaries collected by national statistical offices. Here we presented a first picture of transfers of time by age and gender. The next steps in this line of research will be to expand the analysis of inter-household family transfers and to evaluate the monetary value of time transfers.
Demographic Research: Volume 29, Article 35
5.
Acknowledgements
References
Abraham, K.G. and Mackie, C. (eds.) (2005). Beyond the market: Designing nonmarket
accounts for the United States. Washington, D.C: National Academies Press. 2008. Anxo, D., Flood, L., Mencarini, L., Pailhé, A., Solaz, A., and Tanturri, M.L. (2007). Time
Allocation between Work and Family over the Life-Cycle: A Comparative Gender Analysis of Italy, France, Sweden and the United States. Bonn: Institute for the Study of Labor. (IZA Discussion Paper Series No. 3193).
Donehower, G. and Mejia-Guevara, I. (2013). Everybody works: Gender, age and
eco-nomic activity. Paper presented at the 2012 Meeting of the Population Association of America, San Francisco, May 3-5.
Friedman, J.H. (1984). A Variable Span Scatterplot Smoother. Laboratory for Computa-tional Statistics. Stanford University. (Stanford University Tech. Rep. No. 5).
Gershuny, J., Fisher, K., Altintas, E., Borkosky, A., Bortnik, A., Dosman, D., Fedick, C., Frederick, T., Gauthier, A.H., Jones, S., Jun, J., Lai, A., Lin, Q., Lu, T., Lui, F., MacRae, L., Monna, B., Nadal, J.I.G., Pauls, M., Pawlak, C., Shipley, A., Tinonin, C., Torres, N., Victorino, C., and Yeung, O. (released October 2012). Multinational time use study, versions world 5.5.3, 5.80 and 6.0. University of Oxford, United Kingdom: Centre for Time Use Research.
Mankiw, N.G. and Weil, D.N. (1989). The baby boom, the baby bust, and the housing
market. Regional Science and Urban Economics19(2): 235–258.
doi:10.1016/0166-0462(89)90005-7.
Reid, M.G. (1934).Economics of household production. New York: J. Wiley Sons.
Sambt, J. and Malacic, J. (2012). Intergenerational transfers in form of unpaid work in
Slovenia. Paper presented at the European Population Conference, Stockholm, Sweden, June 13-16.
Zagheni, E. (2011). The leverage of demographic dynamics on carbon dioxide emissions:
Does age structure matter? Demography48(1): 371–399.