QUALITY MEASUREMENTS
Application of Methylene Blue Adsorption
to Cotton Fiber Specific Surface Area Measurement:
Part I. Methodology
Chongrak Kaewprasit,* Eric Hequet, Noureddine Abidi, and Jean Paul Gourlot
INTERPRETIVE SUMMARY
Cotton fiber quality is important for all segments of the cotton industry. Specific fiber surface area is a physical characteristic that serves as a predictor of dyeing performance. The objective of this study was to establish a method for measuring the specific surface area of cotton fiber by using methylene blue adsorption in liquid phase. The term cotton fiber refers to cotton in the natural state, using no chemical treatment before analysis. These results will be used in the future to improve fiber quality measurements.
Specific surface area is defined as the accessible area of solid surface per unit mass of material. Because the surrounding phase can modify the surface area, each method that was studied for measuring surface had shortcomings. The interference by the surrounding phase was e s p e c i a l l y p r o b l e m a t i c a l f o r t h e N adsorption/desorption isotherm method in which case the entire surface was modified by vacuum-dried treatment before N adsorption. This method measures only the external and not the internal surface area.
The method of adsorption of methylene blue in liquid phase for specific surface area determination has been adopted widely for various natural solids: activated carbon, charcoal, graphite, and silica, for example.
Experiments were conducted to use methylene blue adsorption to measure the specific surface area of six International Calibration Cotton Standard
fibers. The ICCS fibers used were B-26, C-36, D-5, E-4, G-17, and I-26. Before treatment, all fibers were conditioned at 21±1°C with 65±2% relative humidity for at least 24 hours. In order to ascertain the conditions for the adsorption isotherm, an adsorption kinetic study was conducted first. In these experiments, both the concentration and adsorption isotherm were determined for each type of cotton. The values of specific surface areas of six types of cotton fiber were calculated from four replications. The range of values of specific fiber surface for the six types of cotton fiber was between 30 and 55 x 10-3 km2 kg-1.
The reliability of this method also was studied by using microcrystalline cellulose. This cellulose behaves like a divided solid that shows high homogeneity. From the results, the experimentally determined adsorption isotherm of microcrystalline cellulose agrees quite well with theory, showing a high value of determination coefficient (R² = 98.5). It is shown that the reliability of the method is very good. Likewise, it is demonstrated that mechanical preparation of cotton fiber is important for obtaining the true specific surface area. The cotton fiber should be well separated by mechanical carding.
The method of methylene blue adsorption for measuring the specific surface area of cotton fiber, as established here, can provide a common reference method for cotton fiber characterization in quality control, much like other mechanical properties.
ABSTRACT
Adsorption of methylene blue or 3,7 bis (dimethylamino) phenothiazin-5-ium ion was used to measure the specific surface areas of six cotton fibers taken from the International Calibration Cotton Standards. A kinetic study of this dye’s adsorption to the cotton fibers was first conducted to establish the
adsorption isotherms. From this study, the adsorption isotherm was determined at 25°C for 24 hours with the concentration of methylene blue
solution in the range 0.004 to 0.18 x 10⁻³
kg L-1
. After 24 hours, the concentration of methylene blue at the adsorption equilibrium was analyzed by a spectrophotometer at a wavelength of 660 nm. The specific surface area was then calculated from this isotherm. The specific surface areas for these cottons, B-26, C-36, D-5, E-4, G-17, and I-26 were found to be
32.32, 32.42, 34.48, 52.72, 43.96, and 29.91 x 10⁻³
km2
kg-1, respectively. The reliability of this method seems
very good.
F
iber quality is a major concern for all segments of the cotton industry. Although physical characteristics serve as predictors of performance, the interpretation of measurements is not usually used to correlate fiber quality with results from processing. Specific surface area is one of the physical characteristics that is important for dyeing characteristics. The specific surface area is defined as the accessible area of solid surface per unit mass of material. Various methods are used to determine specific surface area such as: moisture adsorption (Assaf et al., 1944), N adsorption (Assaf et al., 1944; Merchant, 1957), nuclear magnetic resonance (Froix and Nelson, 1975) and liquid chromatography (Ladisch et al., 1992). Because the surrounding phase modifies the surface area, each method has inherent sources of error.The N adsorption/desorption (physisorption) isotherm is one of the most important and extensively used methods for determining specific surface area of a material. In the case of cotton fibers, N sorption measurements show that the surface area of dry cotton is in the range 0.6 to 1.0 x 10⁻³ km2 kg-1 (Blair and McElroy, 1976; Rowen
and Blaine, 1947). This value of specific surface area is attributed mainly to external surface. However, the internal surface of cotton fibers is also important for dyeing and it must be measured too. Thus, it is necessary to find a method that allows the measurement of the total surface of cotton fiber. Adsorption of methylene blue for specific surface area determinations has been widely adopted for solids of variable nature such as oxides, graphite, yeast, activated carbons, calcium carbonate, etc. (Pakhovchishin et al., 1991; Graham, 1955; Puri et al., 1979; De et al., 1974; Handreck and Smith, 1988; Savitsky et al., 1981; Kaoua et al.,
1987; Tanada et al., 1980). This method has also been used to assess pore size and distribution in the transitional pore range for charcoals, silica, and alumina (Giles and De Silva, 1969). Davidson established the conditions for determinations made with methylene blue (1947).
In the present work, the method of methylene blue adsorption in liquid phase was proposed to measure the specific surface area of cotton fibers. The objective was to estimate the specific surface area of raw cotton to compare, in the future, with the surface area determined by air flow, for example, and to correlate measurements with fiber characteristics such as fineness, maturity, tenacity, etc. To achieve this objective, wax was not removed from the fiber before the analysis because its surface would have been modified by this chemical treatment.
To establish the adsorption isotherms of methylene blue on cotton fiber, a kinetic study was conducted. Cotton fibers with various mechanical properties were measured for specific surface areas. The effects of different preparations and treatment temperatures on cotton fiber before adsorption were examined. Microcrystalline cellulose was chosen in this study as a reference material to compare with cotton fibers and for demonstrating the reliability of this method.
MATERIALS
Methylene Blue
Methylene blue was chosen in this study because of its known strong adsorption onto solids and its recognized usefulness in characterizing adsorptive material (Froix and Nelson, 1975; Barton, 1987). Methylene blue (Ardizzone et al., 1993) has a molecular weight of 373.9 x 10⁻³ kg
mol-1, which corresponds to methylene blue
hydrochloride with three groups of water. The structure of this dye is shown in Fig. 1.
Cotton Fibers
Fig. 1. Structure of methylene blue.
conditioned at 21±1°C with 65±2% of relative humidity for at least 24 hours (same standardized conditions used for measurement of other fiber characteristics). Because the mechanical preparation of cotton fibers can affect the value of the specific surface area, different types of cotton fiber preparations for cotton C-36 and B-26 were studied. These preparations included: (i) fibers opened by hand (raw cotton), (ii) fibers carded for one time, (iii) fibers carded for three times, and (iv) fibers drawn after carding for three times.
In addition, we studied the effect of treating cotton fibers at different temperatures prior to making the adsorption determination of the specific surface area value. This was done by drying cotton C-36 at 60°C for 2 hours before exposing it to methylene blue adsorption. Comparisons were made between cotton dried at 60°C and that merely conditioned at 21±1°C with 65±2% relative humidity for 24 hours.
Microcrystalline cellulose was chosen in this study as a reference for specific surface area measurements of cotton fiber. This kind of cellulose is a purified, partially depolymerized cellulose that occurs as a white, odorless, tasteless, crystalline powder composed of porous particles.
Microcrystalline cellulose may be prepared by spray-drying powdered wood cellulose that has been hydrolyzed in hydrochloric acid solution and washed in water (Wade and Weller, 1994, p. 84-87; Nakai et al., 1977). It is widely used in pharmaceuticals primarily as a diluent in oral tablet and capsule formulations. It is also used in cosmetics and food products. As in the case of cotton fibers, microcrystalline cellulose was conditioned at 21±1°C with 65±2% relative humidity during for 24 hours before exposing it to methylene blue.
METHODOLOGY
Determination of Methylene Blue Concentration in Solution
Methylene blue (purchased from Carlo Elba) was dried at 110°C for 2 hours before use. All of the methylene blue solution was prepared with distilled water. The concentrations of methylene blue solutions were analyzed by measuring their absorbance at 660 nm on a Pye Unicam spectrophotometer. This wavelength corresponds to the maximum absorption peak of the methylene blue monomer (Bergman and O’Konski , 1963; Davidson, 1947).
A calibration curve of optical densities against methylene blue concentrations was obtained by using standard methylene blue solutions of known concentrations at pH values between 7.5 and 8. The experimental data reported in Fig. 2 were fitted by a straight line with a high determination coefficient (R² = 99.8). The high value of the determination
Table 1. Mechanical properties of the six International Cotton Calibration Standards (ICCS) studied as reference values from ICCS along with maturity and fineness values measured at Centre de Coopération Internationale en Recherche Agronomique pour le Développement (CIRAD) in France.
Cottons
B-26 C-36 D-5 E-4 G-17 I-26
Reference values (ICCS)
Micronaire 4.45 3.48 3.75 3.09 2.7 4.97
Strength, kN m kg-1 (g/Tex)
168 (17.1)
216 (22)
321 (32.7)
297 (30.3)
174 (17.7)
187 (19.1)
2.5% span length, mm 24.64 28.96 33.78 33.53 24.38 27.18
50% span length, mm 11.94 13.97 15.49 14.99 11.43 12.95
50/2.5 % span length ratio 48 48 46 45 47 48
Measured values (CIRAD)
Maturity ratio 0.81 0.8 0.84 0.88 0.63 0.85
Mature fiber, % 72.2 71.4 74.8 78.6 54.5 75.4
Fig.2. Calibration curve of absorbance against concentration of methylene blue.
Fig. 3. Kinetic curve for adsorption of methylene blue onto fibers of cotton C-36 conditioned at 21±1°C with 65±2% relative humidity.
coefficient of the calibration line observed in the present study allows us to consider that the molar extinction coefficient is constant over theconcentration range investigated. Thus, the methylene blue concentration will be determined with good precision. The molar extinction coefficient value obtained from the slope is 4.6 x 10⁻⁴ ; this value lies in the broad range reported in
the literature, (3.9–9.5) x 10-4 (Bergman and
O’Konski, 1963). We found that there was negligible methylene blue adsorption on the glassware. This was shown by the fact that the experimental readings were found to be constant with time (up to 180 min). Replication measurements performed over a long time (months) on fresh solutions prepared from the same initial mother solution yielded perfectly coincident data.
Adsorption of Methylene Blue
First of all, an adsorption kinetic study was carried out to find the equilibrium time. This time was determined by a series of measurements extending from 2 to 72 hours at 25°C on cotton C-36. In the presence of the solid, adsorbing solutions reached complete equilibrium in about 24 hours (Fig. 3). This curve shows adsorption of methylene blue in grams per gram of cotton C-36 as a function of time. We note that the curve seems to reach a plateau after 24 hours of adsorption. Therefore, we suppose that the adsorption of methylene blue onto cotton fibers has reached its maximum capacity. Consequently, this time was chosen to measure the isotherm adsorption of all samples.
Adsorption measurements for all samples were carried out as follows: 2 g of cotton were put in 250 mL of methylene blue solution of known
concentration. The mixture was agitated by a stirring rod until the cotton fiber was submerged in the dye solution. This mixture was maintained at 25°C and continuously shaken at 180 rpm for 24 hours. After 24 hours, the methylene blue uptake onto cotton fibers was calculated from the difference between the methylene blue concentration before and after adsorption onto the cotton fibers. For obtaining an adsorption isotherm, the concentration of methylene blue used was in the range 0.004 to 0.18 x 10⁻³ kg L-1 (0.00001–0.00048
mol L-l). Four replications were carried out for each
type of cotton studied.
RESULTS AND DISCUSSION
Specific Surface Area Determination
Fig. 4. Typical adsorption isotherms for methylene blue onto fibers at 25°C for fibers of cottons C-36, E-4, and I-26, respectively.
Fig. 5. Schematic model of methylene blue and cotton fiber interaction.
Y = K C
(1 + K C )
C
N C
N m
1
K N m
= +
in concentration of methylene blue will not increase the amount of methylene blue on fibers. In the case of cotton fiber, we observed that when the equilibrium concentration of methylene blue is more than 0.0003 mol L-1, there is a decrease of
methylene blue adsorption in kg kg-1. This may be
due to the desorption of the methylene blue molecule.
A schematic of the interaction between the methylene blue molecule and cotton fiber surface is shown in Fig. 5. We assume that there is a complete adsorption of methylene blue as a monolayer onto the surface of cotton fibers as shown by the plateau of the adsorption isotherm.
The Langmuir equation was used to calculate the specific surface area of the cotton fiber. The general form of Langmuir isotherm is:
where Y is the
fraction of cotton fiber surface covered by adsorbed methylene blue molecules, K is a constant, and C is the equilibrium methylene blue solution concentration. In our case, Y = N/Nm , where N
represents the number of moles of methylene blue adsorbed per gram of cotton at equilibrium concentration, C, and Nm is the number of moles of
methylene blue per gram of cotton required to form a monolayer. After making the substitution and rearranging Eq. [1], we obtain :
For all adsorption isotherms of methylene blue onto cotton fiber, the plot of C/N vs. C gives a straight line with slope equal to 1/Nm, and intercept
equal to 1/KNm. Therefore, the Langmuir isotherm
is an adequate description of the adsorption of the methylene blue onto cotton fibers.
The specific surface area was calculated by the following equation (Gregg and Sing, 1982):
[1]
Fig. 6. Alignment of cotton fibers in: (a) wet state (b) the presence of methylene blue solution, (c) dried state.
S
N a N 1 0
M
M B
g M B
2 0
=
×
×
×
−
where SMB is the specific surface area in 10
-3 km2 kg-1;
Ng is the number of molecules of methylene blue
adsorbed at the monolayer of fibers in kg kg-1 (or N g
= Nm*M); aMB is the occupied surface area of one
molecule of methylene blue =197.2 Ų (Graham, 1955) ; N is Avogadro’s number, 6.02 x 10²³ mol-1
; and M is the molecular weight of methylene blue, 373.9 g mol-1.
The quantity of methylene blue adsorbed at the monolayer and specific surface areas of the six standard cottons are shown in Table 2. We observe that cotton E-4 gives the highest value for specific surface area, 52.72 x 10⁻³ km2 kg-1, cotton I-26 gives
the lowest, 29.91 x 10⁻³ km2 kg-1, and cottons B-26,
C-36, D-5, and G-17 have specific surface areas in the range of I-26 and E-4. These standard cottons also have different mechanical properties. Consequently, we will try to find out the relationship between these values and their mechanical properties in the future (Kaewprasit et al., to be published elsewhere).
It is important to compare the specific surface area obtained by adsorption of methylene blue and by N adsorption in gaseous phase (Brunauer, Emmett, Teller technique). In this case, cotton C-36 gives the specific surface area of 1.0 x 10⁻³ km2 kg-1
by N adsorption (Kaewprasit, 1997). This value agrees well with previous studies (Blair and McElroy, 1976; Rowen and Blaine, 1947). However, we found 32.42 x 10⁻³ km2 kg-1 for the
same cotton fibers by adsorption of methylene blue. The discrepancy in the values may be explained as follows. In aqueous solution of methylene blue, water is the vehicle for methylene blue; it carries the dye to the fibers in the wet state. Methylene
blue molecules have more ability to associate with cotton fibers. This mechanism can be explained by the fact that there are cellulose–HOH–cellulose linkages in the wet state (Fig. 6a) which are easily broken and replaced by methylene blue molecules (Fig.6b). In addition, the fibers are swollen in water and, therefore, all pores of cotton fibers are opened. Consequently, surface area is available for methylene blue molecules. In contrast, the dehydration of cotton fibers by vacuum drying at 85°C and 1.1 x 10⁻² torr (conditions of sample
preparation before the N adsorption) promotes formation of interchain hydrogen linkages or cellulose-cellulose linkages (Fig. 6c) which are too
Table 2. Measurements of the number of molecules of methylene blue adsorbed to the monolayer of fibers (Ng), and the specific surface areas determined by
methylene blue adsorption (SMB), for the six ICCS
cottons.
Cottons Ng 10
-3 kg kg-1
SMB 10 -3
km2 kg-1
B-26 0.01019 32.32 C-36 0.01022 32.42 D-5 0.01087 34.48 E-4 0.01662 52.72 G-17 0.01386 43.96 I-26 0.00943 29.91
Fig. 7. Schematic cross section of cotton fibers showing dehydration and swelling processes.
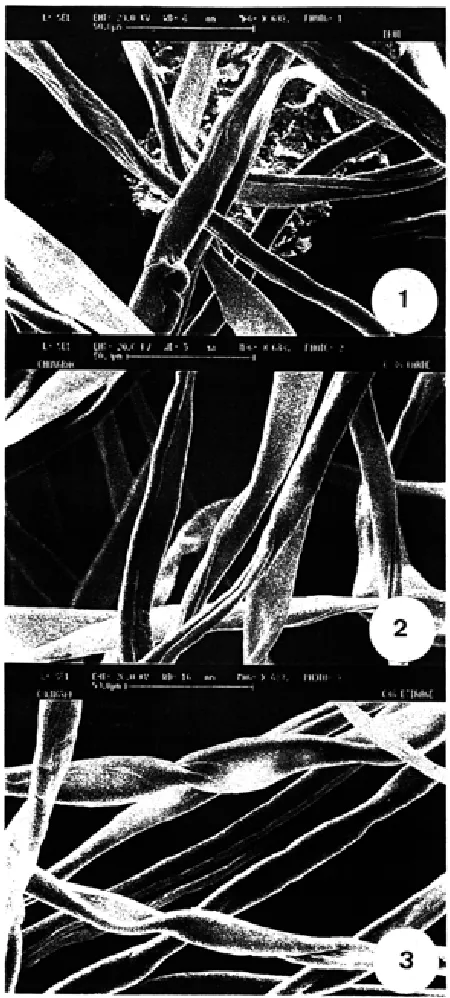
Fig. 8. Scanning electron micrographs of raw (1), carded (2), and drawn (3) fibers of cotton C-36.
strong to be replaced by N molecules. At the same time, all the pores are closed in the vacuum-dried state. Therefore, only the external surface of cotton fibers was measured. The schematic in Figure 7 shows a cross-section of the dehydration-swelling process of cotton fibers in either the wet or dried state, as described previously.
Effect of Different Preparations on Cotton Fiber Specific Surface Area
The processing of cotton fibers such as opening by hand, carding, or drawing are carried out to eliminate seed coat fragments or other impurities and to individualize or straighten out the fibers. From this work, it is shown that these preparations affect the specific surface area as shown in Table 3. We found that the carding of cotton fibers, either C-36 or B-26, gave a larger surface area than the other means of preparation. However, the drawing of cotton fibers results in lower surface areas. There is no direct evidence for this finding from the scanning electron micrographs for the different preparations of cotton fibers as shown in Fig. 8. This discrepancy can be explained by the fact that
the fibers are better separated in the case of carded cotton fibers. This situation increases the accessibility to the bulk dye. Therefore, the methylene blue molecules can easily diffuse through the fibers. On the other hand, the drawn cotton fibers are more parallel and very tight to each other. The methylene blue molecules diffuse more slowly through the fibers.
Table 3. The effect of different sample preparations on measurements of the number of molecules of methylene blue adsorbed to the monolayer of fibers (Ng), and of
the specific surface areas determined by methylene blue adsorption (SMB), for fibers of B-26 and C-36
conditioned at 21±1°C with 65±2% relative humidity.
Cotton preparation Ng 10
-3 kg kg-1
SMB 10 -3
km2 kg-1
B-26 C-36 B-26 C-36
Raw 0.01019 0.01022 32.32 32.42
Carded 1 time 0.01057 0.01411 33.53 44.75
Carded 3 times 0.00993 0.01348 31.50 42.76
Fig. 9. Effect of different treatment temperatures on specific surface area of fibers of cotton C-36.
Fig.10. Adsorption isotherm over 24 hours for microcrystalline cellulose at 25°C.
Effect of Treatment Temperature on Cotton Fiber Specific Surface Area
The other parameter that could induce modification on the specific surface area is the temperature at which cotton fibers are treated before exposing them to methylene blue. For cotton C-36, we found that drying cotton fibers at 60°C for 2 hours gave higher surface area values than when they were conditioned at 21±1°C with 65±2% relative humidity (Fig. 9). Similar results were obtained for all of the different preparations as shown in Table 4, possibly because of the greater surface area of the dried cotton fibers. Dried cotton has less adsorbed water at the surface than cotton conditioned at 21±1°C with 65±2% relative humidity which is around 6 to 8% (Kaewprasit, 1997).
Microcrystalline Cellulose Specific Surface Area Determination
Assuming that microcrystalline cellulose acts as a divided solid, we used it to study the reliability of this method. The adsorption isotherm obtained for microcrystalline cellulose is shown in Fig. 10. From this adsorption isotherm, we found that the experimental points (28 points, four replications) correspond very well to the calculated curve with the determination coefficient, R², equal to 98.5.
The specific surface area of microcrystalline cellulose measured by this method, is 13.4 x 10⁻³
km2 kg-1. This value is close to that obtained by
Delalande (1998) who tried to apply the method of methylene blue adsorption for various types of microcrystalline cellulose. This value (13.4 x 10⁻³
km2 kg-1) also corresponds to that measured by
Marshall and Sixsmith (1974) by various methods. Compared to surface area values obtained for cotton fibers, the value for microcrystalline cellulose is
very low. Microcrystalline cellulose does not swell in water the way cotton fibers do.
CONCLUSION
The adsorption of methylene blue allows the determination of the specific surface area of natural cotton fibers. This work has shown that the method is simple and requires less elaborate apparatus and time than other methods. In addition, both the sensitivity and precision, which we determined by studying different methods of cotton fiber preparation and treatment temperatures, are good. Using this technique, we have shown that different types of cotton fibers have different specific surface areas. Consequently, this finding makes it possible to use specific surface area measurements directly as a characteristic in quality control, much like other mechanical properties of fiber are used.
Further work is proceeding on the study of the physical characteristics of these six cottons to obtain more information about the variation of the
Table 4. The effect of different treatment temperatures and different sample preparations on the specific surface areas determined by methylene blue adsorption (SMB),
for cotton fibers of C-36.
SMB 10 -3 km2 kg-1
Cotton preparation Dried at 60°C at 21±1°C, 65±2%R.H.
Raw 66.54 32.42
Carded 1 time 76.47 44.75
Carded 3 times 74.61 42.76
specific surface area. We will also try to relate these results to the physical characteristics such as moisture percentage, x-ray analysis of fiber structure, etc. for each cotton.
REFERENCES
Ardizzone, S., G. Gabrielli, and P. Lazzari. 1993. Adsorption of methylene blue at solid/liquid and water/air interfaces. Colloids Surfaces76:149–157.
Assaf, A.G., R.H. Haas, and C.B. Purves. 1944. A new interpretation of the cellulose-water adsorption isotherm and data concerning the effect of swelling and drying on the colloidal surface of cellulose. J. Am. Chem. Soc. 66:66–73.
Barton, S.S. 1987. The adsorption of methylene blue by active carbon. Carbon 25:343–350.
Bergmann, K., and C.T. O’Konski. 1963. A spectroscopic study of methylene blue monomer, dimer and montmorillonite. J. Phys. Chem. 67:2169–2177.
Blair, H.S., and M.J. McElroy. 1976. The dying of secondary cellulose acetate. Investigation of the surfaces of dyed fibres by low-temperature nitrogen adsorption. J. Appl. Polym. Sci. 20:2955–2967.
Davidson, G.F. 1947. Determination of methylene blue. J. Textile Inst. 38:T408–T418.
De, D.K., J.L. Kanungo, and S.K. Chakravart. 1974. Adsorption of methylene blue, crystal violet and malachite green on bentonite, vermiculite, kaolinite, asbestos and feldspar. Indian J. Chem. 12:1187–1189.
Delalande, M. 1998. Ph.D. thesis. University of Montpellier II, Montpellier, France.
Froix, M.F., and R. Nelson. 1975. The interaction of water with cellulose from nuclear magnetic resonance relaxation times. Macromolecules 8:726–730.
Giles, C.H., and A.P. De Silva. 1969. Molecular sieve effects of powders towards dyes. Measurement of porosity by dye adsorption. Trans. Faraday Soc. 65:1943–1951.
Giles, C.H., T.H. MacEwan, S.N. Nakhva , and D. Smith. 1960. Adsorption. XI. A system of classification of solution adsorption isotherms, and its use in diagnosis of adsorption mechanisms and in measurement of specific surface areas of solids. J. Chem. Soc. 56:3973–3993.
Graham, D. 1955. Characterization of physical adsorption systems. III. The separate effects of pore size and surface acidity upon the adsorbent capacities of activated carbons. J. Phys. Chem. 59:896–900.
Gregg, S.J., and K.S.W. Sing. 1982. The physical adsorption of gases by nonporous solids: The type II isotherm. p. 41–110. In Adsorption, surface area and porosity. Academic Press, London.
Handreck, G.P., and T.D. Smith. 1988. Adsorption of methylene blue from aqueous solution by ZMS-5-type zeolite and related silica polymorphs. J. Chem. Soc. Faraday Trans. I 84:4191–4201.
Kaewprasit, C. 1997. The contribution of cotton fibre specific surface area estimation; relation between surface area and physical properties. Ph.D. thesis. University of Montpellier II, Montpellier, France.
Kaoua, F., A. Gaid, H. Ait-Amar, and A. Tazairt. 1987. Cinétique d’adsorption du bleu de methylene sur différents types d’argile kaolinitique. Bull. Soc. Chim. France 4:581–588.
Ladisch, C.M., Y. Yang, A. Velayudhan, and M.R. Ladisch. 1992. A new approach to thestudy of textile properties with liquid chromatography. Textile Res. J. 62:361–369.
Marshall, K., and D. Sixsmith. 1974. Some physical characteristics of micro-crystalline cellulose. Drug Develop. Commun. 1:51–71.
Merchant, M.V. 1957. A study of water swollen cellulose fibers which have been liquid/exchanged and dried from hydrocarbons. TAPPI 40:771–781.
Nakai, Y., E. Fukuoka, S. Nakajima, and J. Hasegawa. 1977. Crystallinity and physical characteristics of microcrystalline cellulose. Chem. Pharm. Bull. 25:96–101.
Pakhovchishin, S.V., I.G.F. Chernydh, and V.F. Gritsenko. 1991. Limitations on the use of the indicator method to study the surface of graphite particules. Kolloid Zn. 53:284–289. (Translated in English.)
Puri, B.R. , V.M. Arora, and D.D.T. Singh. 1979.Adsorption of dyes for estimating micropore and transitional pore surface areas of active carbons. Indian J. Technol. 17:16–19.
Rowen, J.W., and R.L. Blaine. 1947. Sorption of nitrogen and water vapor on textile fibers. Ind. Eng. Chem. 39:1659–1663.
Savitsky, A.C., B.H. Wiers, and R.H. Wendt. 1981. Adsorption of organo-compounds from dilute aqueous solution onto the external surface of type A zeolite. J. Environ. Sci. Technol. 15:1191–1196.