Revisiting Energy-GDP Nexus for the Selected
Countries of the Middle East Region
Eisa Maboudian Khashayar Seyyed Shokri
Received: 2014/10/05 Accepted: 2014/12/19
Abstract
his paper investigates the relationship between total energy consumption and GDP in six countries of the Middle East , including Iran,Pakistan,Saudi Arabia,Oman,Bahrain and the United Arab Emirates. The data are annual and spanning the period 1980-2012.We employed Hsiao’s (1981) methodology to examine causality relation between total energy consumption and GDP.The empirical findings show a unidirectional causality relation between total energy consumption and GDP for Iran running from energy to GDP,and supports the growth hypothesis for Iran. For Saudi Arabia there is a unidirectional causality running from GDP to total energy consumption. Therefore we can accept conservation hypothesis about Saudi Arabia.There is bidirectional causality relation for other countries which support the feedback hypothesis about them.
Keywords: Energy consumption, GDP, Middle East, Causality relation
1- Introduction
Middle East region is well-known to export energy (oil and gas) in the world. Middle East counties have more than 800 billion barrels of proved reserves of oil. (Saudi Arabia(265.9), Iran(157), Kuwait(101.5), Qatar(25),
Oman(5.5), Bahrain (0.125), UAE(97.8))1. Moreover this region has more
than 2823 trillion cubic feet of gas (Iran and Qatar have largest gas proved
reserves with about 1187 and 890 trillion cubic feet respectively)1. Although
these figures can be different because of different statistical sources and also exploration of new oil fields in the future. Many of these states are
M.A. of Economics, Islamic Azad University, Central Tehran Branch (Corresponding Author).
Assistant Professor; Islamic Azad University, Central Tehran Branch.
1- Source: BP Statistical Review of world Energy (2014) and US Energy Information Administration.
dependent economy and their economies are vulnerable to the energy shocks and oil price. In this region hormuz strait is one of the most important energy transit canals in the world. These issues have made many international political, cultural, environmental, social and economical challenges (such as Dutch disease) for this region. The main goal of this paper is to examine total energy consumption-GDP relation for six selected countries of the Middle East. This issue is an ongoing debate in the energy economics literature. In this context we confront with four different hypotheses: neutrality hypothesis, feedback hypothesis, growth hypothesis and conservation hypothesis.
Neutrality hypothesis indicates no causality between energy consumption and economic growth in any directions. Conservation hypothesis indicates a unidirectional causality running from economic growth to energy consumption. Growth hypothesis indicates a unidirectional causality running from energy consumption to economic growth. Feedback hypothesis indicates a bidirectional causality between economic growth and energy consumption. Each hypothesis has its own importance in policy implications (Wei Zhang and Shuyun Yang, 2013 ).
Contribution of this paper to the past literature is employing Hsiao’s (1981) methodology. The remainder of this paper is organized as follows. In section2 we review some of the past studies and their results.In section3 we introduce the data and methodology. In section4 we obtain empirical results and analyze them and in the last section we add up the results.
2- Review of literature
Cheng (1995) used a bivariate analysis and found no causality between energy use and GNP in the USA in either direction. Using a multivariate analysis, he also found no causal relationship between energy use and GNP. Asafu-Adjaye (2000) tested the causal relationship between energy use and income in four Asian countries using the cointegration and error-correction analysis. He found that causality ran from energy to income in India and Indonesia, and also showed a bi-directional causality in Thailand and the Philippines.
Soytas and Sari (2003) studied causality between energy consumption and GDP for the G-7 countries and for the top 10 emerging economies excluding China. They found bi-directional causality for Argentina, unidirectional causality from GDP to energy consumption in Italy and Korea, and unidirectional causality from energy consumption to GDP in Turkey, France, Germany and Japan. Mehrara (2007) examined the causal relationship between the per capita energy consumption (PCEC) and the per capita GDP in a panel of 11 oil-exporting countries (Iran, Kuwait, Saudi Arabia, United Arab Emirates, Bahrain, Oman, Algeria, Nigeria, Mexico, Venezuela and Ecuador) by using panel unit root tests and panel cointegration analysis. The results showed a unidirectional strong causality from economic growth to energy consumption for the oil-exporting countries. Mahmoud A. Al-Iriani (2006) investigated the causality relationship between GDP and energy consumption in the six countries of the Gulf Cooperation Council (GCC). Empirical results indicate a unidirectional causality running from GDP to energy consumption. Evidence shows no support for the hypothesis that energy consumption is the source of GDP growth in the GCC countries. Reynolds and Kolodziej (2008)examined the relationship between GDP and production of some energy sources for the former Soviet Union by Granger causality and found unidirectional causality from energy consumption to GDP and unidirectional causality from GDP to coal production and natural gas.Behmiri and Manso(2012) analyzed the relationship between oil consumption and economic growth for OECD countries and found that there is bi-directional causality between them.
3- Data and Methodology
because of nonstationary variables (see Hondroyianais et al, 2002 ; Fatai et al, 2002; Wolde-Rufael, 2004; Lee, 2006),and many of them employed vector error correction model(see Mahmoud A. Al-Iriani , 2006; Asafu-Adjaye, 2000; Lise and Montfort, 2007; Yoo, 2005; Glasure, 2002).In this paper we examine the relationship of total energy consumption(TEC hereafter) and gross domestic product (Y hereafter). The data were obtained from world development indicators 2013, published by the world bank. Total energy consumption is in quadrillion Btu and gross domestic price is in constant price and local currency. All data are annual and spanning the period 1980-2012. All variables used are in natural logharitm. In this step we must identify integration order of variables. To this end we employ KPSS unit root test which proposed by Kwiatkowski, Phillips, Schmidt and Shin (1990).Table1 shows the results.
Table1: KPSS Unit Root Test Results
*C and T indicate intercept and time trend respectively. **C.V indicates critical value.
Variable LM-stat. (C.V)** 5% (C.V) 1%
IRAN
LnY(C,T)* 0.1562 0.146 0.216
LnTEC (C,T) 0.074 0.146 0.216
UNITED ARAB EMIRATES
LnY(C,T) 0.138 0.146 0.216
LnTEC(C,T) 0.147 0.146 0.216
BAHRAIN
LnY(C,T) 0.117 0.146 0.216
LnTEC(C,T) 0.09 0.146 0.216
SAUDI ARABIA
LnY(C,T) 0.172 0.146 0.216
LnTEC(C,T) 0.086 0.146 0.216
OMAN
LnY(C,T) 0.177 0.146 0.216
LnTEC(C,T) 0.100 0.146 0.216
PAKISTAN
LnY(C,T) 0.155 0.146 0.216
According to the results all variables are stationary at 5% and 1% significance level, therefore we can use conventional granger causality test. We included a constant and a time trend for variables because time trend and constant were statistically significance. Because all the variables are in levels, the results can provide the information about the long-run causal relationship among variables in the model. Thanks to the stationary variables we can use conventional granger causality test. The variable X is said not to granger cause the variable Y if all the coefficients of lagged X in are not significantly different from zero (Equation 1), because it implies that the history of X doesn’t improve the prediction of Y. And conversely the variable Y is said not to granger cause the variable X if all the coefficients of lagged Y in are not significantly different from zero (Equation 2).
m jn
i i t i t j
t j
t
Y
X
Y
1
1
(1)
n im
j j t j t i
t i
t
X
Y
v
X
1
1
(2)
can judge about causality. If calculated FPE in the second equation or in the second step be smaller than first equation’s FPE we can say there is a causality relation which runs from new added variable (for example LnTEC) to the first variable (for example LnY). We employ the same procedure for other variables. Some of the past researchers employed this approach to
investigate energy consumption-GDP relationship (see Hao-Yen
Yang(2000), for Taiwan; Galip Altinay and Erdal Karagol(2004), for Turkey).In this study we included only six countries of the Middle East for investigation because the data in many of other countries were not I(0) or stationary at the level, therefore we can not use conventional granger causality test about them.
T m RSS m T m T m FPE Y L Y L mj j n t j t t n ) ( 1 1 ) 0 , ( ,
1
(3)
m j ni i n t i t j
t n j t
nY L Y L X v
L
1
1
T n m RSS n m T n m T n mFPE ( , )
1 1 ) , (
(4)
ni j n t i t t
nX L X e
L 1
(5)
n i t mj j n t j i
t n j t
nX L X LY
L
1
1
(6)
4- Empirical results
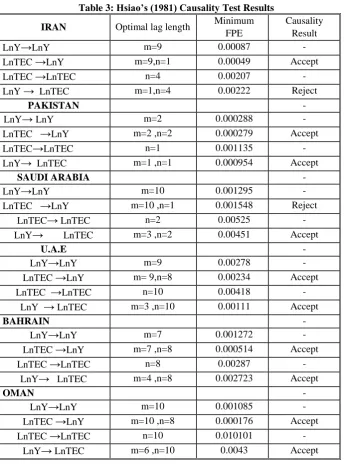
hypothesis.Table3 displays the results for other countries.In this table m is the number of appropriate lags for GDP and n is number of appropriate lags for total energy consumption(TEC).According to the results we have bidirectional causality effect for all countries except Saudi Arabia and Iran.Therefore for these countries(Oman,Bahrain,Pakistan and the United Arab Emirates)a high level of economic growth leads to high level of energy demand and vice versa.There is a unidirectional causality effect for Saudi Arabia running from GDP to total energy consumption, and supports the conservation hypothesis. In another words energy conservation policies would not be harmful for economic growth. There is a unidirectional causality effect for Iran running from energy consumption to GDP which supports the growth hypothesis.Therefore policies on energy conservation may negatively affect economic growth. These results support the findings of Masih and Masih(1996) for Pakistan.But for Iran the results don’t support the empirical findings of Gudarzi and Soheli Ghasemi(2012). According to their findings there is unidirectional granger causality running from GDP to energy consumption and energy saving would not harm economic growth in Iran. The results for Saudi Arabia support the findings of Mahmoud A. Al-Iriani (2006).But for UAE,Oman and Bahrain the results are not consistent with his empirical findings. His findings indicate a unidirectional causality running from GDP to energy consumption. The difference of the results with some of previous studies may be attributed to the new method proposed by Hsiao(1981) and also period of study.
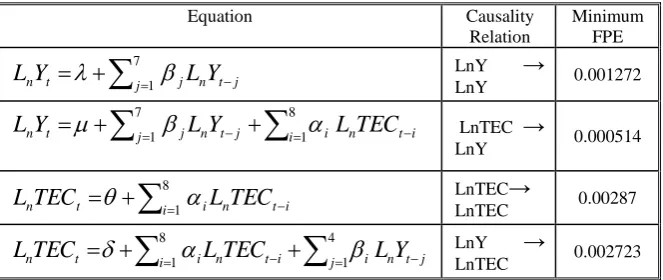
Table 2: Total Energy Consumption and GDP Causality Results for Bahrain
Equation Causality
Relation
Minimum FPE
7
1
j j n t j t
nY L Y
L
LnY →LnY 0.001272
7
1
8 1
j j n t j i i n t i t
nY L Y LTEC
L
LnTEC →LnY 0.000514
8
1
i i n t i t
nTEC LTEC
L
LnTEC→LnTEC 0.00287
8
1
4 1
i i n t i j i n t j t
nTEC LTEC LY
L
LnY →Table 3: Hsiao’s (1981) Causality Test Results IRAN Optimal lag length Minimum
FPE
Causality Result
LnY→LnY m=9 0.00087 -
LnTEC →LnY m=9,n=1 0.00049 Accept
LnTEC →LnTEC n=4 0.00207 -
LnY → LnTEC m=1,n=4 0.00222 Reject
PAKISTAN -
LnY→ LnY m=2 0.000288 -
LnTEC →LnY m=2 ,n=2 0.000279 Accept
LnTEC→LnTEC n=1 0.001135 -
LnY→ LnTEC m=1 ,n=1 0.000954 Accept
SAUDI ARABIA -
LnY→LnY m=10 0.001295 -
LnTEC →LnY m=10 ,n=1 0.001548 Reject
LnTEC→ LnTEC n=2 0.00525 -
LnY→ LnTEC m=3 ,n=2 0.00451 Accept
U.A.E -
LnY→LnY m=9 0.00278 -
LnTEC →LnY m= 9,n=8 0.00234 Accept
LnTEC →LnTEC n=10 0.00418 -
LnY → LnTEC m=3 ,n=10 0.00111 Accept
BAHRAIN -
LnY→LnY m=7 0.001272 -
LnTEC →LnY m=7 ,n=8 0.000514 Accept
LnTEC →LnTEC n=8 0.00287 -
LnY→ LnTEC m=4 ,n=8 0.002723 Accept
OMAN -
LnY→LnY m=10 0.001085 -
LnTEC →LnY m=10 ,n=8 0.000176 Accept
LnTEC →LnTEC n=10 0.010101 -
5- Conclusions
In this paper we investigated energy consumption-GDP relation for selected countries of the Middle East.We used annual data spanning the period 1980-2012.Thanks to the stationary variables we employed Hsiao’s(1981) methodology to discern optimal number of lags for the model.The results indicate there is bidirectional causality effect for Pakistan,Oman,Bahrain and the United Arab Emirates, which indicates the feedback hypothesis about these countries.There is a unidirectional causality effect for Iran running from total energy consumption to GDP which supports growth hypothesis.This indicates that energy conservation policies may negatively affect on economic growth. And also there is a unidirectional causality relation running from GDP to total energy consumption for Saudi Arabia.Therefore we can accept the conservation hypothesis for Saudi Arabia.Energy conservation policies can not be harmful for economic growth in Saudi Arabia.
References
1- Al-Iriani, M.A., (2006). Energy–GDP relationship revisited: an example
from GCC countries using panel causality. Energy Policy 34 (17), 3342– 3350.
2- Altinay,G.,Karagol,E.,(2004).stractural break,unit root,and the causality between energy consumption and GDP in Turkey,Energy Economics 26,985-994
3- Asafu-Adjaye,J.,(2000).The relationship between energy consumption, energy prices and economic growth: time series evidence from Asian developing countries. Energy Economics 22,615-625
4- Behmiri, NB., Mansu, JRP. (2012).Crude oil conservation policy hypothesis in OECD countries: a multivariate panel granger causality test. Energy 43, 213-260
5- Cheng, B., (1995). An investigation of cointegration and causality between energy consumption and economic growth. Journal of Energy Development 21, 73–84.
7- Glasure, Y.U., (2002). Energy and national income in Korea: further evidence on the role of omitted variables. Energy Economics 30,271-289. 8- Glasure, Y.U., Lee, A.R., (1997). Cointegration, error correction and the relationship between GDP and energy: the case of South Korea and Singapore. Resource and Energy Economics 20, 17–25.
9- Gudarzi,.F.,Soheli Ghasemi.,B,.(2012).Relatioship between Energy Consumption and GDP in Iran.Journal of Energy Technologies and Policy 2,34-38
10- Hondroyianais, G., Lolos, S., Papapetrou, E., (2002). Energy consumption and economic growth assessing the evidence from Greece. Energy Economics 24, 319–336.
11- Hsiao, C., (1981). Autoregressive modeling and money income causality detection. J. Mon. Econ. 7,85-106
12- Kraft, J., Kraft, A., (1978). On the relation ship between energy and GNP. Journal of Energy Development 3, 401–403
13-Lee, C.C., (2005). Energy consumption and GDP in developing countries: a cointegrated panel analysis. Energy Economics 27, 415–427. 14- Lee, C.C., (2006). The causality relationship between energy consumption and GDP in G-11 countries revisited. Energy Policy 34, 1086– 1093.
15- Lise, W., Montfort, K.V., (2007). Energy consumption and GDP in Turkey: is there a co-integration relationship? Energy Economics 29, 1166– 1178.
16- Masih, A.M.M., Masih, R., (1996). Energy consumption, real income and temporal causality: results from a multi-country study based on cointegration and error-correction modelling techniques. Energy Economics 18, 165–183.
17- Mehrara, M., (2007). Energy consumption and economic growth: the case of oil exporting countries. Energy Policy 35 (5), 2939–2945.
18- Narayan,P.K.,Nayayan.,S.,Popp.,S.,(2010). A note on the long-run elasticities from the energy consumption–GDP relationship. Applied Energy 87, 1054–1057
20- Soytas, U., Sarı, R., (2003). Energy consumption and GDP: causality relationship in G-7 countries and emerging markets. Energy Economics 25, 33–37.
21- Toda, H.Y., Yamamoto, Y., (1995). Statistical inference in vector autoregressions with possibly integrated process. Journal of Econometrics 66, 225–250.
22- Wolde-Rufael, Y., (2004). Disaggregated industrial energy consumption and GDP: the case of Shanghai, 1952–1999. Energy Economics 26, 69–75. 23- Yoo, S.H., (2005). Electricity consumption and economic growth: evidence from Korea. Energy Policy 33, 1627–1632.