O
PSO NVD CFD k L D CL CD h c AOA WIG 1. M. Sc. 2. Associa 3. M.Sc.Optim
Effec
1 O ahigh effect invest nume bound an ob consid vehicl signif are ir Neuro becau is als explo KeywNom
Particle Sw Normalized Computatio Turbulence Turbulence Lift Force Drag Force Lift Coeffi Drag Coeff Ground Cle Cord Lengt Angle of A Wing in Gr Density Dynamic V at Professor (Comizatio
t usin
A. Esmae
1, 2. Departm 3. Departme
Optimization of h order numeri ts of the ground tigated by a h rical simulatio dedness criteria bjective functio
dered as desig les is moving n ficance of it.Th rrefutable para o-Fuzzy Interfa use the objectiv o done and the red.
words: Ground eff
menclature
1warm Optimiza d Variable Dia onal Fluid Dy e Model Param e Model Param
e cient ficient earance th Attack round Viscosity orresponding au
on of M
ng Res
eili
1, M. H.
ment of Engin ent of Engin
*Postal Code:
javaresh
f the sectional ical procedure d clearance, ang high-resolutions on, Normalized
a. In the optimiz on and static co gn variables;.T near the ground herefore, the sta ameters in the ace System (AN ve function and e sensitivity am
fect, Wing shape,
123 ation agram ynamic meter meter uthor)
Movin
sponse
Djavaresh
neering, Ferd eering, Paya : 9177948944 hkian@ferdowing in groun e and response gle of attack, th scheme, which d Variable Diag
ization process, onditions and s Ths is because
d and the distan atic conditions
aerodynamic o NFIS) is emplo d constraints ar mount of the obj
, Response surfac
ng Wi
e Surf
hkian
2*and
dowsi Unive ame Noor Un
, Mashhad, IR wsi.um.ac.ir
d effect (WIG) e surface meth hickness, and ca
is highlystron gram (NVD) s
lift to drag rat shape paramet the main facto nce to the groun s strenuously de optimization of oyed to genera re particularlyn jective function
ce, Static conditio
t Tim
Ve Sou Str Sca Sca SBIC Sec Co Dif Con Dif Cel
F Ma
A Cel
̅ No
SB
a con
Ca Cam
P Pre
ingin
face M
A. Parsani
ersity of Mash niversity, Shi
RAN
) has been stud hod (RSM). Ini
amber of wing ng and accura scheme is appl tio (L/D) is con ters are noticea or in the desig
nd draws atten efend this view f WIG vehicles ate the surface
noisy. Sensitivit n from design va
on, Optimization
me
locity Vector urce Term ess Tensor alar Quantity alar Flux Vect cond and Blen
mbined ffusivity Coef nvection Flux ffusion Flux ll Volume ass Flux
ll Face Area ormalized Coo IC Parameter nvection-diffu mber essure
Grou
Metho
ia
3 hhad iraz died using itially, the have been ate. In thelied to the nsidered as
ANN Artificial Neural Network gbest Global Best Position pbest Particle best Position 2D Two Dimension
weighting function R random function s Position of Particle m Iteration Number
dv Displacement due to new Velocity Re Reynolds Number
SIMP
LE Semi-Implicit Method For Pressure – Linked Equation Source Term from non-orthogonality, numerical dissipation terms and external sources
Introduction
Ground effect vehicles which operate close to the ground by the use of aerodynamic interaction between the wings and the surface known as ground effect,have been the center of researchers’ attention for a long time since 1995 [1-13]. The interaction enhances the lift and decreasesthe drag considerably as comparedto an out of ground effect vehicle. Thus, the aerodynamic enhancement promotes the efficiency of the ground effect vehicles against other transportation systems.Therefore, aerodynamicists have sought to make use of some approaches amplifying the device efficiency. One of these approaches is aerodynamic shape optimization based on computational fluid dynamics (CFD). The optimal design of WIG airfoils has been studied by only a few researchers, whereas most of them have focused on the shape geometries. Kim and Joh[14]have obtained the optimized airfoil shape by using the single-objective optimization technology; and Kim and Chun [15] have also performed computational optimization for an airfoil geometry. More recently, Park and Lee [16] have numerically performed an optimization by considering the lift coefficient, static height stability, and lift-to-drag ratio as objective functions and optimized the airfoil structureby a multi-objective optimization algorithm. Furthermore, the optimization ofwing in ground effect has been performed by Lee and Lee [17] and in parallel,finding the optimum shape usingmulti-objective genetic algorithm and the analysis of the three-dimensional wings in ground effect have been carried out by Lee et al. [18, 19]. Another optimization design of an airfoil which moves close to the ground has been investigated by Kim et al. [20], taking into account the device shape based on lift coefficient maximization. In 2013, an aerodynamic shape optimization of WIG vehicle was conducted by three objective functions, lift coefficient, the aerodynamic center of height, and the lift-to-drag ratio [21].
As a result of literature study, these types of designs impose high costs and lose the WIG vehicle advantages while finding the best wing for WIG vehicles remains a great challenge among the researchers. At present, most of the WIG vehicles utilizepredefined static conditions such as angle of attack and ground clearance. Besides, these parameters play a central role in the device efficiency and they are irrefutable variables in the aerodynamic optimization of WIG vehicles which were neglected in the most previous studies.
The aim of the current study is to optimize the shape and static conditions of a sectional wing, moving near the ground. Aiming to achieve this goal, a highly accurate numerical simulation method and response surface methodology (RSM) are designed and the Adaptive Neuro-Fuzzy Interface System (ANFIS) is employed in order to dampthe noise and find the design point perfectly near the global optimum.Theinfluence of design variables, ground clearance, incidence angle, thickness and camber of the foil, have been initially investigated by a high resolution Normalized Variable Diagram (NVD) scheme, used in the boundedness criteria. In the optimization process, lift to drag ratio (L/D) is considered as the objective function and the design variables consist of thickness and camber of airfoil, angle of attack and ground clearance. Subsequently, sensitivity analysis is done and the amount of objective function allergy from design variables is also explored.
Governing Equation and Discretization
The basic equations, which describe conservation of mass, momentum and scalar quantities can be expressed in the following vector form which is independentfromthe coordinate system.
+ = (1)
( )
+ ⊗ − = (2)
( )
+ − = (3)
The stress tensor and scalar flux vector are usually expressed in terms of basic dependent variables. The stress tensor for a Newtonian fluid is:
= − (4) and the Fourier-type law usually gives the scalar flux vector:
The discretization of the differential equations is carried out using a finite-volume approachandutilizing the Gaussian theorem. The discrete expressions are presented to refer to only one face of the control volume, namely, e, for the sake of brevity. For any ϕ variable (which may also stand for the velocity components), the result of the integration yields:
( ) − ( ) + − + −
= (6)
WhereI’s are the combined cell-face convection I and diffusion I fluxes. The diffusion flux is approximated by central differences. The discretization of the convective flux requires special attention and it helps developing the various schemes. A representation of the convective flux for cell-face (e) is:
= ( . . ) = (7) The value of ϕ is not known and it should be estimated from the values at neighboring grid points by interpolation. The expression for ϕ is determined by the SBIC scheme [22], that is based on the NVD technique [23] using interpolation from the nodes E, P and W. The functional relationship utilized in SBIC scheme for ϕ is given as:
= , ∉ [0,1] = − ̅ ̅
( ̅ ) + 1 + ̅ ̅ ( ̅ ) ,
∈ [0, ] = ̅ − ̅
̅ − 1 + ̅ − ̅
̅ − 1 , ∈ [ , 1]
(8)
Where
= , = ̅ = , =
(9)
The limits on the selection of could be determined in the following way. Obviously, the lower limit is = 0, which would represent switching between upwind and central differencing. It is not favorable, because it is essential to avoid the abrupt switching between the schemes in order to achieve the converged solution. The value of should be kept as low as possible in order to attain the maximum resolution of the scheme. The final form of the discretized equation from each approximation is given as:
. = ∑ , , , . + + (10) Where a,s are the convection-diffusion
coefficients. The term S in Eq. (10) contains quantities arising from non-orthogonality, numerical
dissipation terms and external sources. For the momentum equations, it is easy to separate the pressure-gradient source from the convection momentum fluxes. S is the contribution due to the adapted deferred correction procedure.
RSM Algorithm
This approach is an approximation-based optimization method which is capable offinding good solutions for intricate engineering optimization problems by computing specific values of the objective function for different combinations of the design variables[24, 25]. Indeed, this method has been successfully applied for solving complex engineering problems[26-28]. The main argument to all these problems is the fact that inherent merit functions generally involve both intensive and expensive numerical or experimental tests. However, the number of tests required for the optimization process should be minimized. This method consists of numerical methods in which all design variables are discretized either according to a simple parametric scheme or using a given numerical planning, such as factorial design, orthogonal design, or central composite design[29]. After acquiring data, it is necessary to fit a mathematical equation to describe the behavior of the response according to the levels of values studied.The importance of adopted fitting model is in using an accurate method, Adaptive Neuro-Fuzzy Interface System (ANFIS) [30].Once the surface response is available, conventional optimization techniques, such as gradient-based techniques or global optimization techniques, may be applied to estimate the function optimal point by searching in the constructed surface. In the present study, active-set methodology is employedto find the optimal point and KKT (Karush-Kuhn-Tucker) condition.Also Quasi-Newton algorithms are utilized. The accuracy of the obtained optimal value naturally depends on the selected design and the adopted fitting model[30]. The remaining steps of the RSM-based optimization methodology are aimedto improve the quality of the obtained optimal solutions. Additional numerical tests are performed in orderto acquire additional response surfaces until a convergence criterion is satisfied. If the difference between the optimum values obtained from the surface response and the values obtained via the numerical simulation reaches a given threshold, the optimization process is stopped.The flowchart of the process is depicted in Fig.1.
[t/cmin-t/cmax][Ca/cmin-Ca/cmax][AOAmin- AOAmax][h/cmin-h/cmax]=[0.09-0.15][0-0.04][2.5-7.5][0.1-0.8]. A balanced multilevel design is primarily matriculated with 3 levels for each factor and the numerical simulationis performedfor all levels.
Figure 1. Flow chart of RSM method
Results and Discusion
Grid generation and validation
In the numerical simulation, grid and domain independency and comparison of the current result with thepublished results data should be investigated. The grid structure that is used in CFD simulation is created by a structured mesh employed because of its simplicity and applicability to the current flow configuration (i.e., with a near-by ground). Schematic shape of these two-dimensional structured grids is illustratedin Fig. 2(a). According to Fig. 2(b), the dimension of domain has been obtained after doing several various lengths for b, f, u and independent lengths have been chosen.
(a)
(b)
Figure 2. (a) H grid topology and H grid. (b) Dimension and boundary condition of 2D domain
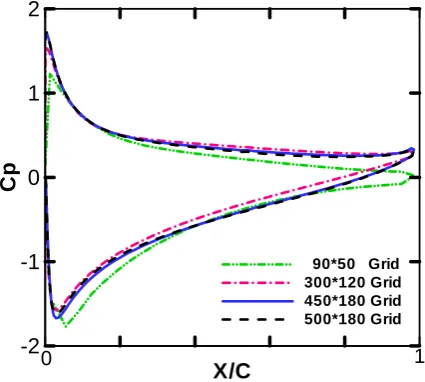
The grid sizing is determined after grid independence whichis found by doing several different trials.which illustrate thesurface pressure coefficient distribution. For example, the effect of grid size is exposed in Fig. 3. For other cases, the above process is utilized for grid and domain independences. The setting of numerical simulation are shown in Table 1. The Reynolds number in this study is 2.4×10⁵.
Figure 3. Effect of grid sizing on pressure distribution on the surface of the airfoil for10˚ and h/c=0.2angle of attack
X/C
Cp
-2 -1 0 1 2
90*50 Grid 300*120 Grid 450*180 Grid 500*180 Grid
Table 1. Settings for Numerical Simulation.
Flow turbulent
Solver 2D Double Precision
Momentum Equation Solver
Normalize variable diagram Algorithm SIMPLE turbulent model
k
Bounded scheme SBIC
In Fig. 4, the pressure distribution on the surface of NACA0015 airfoil moving near the ground is indicated and validated with experimental data [1]. Figs. 5.a and 5.b demonstrate the velocity profile behind the airfoil at x/c=0.5 and x/c=1 from trailing edge for AOA=5° and h/c=0.1,thenthese results are compared with the experimental data [1]. These comparisons prove the numerical results are in a good argument with experimental data.
Figure 4. Comparison between the present numerical results with experimental data, (a) Pressure coefficient
distribution for airfoil NACA 0015 for an AOA 10º and h/c=0.2,
(a) (b)
Figure 5. Distributions of mean velocity in the wake region of the airfoil for AOA=5˚,h/c=0.1 (a) x/c=0.5 and (b) x/c=1
Subsequently, Table 2 draws an analogy between the lift and drag coefficients for the present numerical results and the experimental data [1] and it can be concluded that the numerical results arehighly congruent with the experimental data. It is noteworthy that the difference between drag coefficients from the numerical simulation and the experiment data is attributed to the airfoil configuration near the ground, turbulent models and the amount of uncertainty in the experimental procedures. Furthermore, the same behaviors are observed in some related publication such as [32],where all of cases in this research are under the same conditions.
Table 2. Comparison of the experimental and current numerical aerodynamic coefficients of airfoil NACA 0015 at
AOA=2.5°.
CL
CD
h/c=0.1 Experimental data 0.370 0.0112 Numerical data
Experimental data
0.368 0.297
0.0178 0.0115 h/c=0.5
Numerical data Experimental data
0.275 0.261
0.0220 0.0118 h/c=0.8
Numerical data 0.265 0.0230
Numerical simulation results
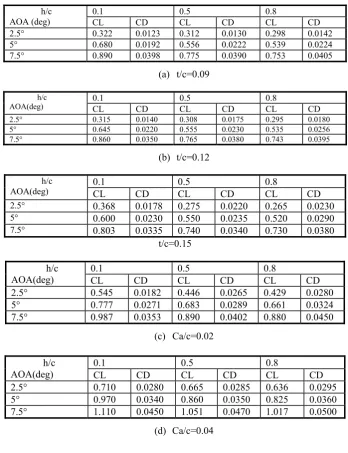
In this research, the e ffect of the camber and thickness of the airfoil have beennumerically investigated in ground proximately for different angles of attack and ground clearances. However, the lift and drag coefficients and lift to drag ratio have been initiallyanalyzed at 3 levels for each factor withspecial angles of attack: 2.5˚, 5˚ and 7.5˚ degrees.Moreover, the ground clearance in this study is fallen into 3 main categories: h/c=0.1, 0.5 and 0.8. Besides, toattain the best airfoil in thepresent condition, the camber and thickness of airfoils were to be taken into consideration; therefore, a broad range of them have beendesignated and both of these parametershave beendivided into 3 segments. The aerodynamic characteristics of these five different 2D airfoils have beeninitially examined according to the assumed cambers and thicknesses. Tables 3(a)-(e) represent the lift and drag coefficients and L/D in thevariant angles of attack as varying ground clearances. In fact, the tables demonstrate some significant trends; for instance, the lift has an upward trend for all cases when the airfoils closely approach the ground. In almost all of the cases, the lift coefficients are dramatically risen by a gradual growth of the camber contrast a slight drop of the thickness. Actually, this behavior lays emphasis on the flow blockage, which hashappened.
u/U
y/
c
0 0.5 1
Num EXP
0.1 0.3
0.2
u/U
y
/c
0 0.5 1
Num EXP
Furthermore, drag has the same trend with lift when the ground clearance is slightly changed; whilethis behavior is in agreement with the experimental data [9,11]. On the other hand, this
simulation confirms that the drag coefficient in thin airfoils is reduced consistently down from AOA= 2.5°to 5°, after that there is a tendency to rise and the drag tends upward toAOA=7.5°.
Table 3. Lift and drag coefficients of the mentioned airfoils
h/c
AOA (deg) 0.1 0.5 0.8 CL CD CL CD CL CD
2.5° 0.322 0.0123 0.312 0.0130 0.298 0.0142
5° 0.680 0.0192 0.556 0.0222 0.539 0.0224
7.5° 0.890 0.0398 0.775 0.0390 0.753 0.0405
(a) t/c=0.09
h/c
AOA(deg) 0.1 0.5 0.8 CL CD CL CD CL CD
2.5° 0.315 0.0140 0.308 0.0175 0.295 0.0180
5° 0.645 0.0220 0.555 0.0230 0.535 0.0256
7.5° 0.860 0.0350 0.765 0.0380 0.743 0.0395
(b) t/c=0.12
h/c
AOA(deg) 0.1 0.5 0.8 CL CD CL CD CL CD
2.5° 0.368 0.0178 0.275 0.0220 0.265 0.0230
5° 0.600 0.0230 0.550 0.0235 0.520 0.0290
7.5° 0.803 0.0335 0.740 0.0340 0.730 0.0380
t/c=0.15
h/c
AOA(deg) 0.1 0.5 0.8 CL CD CL CD CL CD
2.5° 0.545 0.0182 0.446 0.0265 0.429 0.0280
5° 0.777 0.0271 0.683 0.0289 0.661 0.0324
7.5° 0.987 0.0353 0.890 0.0402 0.880 0.0450
(c) Ca/c=0.02
h/c AOA(deg)
0.1 0.5 0.8 CL CD CL CD CL CD
2.5° 0.710 0.0280 0.665 0.0285 0.636 0.0295
5° 0.970 0.0340 0.860 0.0350 0.825 0.0360
7.5° 1.110 0.0450 1.051 0.0470 1.017 0.0500
(d) Ca/c=0.04
It can be clearly seen that the lift coefficient is sharply grown when h/c is slightly decreased, as other parameters (camber, thickness, AOA) remaind unchanged;the reverse behavior isalso observed in the drag coefficient. Likewise, thesetrends are true when the thickness is gently lowered; whilethe reasons forthese behaviors can be explained by the contour of velocity around the airfoils for different thicknesses, which are depicted in Figs. 6(a) and (b), respectively. These figures show that the increase of thickness obviously leads to the
(a)
(b)
Figure 6. Countor of velocity around the airfoil at (a) t/c=0.09, (b) t/c=0.15 and AOA=7.5o and h/c=0.1
h/c=0.1 h/c=0.5
Figure 7. Velocity profiles between the airfoils and ground surfaces for various thickness values and AOA=5o.
Figure 8. Pressure coefficient distribution on the surface of the airfoils for different thickness at AOA=5o and h/c=0.1
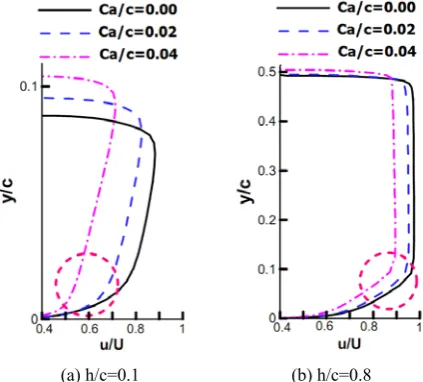
However, the L/D is marginally dropped in the close proximity of the ground whilethe camber of airfoil is consistently risen; but in the high ground clearance, the L/D is dramatically risen, untilit reaches a plateau and then there is a plunge, as shown in Fig.9.The trends are rooted in the air blockage in the area between the ground and the sectional wing surfaces; whenthe camber of airfoil is grown and the wing comes closer to the ground, the flow blockage would be so strong. Therefore, the thickness of the boundary layer in this area would be pressed and the lift coefficient is sharply grown (Fig.10). Nonetheless, the effect of air blockage decreases when the airfoil goes up.
Figure 9. Behavior of L/D as varying camber (ca/c) and h/c for the airfoils under study.
4.5 4
1.5 1.5
2
2.5
4.5
4
11.5 2 2.5 3
Ca/c
L
/D
0 0.01 0.02 0.03 0.04
20 25 30
35 h/c=0.1
(a) h/c=0.1 (b) h/c=0.8
Figure 10. Velocity profile in the area between the airfoil and ground surfaces for different camber values and
AOA=5°.
Hence, pressure coefficient distributions along the upper and lower surfaces of airfoils are illustrated in Fig.11 with various cambers, in both low and high ground clearances. The difference of pressure between the upper and lower surfaces is increased. Nevertheless, it is noteworthy that the pressure differences between the rtwo surfacesare enormously changed in the lower ground clearance, as can be found by the comparison between Figs. 11(a) and (b). Consequently, the lift coefficients in low h/c are significantly greaterthan in high h/c. In contrast, the drag coefficients have the reverse trend and they are slightly reduced whilethe moving airfoil approachesto the ground. On the other hand, the lift and drag coefficients have a noticeable growth by theincreasing camber; but the percentage of their growth is various. As a result, the behavior of L/D is not simplistic and easily predictable when other parameters (camber, thickness, AOA, h/c) are changed.
(a)
(b)
Figure 11. Pressure coefficient distribution on the surface of the airfoils for different cambers at AOA 5o (a) h/c=0.1, (b)
h/c=0.8
As a result of the numerical simulations and above discussions, the combination of the wing shape and static conditions ompoundsthe matter of improving the performance. Actually, their relationship is nonlinear and unpredictable; thisalso sets out some powerful arguments thatboth wing shape and static conditionsshould be simultaneously deliberated in the WIG studies, especially in the optimization process. Thisis a clear illustration of the importance of using a strong and accurate optimization method.
Optimization results
High L/D provides a net gain in economic efficiency; hence, this is one of the principal design parameters of the WIG craft. Numerical simulation makes a case for general influences of four parameters (camber, thickness, AOA, h/c) on the objective function (L/D); therefore, to find the optimum shape and condition, it is needed to go into great details. In this paper, RSM method is applied and response surface is achieved according to the numerical simulation. The data in table 2 is used to build initial response surfaces in terms of the aerodynamic coefficients and the ANFIS approach sets out some powerful rules, which will form the searching space accurately [30].
Anyway, an approximation of the optimal L/D value (η ) is obtained using the active set method, which finds the global maximizer of the constructed surfaces. For the design parameters (i.e., t/c, Ca/c, h/c and AOA) yielding η , an additional numerical simulation is conducted to get η , which is compared to η . The convergence criterion in Eq. (11) decides if a new response surface is needed or not:
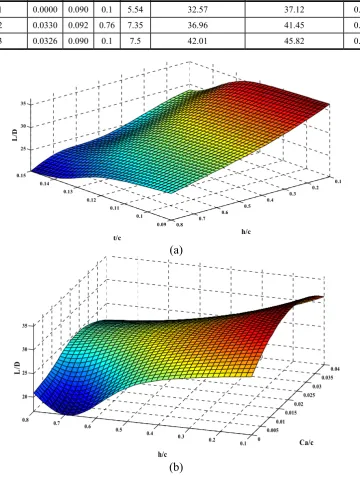
In case a new surface is required, the interest region is systematically decreased and additional experiments are considered around the latest point found for the evaluation of η (Fig. 1). In this study, only three additional surfaces have been constructed until convergence is reached. Fig. 12demonstrates the three response surfaces attained at the last optimization level with a final interest region range. Moreover, table 4 summarizes the main numerical results obtained during the whole optimization process. Finally, the best combination of
design parameters corresponds to the aim, obtaining the maximum value of η.
Pursuant to the following sentences, the best shape characteristics of moving airfoil and static conditions are obtained by RSM, and the optimization results are presented in Table 4. According to the results, the best moving airfoil should have3.26% camber and 9.0% thickness; moreover, the optimum sectional wing should be also approximately 0.1 close to the ground and the best angle of attack is attained as over 7.5°.
Table 4. Optimum evolution through the optimization process
itteration Ca/c t/c h/c AOA L/D(Numeric) L/D(Optimized) error
1 0.0000 0.090 0.1 5.54 32.57 37.12 0.14
2 0.0330 0.092 0.76 7.35 36.96 41.45 0.12
3 0.0326 0.090 0.1 7.5 42.01 45.82 0.09
(a)
(b)
0.09 0.1 0.11 0.12 0.13 0.14 0.15
0.1 0.2 0.3 0.4 0.5 0.6 0.7 0.8 25
30 35
h/c t/c
L/
D
0 0.005
0.01 0.015
0.02 0.025
0.03 0.035
0.04
0.1 0.2 0.3 0.4 0.5 0.6 0.7 0.8 20 25 30 35
Ca/c h/c
L/
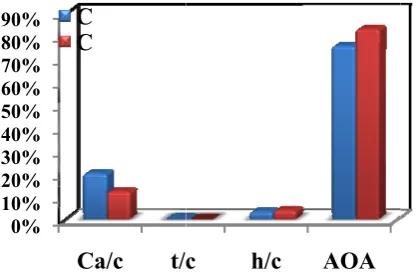
Furtherm computed ba amount of comparison coefficients d camber from shape param the airfoil d forces; but th the lift force impressed al compared w moreover, it On the other same effect o it can be impressing i analysis prov important optimum win both shape p
Figure 13. A 0% 10% 20% 30% 40% 50% 60% 70% 80% 90%
C
C
C
Fmore, the sen ased on the a sensitivity is of them exp deeply depen m among the
eters, respecti does not have
he camber ca . As it can be ll of the aerod with the ot has dramatic r hand, the gro
on the drag a said that so in the design ves the fact th in their o ng would be d
arameters and
Amount of sensit the aerodynam 6 7 7.5 15 20 25 30 35 L/ D
Ca/c
t/
C
C
Figure 12. Appr
sitivity of des aerodynamic f s depicted in plains that the
d on the angl static condit ively. Moreov e a ignificant an influence th
seen, the ang dynamic coeff ther effectiv cally influence
ound clearanc and lift forces
ome parame n of WIG w hat static cond optimization.H
discovered wh d static conditi
tivity of the des mic coefficient 5 5.5 6 6.5 A
c
h/c
roximated resp sign variables forces and the n Fig.13. Th e lift and dra le of attack an tions and win ver, thicknesst effect on th hem, especial gle of attack h ficients sharpl ve parameter ed the CD, to ce has nearlyth
. Consequentl eters are mo wings and th ditions are ve Hence,the be hen considerin ions.
sign variables o s. 3.5 4 4.5 5 AOA
AOA
(c)
onse surfaces a
is eir he ag nd ng of he lly has ly, rs; oo. he ly, ost his ery est ng on The param movi nume (RSM Varia boun (L/D static attac of w varia (ANF respo objec wase movi thick shou and t More signi influ of a coeff param CD, hada Cons param wing cond optim disco and s 0 2.5 3
at thethird optim
aim of this meters and st ing close to erical proced M). In the n
able Diagram ndedness crite D) wasconside c conditions
k) and shape wing) were no ables. Adapti FIS) wasem onse and th ctive funct explored. The ing airfoil sh kness; moreo ld be also app the best angle eover, the th ificant role o uence them, e attack impr ficients sharp meters; more
too. On the aboutthe same sequently, i meters are m gs and this a ditions are mization.Henc overed when static conditio 0.005 0.01 0.015 Ca mization level
Conclusi
study wasto tatic condition the ground dure and respnumerical si m (NVD) sche
eria. Moreove ered as an o (ground cle e parameters oticeable to be
ive Neuro-Fu mployed to
he amount o tion from e results dem hould have3/2 over, the opt proximately 0 e of attack w hickness of on the forces especially the essed all o ply, compare
over, it dram other hand, e effect on th t can be most impressin analysis prove very im ce the best op
considering b ons. 0.02 0.025 0.03 a/c
on
o optimize t ns of a sectio d using a hi ponse surfac imulation, N eme wasappli er, the lift to objective fun earance and (thickness an e considered uzzy Interfac generate the of sensitivity design onstrated tha 26% camber timum sectio 0.1 close to th wasattained aso airfoil didno s; but the ca e lift force. T
of the aero d with other matically influ
the ground he drag and li concludedth ng the design es this fact t mportant i ptimum wing
both shape p
0.035 0.04 the shape onal wing igh order e method ormalized ied in the drag ratio ction and angle of nd camber as design e System e surface
y of the variables at the best
and 9/0% onal wing
he ground over 7.5°. ot have a amber can The angle odynamic effective uenced the clearance ift forces. hat some
n of WIG that static in their
Refrences
1. Ahmed, M, Sharma S., "An investigation on the aerodynamics of a symmetrical airfoil in ground effect,"
Experimental Thermal and Fluid Science, Vol. 29, 2005,
pp. 633-47.
2. Ahmed M, Ali SH, Imran, G. M, Sharma, S. D., "Experimental investigation of the flow field of a symmetrical airfoil in ground effect," 21st Applied Aerodynamics Conference, Orlando, Florida, .2010. 3. Ahmed, M., Takasaki. T., Kohama. Y., "Experiments on
the Aerodynamics of a Cambered Airfoil in Ground Effect," 44th AIAA Aerospace Sciences Meeting and Exhibit, Reno, Nevada.
4. David JO, Jeff A., "Experimental Investigation of Various Winglet Designs for a Wing in Ground Effect,"
22nd Applied Aerodynamics Conference and Exhibit.
Providence, Rhode Island, 2004, pp. 1-10.
5. Jung, K., Chun, H. and Kim. H.,"Experimental investigation of wing-in-ground effect with a NACA6409 section,"Journal of marine science and technology, Vol. 13, 2008, pp. 317-27.
6. Park K, Lee J.,"Influence of endplate on aerodynamic characteristics of low-aspect-ratio wing in ground effect," Journal of mechanical science and technology," Vol. 22, 2008, pp. 2578-89.
7. Moon Y, Oh H, Seo J., "Aerodynamic investigation of three-dimensional wings in ground effect for aero-levitation electric vehicle," Aerospace science and technology, Vol. 9, 2005, pp. 485-94.
8. Jeonghyun C, Jinsoo C, Seawook L., "Unsteady Numerical Simulation of Wings with Flapper Flying Over Nonplanar Ground Surface," Journal of Aircraft, Vol. 44, No. 6, 2007, pp. 1849-1855.
9. Zhang X, Zerihan J., "Aerodynamics of a double-element wing in ground effect," AIAA Journal, Vol. 41, 2003, pp. 1007-16.
10. Jones, B., Franke, M., Stephen, E., "Aerodynamic Ground Effects of a Tailless Chevron-Shaped UCAV Model," American Institute of Aeronautics and
Astronautics, 1801 Alexander Bell Drive, Suite 500,
Reston, VA, USA, 2006, pp. 20191-4344.
11. Djavareshkian, M. H., Esmaeili. A., Parsani, A., "Aerodynamics of smart flap under ground effect,"
Aerospace Science and Technology, Vol. 15, No. 8,
2011, pp. 642-652.
12. Nuhait A.,"Unsteady ground effects on aerodynamic coefficients of finite wings with camber," Journal of Aircraft, 1995, Vol. 32, pp. 186–92.
13. Djavareshkian, M. H. and Esmaeili, A., "Application of smart flap for race car wings. International," Journal of Aerodynamics, 2012, Vol. 2, pp. 66-92.
14. Kim Y. J., Joh C. Y., "Aerodynamic Design Optimization of Airfoils for WIG Craft Using response Surface Method," Journal of the Korean Society for
Aeronautical and Space Sciences, Vol. 33, No. 5, 2004,
pp. 18-27.
15. Kim, H.J., Chun, H .H., "Design of 2-dimensional WIG section by a nonlinear Optimization method," Journal of
Society of Naval Architects of Korea, Vol. 35, No. 3,
1998, pp.50–59.
16. Park, K. W., Lee, J. H., "Optimal design of two-dimensional wings in ground effect using multi-objective genetic algorithm," Ocean Engineering, Vol. 37, 2010, pp. 902–912.
17.Lee, S. H., Lee, J. H.,; "Optimization of three-dimensional wings in ground effect using multi objective genetic algorithm," Journal of Aircraft, Vol. 48, No. 5, 2011, pp. 1633–1645.
18.Park K, Kim B, Lee J, Kim K., "Aerodynamics and Optimization of Airfoil Under Ground Effect,"
International Journal of Mechanical Systems Science and Engineering, Vol. 1,No. 4, 2009, pp. 385-391. 19.Lee J, Hong C, Kim B, Park K, Ahn J., Optimization of
Wings in Ground Effect Using Multi-Objective Genetic Algorithm, 48th AIAA Aerospace Sciences Meeting Including the New Horizons Forum and Aerospace Exposition, Florida, 2010.
20.Kim H, Chun H, Jung K., Aeronumeric optimal design of a wing-in-ground-effect craft. Journal of marine science and technology,Vol. 14, 2009, pp. 39-50.
21.Sang-Hwan Lee, Juhee Lee, 2013; Aerodynamic analysis and multi-objective optimization of wings in ground effect; Ocean Engineering, Vol. 68, No. 1, pp. 1– 13.
22.Djavareshkian M.,, A new NVD scheme in pressure-based finite-volume methods. 14th Australasian Fluid
Mechanics conference, 2001, Adelaide, Australia.
23.Leonard, B.P., A survey of finite differences with upwinding for numerical modeling of the incompressible convection diffusion equation in C. Taylor and K. Morgan leds Technices in Transient and Turbulent Flow, Pineridgequess, Swansea, UK, Vol. 2, 1981, pp. 1-35. 24.Raymer D.P.,. "Enhancing Aircraft Conceptual Design
Using Multidisciplinary Optimization," [PhD Thesis],
Royal Institute of Technology, Stockholm, Sweden,
2002,.
25.Box G.E. P., Draper N.R., Response Surfaces, Mixtures, and Ridge Analyses, 2nd Edition, John Wiley & Sons,
USA, 2007.
26.Haftka, R., Scott, E.P. and Cruz, J.R.,; "Optimization and experiments: a survey," Applied Mechanics Review, Vol. 51, No. 7, 1998, pp. 435-448.
27.Wang, G.G., Dong, Z., 2000; Design optimization of a complex mechanical system using adaptive response surface method, Transactions of the CSME, Vol. 24, No. 1B,pp. 295-306.
28.Rodriguez D.L., 2003; Response Surface Based Optimization with a Cartesian CFD Method. 41st AIAA Aerospace Sciences Meeting, Reno, Nevada, USA, 0465.
29.Bezerra, M. A., Santelli, R. E., Oliveira, E. P., Villar, L. S., & Escaleira, L. A., 2008;Response surface methodology (RSM) as a tool for optimization in analytical chemistry. Talanta, Vol. 76, No. 5, pp. 965-977.
30.Djavareshkian, M. H., Esmaeili, A., 2013; Neuro-fuzzy based approach for estimation of Hydrofoil performance. Ocean Engineering, Vol. 59, pp. 1-8.
31.Mekadem, M., Chettibi, T., Hanchi, S., Keirsbulck, L., & Labraga, L.,; Kinematic optimization of 2D plunging airfoil motion using the response surface methodology. Journal of Zhejiang University Science A, Vol. 13, No. 2, 2012, pp. 105-120.
32.Smith Justin, L., Henry, Z. G., James E Smith, "The validation of an airfoil in the ground effect regime using 2-D CF2-D analysis," 26th AIAA Aerodynamic Measurement
Technology and Ground Testing Conference," 2008,