Experimental design and response surface modeling for optimization of
humic substances removal by activated carbon: A kinetic and isotherm
study
Ahmad Reza Yazdanbakhsh Ahmad Reza Yazdanbakhsh Ahmad Reza Yazdanbakhsh Ahmad Reza Yazdanbakhsh1111,
, ,
, YaldaYaldaYalda HashempourYaldaHashempourHashempourHashempour2222
1 Department of Environmental Health Engineering, School of Public Health, Shahid Beheshti University of Medical Sciences, Tehran, Iran
2 Students Research Committee, Department of Environmental Health Engineering, School of Public Health, Shahid Beheshti University of Medical Sciences, Tehran, Iran
Abstract Abstract Abstract Abstract
The presence of humic acid (HA) in water treatment processes is very harmful and the cause of undesirable color, taste, and smell. Drinking water containing high concentrations of humic substances can be the cause of many health problems. Therefore, the removal of these compounds from water resources is a very important topic. In this research, response surface methodology (RSM) has been used to optimize the effect of main operational variables responsible for higher HA removal by activated carbon (AC). A three-level Box–Behnken factorial design (BBD) was used to optimize initial concentration of HA, time, pH, and AC dose for humic substances removal. The characterization of AC was carried out using scanning electron microscopy (SEM), energy-dispersive X-ray spectroscopy (EDS), and X-ray diffraction (XRD) analysis. A coefficient of determination (R2) value of 0.98, model
F-value of 82.32 and its low P (F < 0.0001), and low F-value of coefficient of variation (9.94%) indicated the fitness of the response surface quadratic model during the present study. At initial optimum concentration (5.25 mg HA/l), pH (5.85), contact time (36.01 minutes), and dose (1.38 g AC/L), the model predicted 1.90 mg HA/l. Equilibrium adsorption of HA onto AC had best fitness with the Freundlich isotherm and pseudo-second-order kinetic model.
KEYWORDS: KEYWORDS: KEYWORDS:
KEYWORDS: Humic Substances, Kinetics, Drinking Water, Adsorption
Date of submission Date of submission Date of submission
Date of submission:::: 20 Oct 2014, Date of acceptance:Date of acceptance:Date of acceptance:Date of acceptance: 12 Jan 2015
Citation: Yazdanbakhsh AR, Hashempour Y. Experimental design and response surface modeling for
optimization of humic substances removal by activated carbon: A kinetic and isotherm study. J Adv
Environ Health Res 2015; 3(2): 91-101.
Introduction
1Humic substances are a group of non-biodegradable organic material which must be removed from drinking water sources. An essential part of humic substances in water is
humic acids (HAs).1 HAs are natural
polyelectrolytes which are formed due to the decomposition of plants, animals, and other
Corresponding Author:
Corresponding Author: Corresponding Author: Corresponding Author: Yalda Hashempour
Email: [email protected]
organisms in the form of biological activity in
soil and natural waters.2 Hydrophilic
compounds are amorphous and have varied molecular weight. Their physical and chemical
properties make them special.3 Functional
groups of humic substances are carboxylic, phenolic, carbonyl, and hydroxyl acids, acetaldehyde, and methoxy. The presence of phenolic and carboxyl groups creates a stable
negative charge in aqueous environments.4,5
and chemical properties of these organic
materials in water depend on their source.5
Sources of humic substances in water include leakage through the soil, sediment, aquatic animals, plants, and effluents from sewage
treatment plants.1 The concentration of humic
substances in natural waters is usually in the
range of 0.1 to 10 mg/l.5,6 The presence of
humic substances in water treatment processes is very harmful and the cause of undesirable color, taste, and smell. On the other hand, as a result of chlorination of these waters, dangerous and carcinogenic byproducts such
as trihalomethanes (THMs) are produced.7
Humic substances in water interfere with the removal of heavy metals by forming complexes with metal. In addition, humic substances can form complexes with heavy metals, pesticides, and herbicides that lead to a migration of these compounds in aqueous solutions and an increase in their concentration. This is an
important issue in water.7 The high
concentrations of humic substances in water disrupt the performance of ion exchange resins
and membranes in water treatment.8 In
addition to the above problems, some sources have reported that drinking water containing high concentrations of HA can be a cause of
black foot disease.5,6 Thus, the removal of these
compounds from drinking water and other water resources is of significant importance.
Conventional treatment methods
(coagulation, flocculation, sedimentation, and disinfection) cannot completely remove humic substances from water and are only able to
remove 20 to 50% of them.4,9 On the other hand,
other methods of removing organic materials, including ion exchange, evaporation, reverse osmosis, and chemical precipitation, often have high costs and disposal of their sludge is
difficult.10,11 Therefore, the use of a low-cost
adsorbent that is able to remove high amounts of organic matter and improve the quality of drinking water is a necessity. Several absorbents such as clay, zeolite, chitosan, and metal oxides
are used to adsorb humic substances.10,12,13
Activated carbon (AC) is extensively used in the removal of organic compounds from water, because the absorbent has a high active surface
and has shown an efficient performance.10 The
purpose of this study was to investigate the use of AC as a model adsorbent for the removal of HA from water. The experimental work includes the assessment of factors influencing the adsorption of HA on AC by means of Box– Behnken factorial design (BBD) in response surface methodology (RSM). The adsorption kinetics of HA on AC under various conditions were also studied.
Materials and Methods
Commercial AC used in this study was a Merck (Merck KGaA, Darmstadt, Germany) product. The stock solution of HA was made
according to the standard method14 and was
stored in a refrigerator at 4 ± 0.1 ˚C before use.
All solutions used in each run were prepared by diluting the stock solution. The commercial AC was dipped in 5% hydrochloric acid for 24 hours, followed by washing with deionized water until the water pH was stable (pH = 6.52–6.70). After drying for 24 hours at 105 ˚C, AC was used as an absorbent. The morphological properties of AC were observed using a scanning electron microscope
(SEM-EDS, TESCAN Vega Model, Brno, Czech
Republic). The crystal structure and
crystallinity of the composites were examined using X-ray diffraction (XRD) analysis with a Rigaku D/MAXYA diffractometer with Ni-filtered Cu Ka radiation as X-ray source (Theta-Theta model, STOE, Germany).
time 1 and 60 minutes, and AC dose 0.5 and 1.5 g/l. The HA removal efficiency was multiplying regressed the different parameters by the least square methods as follows:
Y = β + ∑ β X + ∑ β X + ∑ β X X [2]
where Y is the predicted response variable, β0, βi, βii, and βij are constant regression coefficients, and Xi and Xj (i = 1, 3; j = 1, 3, i ≠ j)
represent the independent variable.15
The accuracy and fitness of the above model
was evaluated by R2 and F values. Table 1
shows the BBD matrix along with experimental and predicted values for HA removal. The predicted values for HA removal were obtained by applying the quadratic model (Design Expert software, version 7, Stat-Ease, Inc., Minneapolis, Mn, USA). The optimum values of the variables for HA removal were obtained by solving the regression equation, and analyzing the response surface contour plots and constraints for the variables using the same software. The goal determined for HA removal was maximum HA removal.
All experiments were performed at room temperature and in batch mode in 250 ml beakers by mixing 100 ml of the desired HA solution. The mixture was shaken at 200 rpm for the desired duration of time. The mixture was then filtered through 0.45 µ filter and the final concentration of HA in the supernatant solution was determined by measuring the absorbance at the maximum wavelength of 254 nm using a UV-visible spectrophotometer (DR5000). The amount of HA adsorbed (mg/g) was calculated based on the following equation:
q =( )V [3]
where qe is the amount (mg) of absorbed
HA on per g of AC, C0 and Ct are HA concentration (mg) before adsorption and after adsorption in time t, respectively. V is initial volume of solution (l), and m the weight of absorbent (g).
The pH of zero charge point (pHzpc) of AC
was determined according to the pH drift
procedure.4,5
Among the various isotherm equations that are used for analysis of absorption data in aqueous environments, the Langmuir and Freundlich isotherms are more common. The linear form of these isotherms is shown as equation 5 (Langmuir) and 6 (Freundlich):
= + C [5]
lnq = lnk + lnC [6]
where q0 (mg/g) is the maximum adsorption capacity, qe (mg/g) is the amount of HA adsorbed on the adsorbent, Ce (mg/l) is the equilibrium HA concentration, kF and n are the Freundlich constants, and k1 (l/mg) is the Langmuir constant. For the Langmuir model, the linear plot of 1/(X/m) versus 1/C, and for the Freundlich model, the linear plot of lnqe versus lnCe is drawn. The determination
coefficient (R2) is used to determine the
goodness of fit of the models.
In this study, pseudo-first order and pseudo-second-order kinetics were used to describe the data. The pseudo-first order (equation 7) and the pseudo-second order (equation 8) are as follows:
ln(q − q!) = −K t + lnq [7]
!
$ = % %+ t [8]
where qe and qt are the amount of HA adsorbed on AC at time t and equilibrium time, respectively. K1 and k2 are constants of adsorption rate. For the pseudo-first order model, the plot of ln(qe-qt) versus t, and for the pseudo-second order model, the plot of t/qt versus t is drawn. The determination
coefficient (R2) is used to determine the
goodness of fit of the models.
Results and Discussion
Characterization of AC
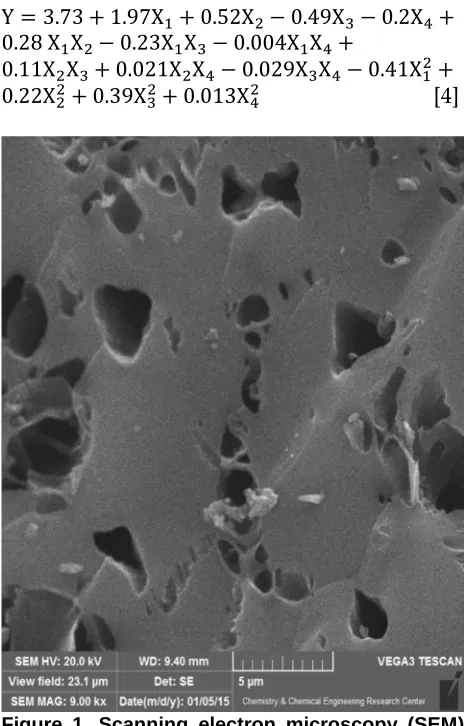
determined using scanning electron microscopy (SEM) and energy-dispersive X-ray spectroscopy (EDS) analysis in the operating voltage of 20 keV (Figure 1). The electron image is magnified 9000 times. These analyses show the quantitative characteristics, such as particle size, shape/morphology, and surface area, of AC. The results of the analysis of SEM-EDS (Figure 2) show the elemental analysis of AC. As can be seen in figure 1, the two main elements in the AC were carbon and oxygen that included 90.39 and 9.61% by total weight, respectively. All these features show that AC has a high potential to absorb pollutants from water.
The XRD pattern of AC is illustrated in figure 3. In the pattern of AC, there was only one broad peak at 24.14 corresponding to
amorphous carbon.2
Optimization of parameters for HA removal Table 1 shows that there was a considerable variation in HA removal by AC at different values of selected parameters. Multiple regression analysis method based on equation 2 was used for analyzing the data. The predicted response Y for HA removal was obtained as following:
Y 3.73 1.97X 0.52X 0.49X/ 0.2X0
0.28 X X 0.23X X/ 0.004X X0
0.11X X/ 0.021X X0 0.029X/X0 0.41X
0.22X 0.39X/ 0.013X0 [4]
Figure 1. Scanning electron microscopy (SEM) image of activated carbon (AC)
Figure 3. X-ray diffraction (XRD) patterns of activated carbon (AC)
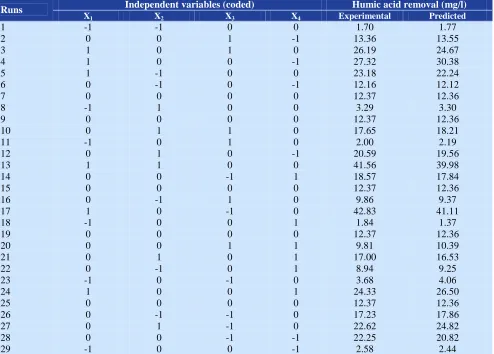
Table 1. Box–Behnken factorial design (BBD) matrix in coded terms along with experimental and predicted values for humic acid (HA) removal
Runs Independent variables (coded) Humic acid removal (mg/l)
X1 X2 X3 X4 Experimental Predicted
1 -1 -1 0 0 1.70 1.77
2 0 0 1 -1 13.36 13.55
3 1 0 1 0 26.19 24.67
4 1 0 0 -1 27.32 30.38
5 1 -1 0 0 23.18 22.24
6 0 -1 0 -1 12.16 12.12
7 0 0 0 0 12.37 12.36
8 -1 1 0 0 3.29 3.30
9 0 0 0 0 12.37 12.36
10 0 1 1 0 17.65 18.21
11 -1 0 1 0 2.00 2.19
12 0 1 0 -1 20.59 19.56
13 1 1 0 0 41.56 39.98
14 0 0 -1 1 18.57 17.84
15 0 0 0 0 12.37 12.36
16 0 -1 1 0 9.86 9.37
17 1 0 -1 0 42.83 41.11
18 -1 0 0 1 1.84 1.37
19 0 0 0 0 12.37 12.36
20 0 0 1 1 9.81 10.39
21 0 1 0 1 17.00 16.53
22 0 -1 0 1 8.94 9.25
23 -1 0 -1 0 3.68 4.06
24 1 0 0 1 24.33 26.50
25 0 0 0 0 12.37 12.36
26 0 -1 -1 0 17.23 17.86
27 0 1 -1 0 22.62 24.82
28 0 0 -1 -1 22.25 20.82
29 -1 0 0 -1 2.58 2.44
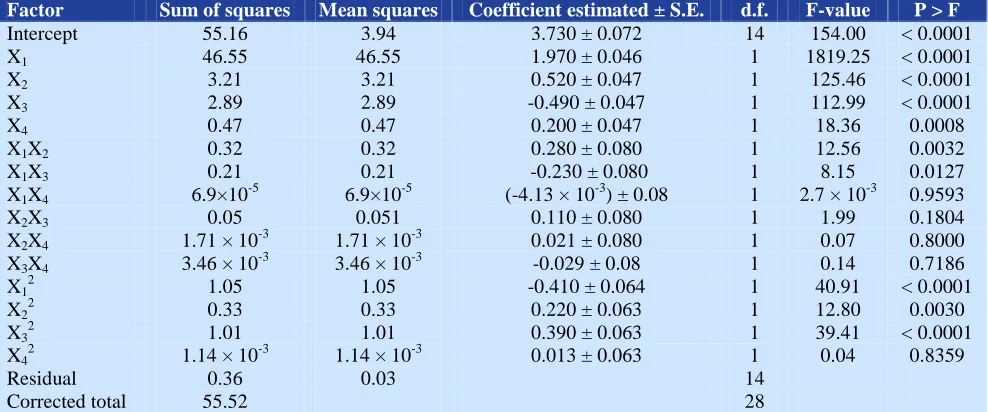
Table 2. Analysis of variance (ANOVA), regression coefficient estimate, and test of significance for humic acid (HA) removal
Factor Sum of squares Mean squares Coefficient estimated ± S.E. d.f. F-value P > F Intercept 55.16 3.94 3.730 ± 0.072 14 154.00 < 0.0001
X1 46.55 46.55 1.970 ± 0.046 1 1819.25 < 0.0001
X2 3.21 3.21 0.520 ± 0.047 1 125.46 < 0.0001
X3 2.89 2.89 -0.490 ± 0.047 1 112.99 < 0.0001
X4 0.47 0.47 0.200 ± 0.047 1 18.36 0.0008
X1X2 0.32 0.32 0.280 ± 0.080 1 12.56 0.0032
X1X3 0.21 0.21 -0.230 ± 0.080 1 8.15 0.0127
X1X4 6.9×10⁻⁵ 6.9×10⁻⁵ (-4.13 × 10⁻³) ± 0.08 1 2.7 × 10⁻³ 0.9593
X2X3 0.05 0.051 0.110 ± 0.080 1 1.99 0.1804
X2X4 1.71 × 10⁻³ 1.71 × 10⁻³ 0.021 ± 0.080 1 0.07 0.8000
X3X4 3.46 × 10⁻³ 3.46 × 10⁻³ -0.029 ± 0.08 1 0.14 0.7186
X12 1.05 1.05 -0.410 ± 0.064 1 40.91 < 0.0001
X2 2
0.33 0.33 0.220 ± 0.063 1 12.80 0.0030
X32 1.01 1.01 0.390 ± 0.063 1 39.41 < 0.0001
X42 1.14 × 10⁻³ 1.14 × 10⁻³ 0.013 ± 0.063 1 0.04 0.8359
Residual 0.36 0.03 14
Corrected total 55.52 28
X1: Initial concentration of humic acid; X2: pH; X3: Time; X4: Activated carbon dose
In this equation Y is the HA removal (mg/l), and X1, X2, X3, and X4 are initial concentration of HA, pH, contact time, and AC dose, respectively. The data obtained from Eq. 4 were verified by F value and the analysis of variance (ANOVA) in response surface quadratic model. All p-values below 0.05 were considered as significant. The linear effect of coefficients of initial concentration of HA (P < 0.0001), pH (P < 0.0001), contact time (P < 0.0001), and AC dose (P = 0.0008) were significant. Similarly, the interactive effects of initial concentration and pH (P = 0.0032), and initial concentration and time (P = 0.0127) were also significant. However, the interactive effect of initial concentration and dose (P = 0.9593), pH and time (P = 0.1804), pH and dose (P = 0.8), and time and dose was insignificant. The p-values of the quadratic terms, [initial concentration (X12) (P < 0.0001), pH (X22) (P = 0.003), and time (X32) (P < 0.0001)] were
significant. The F-value (154), R2 value (0.99),
probability (P < 0.0001), and coefficient of variation (C.V. = 4.32%) obtained through ANOVA for response surface quadratic model signify that the model is significant (Table 2). Statistical parameters listed in table 2 and the
high value of the regression coefficient
(R2 = 0.98) suggest that the removal of HC by
AC can be well described through this model. On the other hand, the F value showed that the model was significant. The F value in this study is equal to 82.32. Since the F parameter is higher than 18, the significance of the model for the removal of HC is clear.
As can be seen in table 1, experimental and predicted values for HA removal lie within a narrow interval. This also shows the outstanding degree of fitness for the model equation.
The main objective of the optimization is to determine the optimum values of variables for HA removal efficiency. In optimization, the desired aim in terms of HA removal
efficiency was defined as achieving
maximum removal efficiency. At optimum initial concentration (5.25 mg HA/l), pH (5.85), contact time (36.01 minutes), and dose (1.38g AC/l) the model predicted 1.90 mg HA/l or 67.52% removal efficiency.
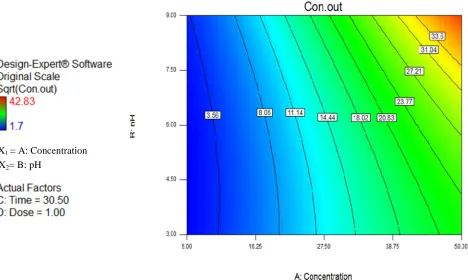
The effect of the HA initial concentration and pH
Contour plots show the type of interaction between test variables and help to achieve the
removal as a result of interaction between initial concentration (5, 25, and 50 mg/l) and pH (3, 6, and 9). Colors for the contour plots represent the removal efficiency. For example, red means maximum removal, green medium, and blue minimum removal efficiency. With increased initial concentration, HA removal efficiency decreased, and maximum sorption (65.99%) was predicted at 5 mg HA/l. The results show that with increase in initial concentration, HA organic molecules are adsorbed on the surface of AC and these molecules can occupy greater number of active
sites on the absorbent.17 Thus, at lower
concentration, a greater number of pores was available on the AC surface.
As the results verified, acidic conditions were more suitable for the removal of HA, and efficiency decreased when pH was greater than 5. Most of the organic contaminants were
reduced effectively at lower pH values.18 At
low pH values, surface sites are closely
coupled to H+ ions; therefore, these sites
become unavailable for other cations. Thus, HA could not be easily adsorbed onto AC. In alkaline conditions, HA is negatively charged
and the efficiency slightly decreased.15
The effect of contact time and AC dosage Removal efficiency for HA was investigated at contact time of 1, 30, and 60 minutes. The results showed that the optimum time for HA removal by AC was 60 minutes. Therefore, HA adsorption was found to increase with increase in time as shown in figure 5. The HA removal in the abovementioned time duration was attributed to the surface connection between
active surface groups and HA ion.
Furthermore, further sorption at the described times can be illustrated with an increased availability in the active boundary sites on the
sorbent surface area.19,20
Figure 4. Response surface contour plots showing effect of initial concentration (mg HA/l) and pH on humic acid (HA) removal (mg/l)
X1 = A: Concentration
Figure 5. Response surface 3D plots showing effect of initial concentration (mg HA/l) and time on humic acid (HA) removal (mg/l)
Figure 6. Response surface one factor plots showing effect of activated carbon (AC) dose (g AC/l) on humic acid (HA) removal (mg/l)
Consideration of the effect of one factor (AC dose) alone shows that its effect is in accordance with figure 6. As shown in figure 5, with increase in AC dosage, the removal efficiency also increased. The removal of organic compounds such as HA by AC implicates direct contact between the organic
matter and cavity on the AC particle surface. ANOVA analysis showed the significant effect of adsorbent dosage on HA removal (P < 0.0001). Nevertheless, the interaction effects of these variables with other variables in this study (initial concentration, pH, and contact time) were not significant.
X1 = Concentration
X2 = C: Time
Isotherm and kinetic study
Equilibrium time is the primary result of absorption kinetics. If this parameter is
specified, adsorption isotherms can be
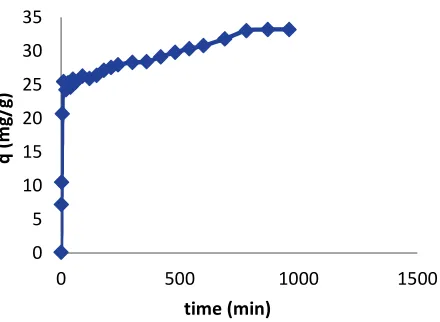
achieved. In this study, to obtain absorption equilibrium time, a 250 ml HA solution with concentration of 25 mg/l was prepared, and then, 125 mg of adsorbent was added to the container. The pH value of the solution was adjusted between 5.6 and 7. Mixing speed and temperature were 200 rpm and 25 °C, respectively. The sampling was conducted at specified intervals and after passing samples from a 0.45 µ filter, absorbed HA was measured using a spectrophotometer at a wavelength of 254 nm. The results of this phase were examined by drawing a diagram of the
concentration versus time and when
concentration changed over time and reached zero, it was recorded as the equilibrium time. As can be seen in figure 5, the equilibrium time in this study was 960 minutes (Figure 7).
Figure 7. Equilibrium time curve of humic acid (HA) absorption on activated acid (AC)
Adsorption isotherms are equilibrium data used to describe the interaction between adsorbent and adsorbate. Isotherms also suggest the capacity of an adsorbent. The results of Langmuir and Freundlich isotherm models are shown in figures 8 and 9 and also in table 3. As is clear from the results and determination coefficient, the Freundlich
isotherm model is able to better explain test
results (R2 = 0.9971). The empirical equation
isotherm of Freundlich is based on multi-layer,
non-homogeneous, and heterogeneous
materials adsorbed on the adsorbent.3
Figure 8. Langmuir model of humic acid (HA) absorption on activated acid (AC) (pH = 6-7.5, T = 25 ºC, mixing time for AC = 16 hours)
Figure 9. Freundlich model of humic acid (HA) absorption on activated carbon (AC) (pH = 6-7.5, T = 25 ºC, mixing time for AC = 16 hours)
Table 3 illustrates that the obtained value of n in the Freundlich model is 1.322; representing
the average absorption of HA on AC.9
To investigate the factor influencing the reaction rate, it is necessary to study the kinetics of the process. Adsorption kinetics were studied in order to better understand the adsorption dynamic of HA on the adsorbent and produce a predictive model to estimate the amount of ions absorbed during the process.
0 5 10 15 20 25 30 35
0 500 1000 1500
q
(
m
g
/g
)
time (min)
y = 65.519x + 2.5759 R² = 0.9865
0 10 20 30 40
0 0.2 0.4 0.6
1
/(
X
/m
)
1/C
y = 0.7641x - 4.0539 R² = 0.9971 -4
-3
-2
-1
0
0.5 1.5 2.5
ln
(X
/m
)
Table 3. Parameters of Langmuir and Freundlich models in adsorption of humic acid (HA) on activated carbon (AC)
Langmuir Freundlich
b qm R2 k n R2
0.2385 33.2 0.9865 0.0175 1.322 0.9971
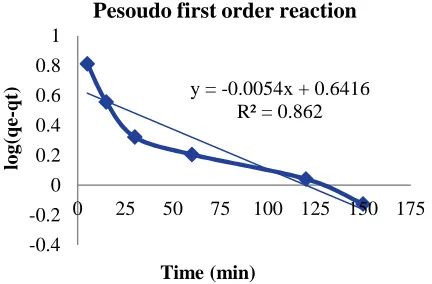
Figures 10 and 11 show pseudo-first-order and pseudo-second-order kinetics curves,
respectively. R2 obtained for the pseudo-first-
and pseudo-second-order models were 0.9855 and 0.9999, respectively. Therefore, the pseudo-second-order kinetic model is more acceptable for analysis of HA on AC.
Figure 10. Pseudo-first-order kinetic model of humic acid (HA) absorption on activated carbon (AC) (initial concentration = 25 mg/l, pH = 6-7.5, T = 25 ºC
Figure 11. Pseudo-second-order kinetic model of humic acid (HA) absorption on activated carbon (AC) (initial concentration = 25 mg/l, pH = 6-7.5, T = 25 ºC
The pseudo-first-order kinetic model is based on absorbent capacity and is applied
when adsorption, using diffusion mechanism, occurs within a boundary layer. While, the pseudo-second-order kinetic model shows that chemical adsorption is dominant and and shows the controlling mechanism in the
process of adsorption.21
Conclusion
In the present study, RSM based on the four-factor-three-level BBD was employed as an experimental design tool to explain the effect of main operating parameters (including HA concentration, pH, contact time, and adsorbent dose) and their interactions on the removal of HA. RSM showed that HA removal efficiency was significantly affected by all the mentioned variables. AC is quite efficient in the removal of humic substances from solution. According to the ANOVA results, the model presents a
high R2 value (0.98) for HA removal efficiency.
At optimum initial concentration (5.25 mg HA/l), pH (5.85), contact time (36.01 minutes), and dose (1.38 g AC/l) the model predicted 1.90 mg HA/l or 67.52% removal efficiency.
Conflict of Interests
Authors have no conflict of interests.
Acknowledgements
The information in this paper was gathered from a research (number 12915) financially support by the Deputy of Research of Shahid Beheshti University of Medical Sciences, Tehran, Iran. The authors are most grateful to the laboratory staff of the Department of Environmental Health Engineering, School of Public Health, Shahid Beheshti University of Medical Sciences, for their financial support and collaboration in this research.
y = -0.0054x + 0.6416 R² = 0.862
-0.4 -0.2 0 0.2 0.4 0.6 0.8 1
0 25 50 75 100 125 150 175
lo
g
(q
e-q
t)
Time (min)
Pesoudo first order reaction
y = 0.0377x + 0.0725 R² = 0.9999
0 2 4 6 8
0 25 50 75 100 125 150 175
t/
q
t
Time (min)
References
1. Khraisheh M, Al-Ghouti MA, Stanford CA. The application of iron coated activated alumina, ferric oxihydroxide and granular activated carbon in removing humic substances from water and wastewater: Column studies. Chemical Engineering Journal 2010; 161(1-2): 114-21.
2. Lorenc-Grabowska E, Gryglewicz G. Adsorption of lignite-derived humic acids on coal-based mesoporous activated carbons. J Colloid Interface Sci 2005; 284(2): 416-23.
3. Chang MY, Juang RS. Adsorption of tannic acid, humic acid, and dyes from water using the composite of chitosan and activated clay. J Colloid Interface Sci 2004; 278(1): 18-25.
4. Daifullah AAM, Girgis BS, Gad HMH. A study of the factors affecting the removal of humic acid by activated carbon prepared from biomass material. Colloids and Surfaces A: Physicochemical and Engineering Aspects 2004; 235(1-3): 1-10.
5. Doulia D, Leodopoulos C, Gimouhopoulos K, Rigas F. Adsorption of humic acid on acid-activated Greek bentonite. J Colloid Interface Sci 2009; 340(2): 131-41. 6. Wu FC, Tseng RL, Juang RS. Comparative adsorption of metal and dye on flake- and bead-types of chitosans prepared from fishery wastes. J Hazard Mater 2000; 73(1): 63-75.
7. Terdkiatburana T, Wang S, Tadé MO. Competition and complexation of heavy metal ions and humic acid on zeolitic MCM-22 and activated carbon. Chemical Engineering Journal 2008; 139(3): 437-44.
8. Wu FC, Tseng RL, Juang RS. Enhanced abilities of highly swollen chitosan beads for color removal and tyrosinase immobilization. J Hazard Mater 2001; 81(1-2): 167-77.
9. Lai CH, Chen CY. Removal of metal ions and humic acid from water by iron-coated filter media. Chemosphere 2001; 44(5): 1177-84.
10.Namasivayam C, Sangeetha D. Recycling of agricultural solid waste, coir pith: removal of anions, heavy metals, organics and dyes from water by adsorption onto ZnCl2 activated coir pith carbon. J Hazard Mater 2006; 135(1-3): 449-52.
11.Ndjeumi CC, Mãicãneanu A, Bike Mbah JB, Mouthe
Anombogo GA, Kamga R. Assessment of physico-chemical parameters for humic acids adsorption on alumina. Chemistry Journal 2015; 1(4): 133-8. 12.Wang S, Zhu ZH. Humic acid adsorption on fly ash
and its derived unburned carbon. J Colloid Interface Sci 2007; 315(1): 41-6.
13.Capasso S, Salvestrini S, Coppola E, Buondonno A, Colella C. Sorption of humic acid on zeolitic tuff: a preliminary investigation. Applied Clay Science 2005; 28(1-4): 159-65.
14.American Water Works Association. Water quality and treatment handbook. 5th ed. New York, NY: McGraw-Hill Professional; 1999.
15.Doddapaneni KK, Tatineni R, Potumarthi R, Mangamoori LN. Optimization of media constituents through response surface methodology for improved production of alkaline proteases by Serratia rubidaea. Journal of Chemical Technology and Biotechnology 2007; 82(8): 721-9.
16.Myers R, Montgomery DC. Response surface methodology: process and product optimization using designed experiments. 1st ed. New York, NY: John Wiley & Sons, Inc; 1995.
17.Babuponnusami A, Muthukumar K. Removal of phenol by heterogenous photo electro Fenton-like process using nano-zero valent iron. Separation and Purification Technology 2012; 98: 130-5.
18.Zhang WH, Quan X, Zhang ZY. Catalytic reductive dechlorination of p-chlorophenol in water using Ni/Fe nanoscale particles. J Environ Sci (China) 2007; 19(3): 362-6.
19.Tseng HH, Su JG, Liang C. Synthesis of granular activated carbon/zero valent iron composites for simultaneous adsorption/dechlorination of trichloroethylene. J Hazard Mater 2011; 192(2): 500-6.
20.Cheng W, Dastgheib SA, Karanfil T. Adsorption of dissolved natural organic matter by modified activated carbons. Water Res 2005; 39(11): 2281-90.