174 J Adv Environ Health Res, Vol. 2, No. 3, Summer 2014
Temporal and spatial variation of drinking water quality in a number of
Divandareh villages, Iran: With emphasis on fluoride distribution
Afshin Maleki Afshin Maleki Afshin Maleki Afshin Maleki1111
, Esmail Ghahremani , Esmail Ghahremani, Esmail Ghahremani , Esmail Ghahremani1111
, Yahya , Yahya, Yahya
, Yahya ZandsalimiZandsalimiZandsalimiZandsalimi1111
, Pari Teymouri , Pari Teymouri, Pari Teymouri , Pari Teymouri1111
, Hiua Daraei , Hiua Daraei , Hiua Daraei , Hiua Daraei1111
, , , , Reza Rezaee
Reza Rezaee Reza Rezaee
Reza Rezaee1111, Pegah Bahmani, Pegah Bahmani, Pegah Bahmani, Pegah Bahmani1111, Behroz Davari, Behroz Davari, Behroz Davari, Behroz Davari2222, Dariush Naghipour, , , Dariush NaghipourDariush Naghipour----KhalkhalianiDariush NaghipourKhalkhalianiKhalkhalianiKhalkhaliani3333, Enayatollah Kalantar, , , Enayatollah KalantarEnayatollah KalantarEnayatollah Kalantar1111
1 Kurdistan Environmental Health Research Center, Kurdistan University of Medical Sciences, Sanandaj, Iran 2 Department of Entomology, School of Medicine, Hamadan University of Medical Sciences, Hamadan, Iran 3 Department of Environmental Health Engineering, School of Health, Guilan University of Medical Sciences, Rasht, Iran
Abstract Abstract Abstract Abstract
Fluoride is found in all water resources at different concentrations and drinking water is the major source of fluoride exposure. Thus, because of the adverse effect of fluoride in low and high concentrations, the evaluation of its content in drinking water is necessary. In the present study, the temporal variations and spatial distribution of fluoride concentrations in the drinking water of villages in Divandareh (Kurdistan, Iran) were determined. Thus, 30 villages were selected and 180 groundwater samples were taken in 2 dry and wet seasons in the year of 2013. The concentrations of fluoride and other anions were measured using the ion chromatography (IC) method. Geospatial analysis of the data was performed using the ArcGIS geographical information system (GIS) software. The results showed that the average fluoride concentration in drinking water ranged from 0.136 to 0.736 mg/l; 90.56% of samples had a concentration less than 0.50 mg F/l, and the rest had concentrations between 0.51 and 1.0 mg F/L. Based on the results of the nonparametric Wilcoxon test, a significant difference was found between the concentrations of fluoride in the two-stage sampling (P < 0.01).
KEYWORDS: KEYWORDS: KEYWORDS:
KEYWORDS: Drinking Water, Fluoride, Geographic Information Systems, Groundwater, Water Resources
Date of submission: Date of submission: Date of submission:
Date of submission: 10 Apr 2014, Date of acceptance:Date of acceptance: Date of acceptance:Date of acceptance:25 Jun 2014
Citation: Maleki A, Ghahremani E, Zandsalimi Y, Teymouri P, Daraei H, Rezaee R, et al. Temporal and spatial variation of drinking water quality in a number of Divandareh villages, Iran: with emphasis on fluoride distribution. J Adv Environ Health Res 2014; 2(3): 174-80.
Introduction
1Groundwater is one of the most important sources for drinking and agricultural uses, and its quality is mainly affected by both natural and human factors.1 In other words, the chemical
composition of groundwater is a complex function of several variables including geological structure and mineralogy of the watersheds and aquifers, hydro-geological conditions, the
Corresponding Author Corresponding AuthorCorresponding Author Corresponding Author::::
Afshin Maleki
Email: maleki43@yahoo.com
evaporation of the water table, hydro-chemical processes within the aquifer, lithology, groundwater velocity, interaction of water with soil and rock, precipitation, and human activities.2,3 The interaction of these factors leads
to different types of water. Thus, the chemical composition of water in each area is different and can affect the health aspects of drinking water quality.4 For this reason, It is necessary to
monitor the groundwater quality, especially in areas where water quality is not desirable, the values of cations and anions (such as fluoride) in
water are above the permitted standards, and water-borne diseases have been reported.5,6
According to the World Health Organization (WHO) guidelines for drinking water quality, fluoride, arsenic, and nitrate are key chemicals that cause large scale health effects through drinking water exposure.5,7 Fluoride is necessary for human
life and drinking water is the main source of its intake. However, excessive intake of fluoride can cause a wide range of adverse health effects such as dental mottling and fluorosis.8-10 The concentration
of fluoride in water resources is a function of the factors mentioned above; therefore, determination of fluoride concentration in drinking water and its correlation with other drinking water parameters is important. Therefore, the aim of this study was to determine the concentration of major anions and cations, their correlation with F content of groundwater, and the temporal variations and spatial distribution of fluoride concentration in Divandareh villages, Kurdistan, Iran.
Materials and Methods
This research was a cross-sectional study performed to determine the quality of drinking water of 30 villages in Divandareh, Kurdistan, Iran. A total of 180 samples were taken in 2 dry and wet seasons and were analyzed according to standard methods.11 Fluoride concentration and
other anions were measured with ion chromatography (IC) method using a Metrohm 882 compact IC plus (Metrohm AG, Switzerland). Descriptive statistics and the Piper, Schuler, and Wilcox diagrams were used to interpret the results. In order to compare the results of the 2 phases of the study, SPSS software (version 16, SPSS Inc., Chicago, IL, USA) and Wilcoxon test were used. To determine the correlation between physical and chemical characteristics of water quality, Pearson correlation coefficient was used. RockWorks software (RockWare Inc., Golden, CO, USA) was used to analyze the results of chemical analysis in the studied samples. Using the results obtained from previous phases, groundwater type was determined and its application for drinking,
agricultural, and industrial purposes was assessed. Moreover, Esri's ArcGIS, a geographical information system (GIS) (version 10, Esri, Redlands, CA, USA) was used to study the spatial variation of F.
Results and Discussion
Table 1 shows the average concentrations of major anions, cations, and other physicochemical parameters in the studied groundwater samples. The variation of fluoride concentration in the studied water supplies (in dry and wet seasons) is provided in figure 1 As can be seen in figure 1, the average fluoride concentration varied from 0.136 mg/l (sample no. 17) to 0.736 mg/l (sample no. 1). About 90.56% of samples showed a fluoride concentration below 0.5 mg/l and 9.44% of them had a fluoride concentration between 0.5 and 1 mg/l. These results are in accordance with another study in Iran which showed a low concentration of fluoride in drinking water.12
Compared to drinking water quality standards for fluoride concentration, set by the Institute of Standards and Industrial Research of Iran (ISIRI)13
and the WHO5, only 9.44% of water samples have
a fluoride concentration in the permissible range and 90.56% of them have lower concentration than the permissible limit (0.5 mg/l), indicating a high probability of dental caries in the study area. Therefore, supplying fluoride through other sources, such as foodstuff, tea, and toothpastes, is recommended. Indeed water fluoridation is not recommended because of its cost especially in rural areas. Cartona's study comes to the same conclusion.14 On the other hand, the
disadvantages of high concentrations of fluoride in water are much greater than that of its scarcity. According to the Iranian Fluoride Scientific Association, fluoride concentration exceeding 0.7 mg/l in drinking water may increase disadvantages rather than desirable effects of caries prevention.10 Thus, although the lack of
176 J Adv Environ Health Res, Vol. 2, No. 3, Summer 2014
Figure 1. Fluoride concentration of different sampling sites in low- and high-water seasons
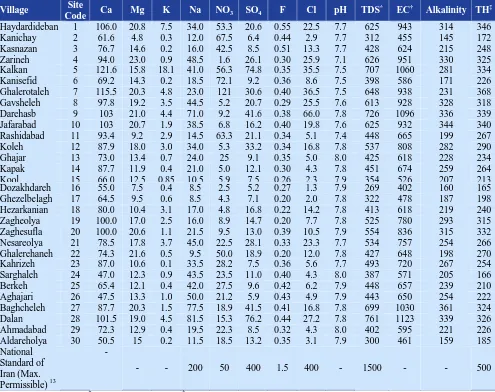
Table 1. Average values of physicochemical parameters of groundwater in rural areas
*
Total Dissolved Solids; † Electrical Conductivity; ‡ Total Hardness
All parameters are expressed in mg/l, except for pH, EC (µS/cm), Alkalinity (mg/l CaCO3), and TH (mg/l CaCO3)
0 0.2 0.4 0.6 0.8 1 1.2
0 1 2 3 4 5 6 7 8 9 10 11 12 13 14 15 16 17 81 19 20 21 22 23 24 25 26 27 28 29 30 31
F
lu
o
ri
d
e
co
n
ce
n
tr
a
ti
o
n
(m
g
/l
)
Sampling sites
High- water season Low- water season
Village Site
Code Ca Mg K Na NO3 SO4 F Cl pH TDS* EC† Alkalinity TH‡
Haydardideban 1 106.0 20.8 7.5 34.0 53.3 20.6 0.55 22.5 7.7 625 943 314 346 Kanichay 2 61.6 4.8 0.3 12.0 67.5 6.4 0.44 2.9 7.7 312 455 145 172 Kasnazan 3 76.7 14.6 0.2 16.0 42.5 8.5 0.51 13.3 7.7 428 624 215 248 Zarineh 4 94.0 23.0 0.9 48.5 1.6 26.1 0.30 25.9 7.1 626 951 330 325 Kalkan 5 121.6 15.8 18.1 41.0 56.3 74.8 0.35 35.5 7.5 707 1060 281 334 Kanisefid 6 69.2 14.3 0.2 18.5 72.1 9.2 0.36 8.6 7.5 398 586 171 226 Ghalerotaleh 7 115.5 20.3 4.8 23.0 121 30.6 0.40 36.5 7.5 648 938 231 368 Gavsheleh 8 97.8 19.2 3.5 44.5 5.2 20.7 0.29 25.5 7.6 613 928 328 318 Darehasb 9 103 21.0 4.4 71.0 9.2 41.6 0.38 66.0 7.8 726 1096 336 339 Jafarabad 10 103 20.7 1.9 38.5 6.8 16.2 0.40 19.8 7.6 625 932 344 340 Rashidabad 11 93.4 9.2 2.9 14.5 63.3 21.1 0.34 5.1 7.4 448 665 199 267 Koleh 12 87.9 18.0 3.0 34.0 5.3 33.2 0.34 16.8 7.8 537 808 282 290 Ghajar 13 73.0 13.4 0.7 24.0 25 9.1 0.35 5.0 8.0 425 618 228 234 Kapak 14 87.7 11.9 0.4 21.0 5.0 12.1 0.30 4.3 7.8 451 674 259 264 Kool 15 66.0 12.5 0.85 10.5 5.9 7.5 0.26 2.3 7.9 354 526 207 213 Dozakhdareh 16 55.0 7.5 0.4 8.5 2.5 5.2 0.27 1.3 7.9 269 402 160 165 Ghezelbelagh 17 64.5 9.5 0.6 8.5 4.3 7.1 0.20 2.0 7.8 322 478 187 198 Hezarkanian 18 80.0 10.4 3.1 17.0 4.8 16.8 0.22 14.2 7.8 413 618 219 240 Zagheolya 19 100.0 17.0 2.5 16.0 8.9 14.7 0.20 7.7 7.8 525 780 293 315 Zaghesufla 20 100.0 20.6 1.1 21.5 9.5 13.0 0.39 10.5 7.9 554 836 315 332 Nesareolya 21 78.5 17.8 3.7 45.0 22.5 28.1 0.33 23.3 7.7 534 757 254 266 Ghalerehaneh 22 74.3 21.6 0.5 9.5 50.0 18.9 0.20 12.0 7.8 427 648 198 270 Kahrizeh 23 87.0 10.6 0.1 33.5 28.2 7.5 0.36 5.6 7.7 493 720 267 254 Sarghaleh 24 47.0 12.3 0.9 43.5 23.5 11.0 0.40 4.3 8.0 387 571 205 166 Berkeh 25 65.4 12.1 0.4 42.0 27.5 9.6 0.42 6.2 7.9 448 657 239 210 Aghajari 26 47.5 13.3 1.0 50.0 21.2 5.9 0.43 4.9 7.9 443 650 254 222 Baghcheleh 27 87.7 20.3 1.5 77.5 18.9 41.5 0.41 16.8 7.8 699 1030 361 324 Dalan 28 101.5 19.0 4.5 81.5 15.3 76.2 0.44 27.2 7.8 761 1123 339 326 Ahmadabad 29 72.3 12.9 0.4 19.5 22.3 8.5 0.32 4.3 8.0 402 595 221 226 Aldareholya 30 50.5 15 0.2 11.5 18.5 13.2 0.35 3.1 7.9 300 461 159 185 National
Standard of Iran (Max. Permissible) 13
-
Other physicochemical parameters such as pH, Ca2+, Mg2+, NO3, total dissolved solids (TDS),
and total hardness (TH) were also studied. An important parameter affecting the solubility of fluoride is pH. According to Saxena and Ahmed, in acidic pH, fluoride remains in the soil; however, in alkaline pH, it is released into the water.15 According to the results, the pH value
varies from 7.1 to 8 and represents an alkaline condition that is appropriate for the solubility of fluorine-bearing minerals. However, the low fluoride concentrations in the studied groundwater indicate that there are small quantities of fluorine-bearing minerals in the soil. On the other hand, fluoride has a unique chemical ability to replace other anions. Ca2+,
Na+, OH-, and some complexing ions may change
fluoride concentration in groundwater.16,17
Therefore, fluorite dissolution is limited when the concentration of Ca2+ exceeds the limit of fluorite
solubility.18 A strong reverse correlation between
F and Ca2+ in the Ca2+-containing groundwater,
with concentrations higher than that required, has been observed by Raju et al. for the solubility of fluoride minerals.18 The Ca2+ and Na+
concentrations in groundwater vary from 47 to 121.6 mg/l and 8.5 to 81.5 mg/l, respectively. According to table 2, the average concentration of Ca2+ (82.35 mg/l) was higher than Na+ (31.3
mg/l), which may be the reason for the low fluoride concentrations in the groundwater.
Electrical conductivity (EC) and TDS showed good correlation with fluoride concentration
compared to other studied physicochemical parameters. Minimum EC of groundwater samples was around 700 µS/cm (Table 2), which placed them in the C2-S1 and C3-S1 classes; classified as slightly salty and usable brackish waters for agriculture, respectively.19 The amount
of TDS in water samples ranged between 260 and 790 mg/l. The major ions contributing to TDS are calcium, magnesium, sodium, potassium, carbonate, bicarbonate, chloride, fluoride, sulfate, and nitrate.20 According to Gaillardet et al.,
variation in TDS may be related to land use and pollution.21 Hence, animal waste, agricultural
fertilizers, and industrial and municipal wastewater are the main source of nitrate, sulfate, sodium, and chloride ions in the water environment and can be related to the TDS variation.3,22
Based on the results, TH in the groundwater samples is carbonate hardness with a mean concentration higher than 250 mg/l CaCO3. Dutta
et al. have stated that water with a fluoride concentration higher than 1.5 mg/l has a hardness less than 200 mg/l.23 Considering the
amount of fluoride and hardness in this study, the results seem reasonable. A positive correlation was observed between fluoride and Ca2+, Mg2+, and Na+. Similarly, a direct
correlation was also observed between fluoride and bicarbonate (R2꞊ 0.28) followed by chloride
(R2 ꞊ 0.16), sulfate (R2 ꞊ 0.11), and nitrate
(R2꞊ 0.08). The results are in agreement with the
findings of other researchers.4,8
Table 2. Descriptive statistics of elemental concentration for the studied parameters
Parameter (in each season) N Low-water season High-water season
Mean SD Min Max Mean SD Min Max
EC 90 782.00 217 396.00 1180.0 700.00 194.0 399.0 1100.0 TDS 90 525.00 146 261.00 784.0 468.00 130.0 275.0 737.0
pH 90 7.70 0.29 7.00 8.1 7.70 0.3 7.0 8.1
Ca 90 88.90 22.00 49.00 131.0 75.80 20.5 45.0 126.0
Mg 90 15.70 6.40 4.90 25.0 14.90 4.5 4.8 21.7
Na 90 31.80 21.20 9.00 83.0 30.60 19.7 8.0 80.0
K 90 2.60 4.30 0.20 22.8 2.10 2.8 0.1 13.4
HCO3 90 328.00 81.00 189.00 512.0 285.00 75.2 140.0 410.0
Cl 90 15.40 16.10 1.00 75.3 13.40 12.1 1.5 56.0
SO4 90 20.80 18.40 3.50 79.0 19.90 17.9 4.8 82.2
F 90 0.25 0.08 0.14 0.4 0.43 0.1 0.2 0.7
178 J Adv Environ Health Res, Vol. 2, No. 3, Summer 2014
Figure 2. Spatial distribution of fluoride in groundwater in 1: low-water seasons and 2: high-water seasons
According to figure 2, the concentration of fluoride is related to the North and Northeast part of the aquifer, which is an agricultural area with a high concentration of Ca2+, TDS, and TH.
According to the Wilcoxon test and its correlation coefficient, there is a significant difference between the fluoride ions concentration in samples taken in the dry and wet seasons (P < 0.01). However, due to the low concentration of fluoride in both periods, this difference is not important.
The average concentrations of Ca2+, Mg2+, Na+,
and K+ were 62.8%, 11.7%, 23.8%, and 1.8% of all
cations, respectively (Table 1). Average concentration of HCO3-, NO3-, SO42-, and Cl- were
83%, 7.5%, 5.6%, and 3.9% of all anions, respectively (Table 1). NO3- concentration in
around 20% of water samples was higher than the recommended standard set by ISIRI.13 This is
mostly due to agricultural activities in the area; application of different fertilizers and pesticides. Geochemical facies showed that HCO3- and Ca+
are the dominant anion and cation in the studied samples, respectively, introducing calcic-bicarbonate as the water type. Results obtained from RockWorks software showed that the rock bed in the studied villages is mainly made up of limestone, dolomite, and feldspar. Distribution of carbonate rocks in the study area and dissolution of carbonate minerals are the main source of Ca2+ and Mg2+ ions in the water. The
high concentration of HCO3- ions in the water is
due to erosion and weathering of carbonate and
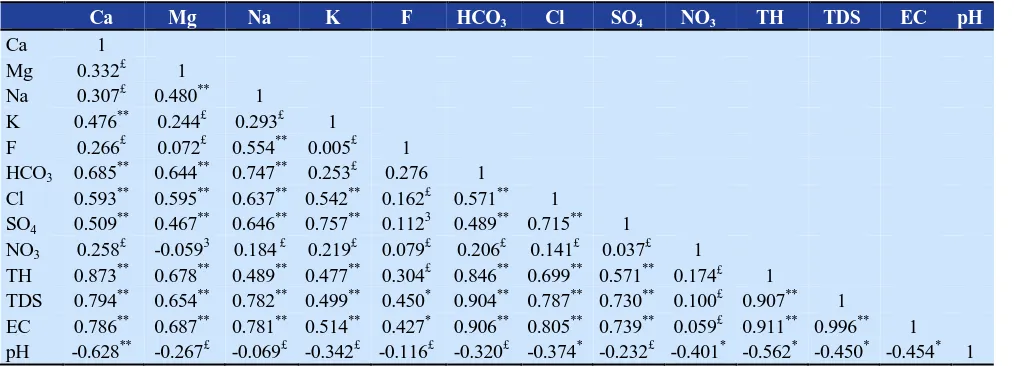
silicate minerals. Correlation coefficients between the different chemical parameters measured in the studied villages showed that the highest correlation exists between HCO
3-and Ca2+ (Table 3). The Piper diagram also
confirmed that the facies of water was calcic bicarbonate, showing that the main chemical composition of water is Ca(HCO3)2. Considering
the presence of other cations and anions in the water and existence of the correlation coefficient between them, other chemical compounds present are CaSO4, CaCl2, Mg(HCO3)2, MgSO4,
MgCl2, NaHCO3, Na2SO4, NaCl, and KCl
(depending on the specific terms of the ratio of Ca2+ to Mg2+ and Na+ to Ca2+ in each of the
studied sources).
Conclusion
Table 3.Correlation matrix of studied water quality parameters
Ca Mg Na K F HCO3 Cl SO4 NO3 TH TDS EC pH
Ca 1
Mg 0.332£ 1
Na 0.307£ 0.480** 1
K 0.476** 0.244£ 0.293£ 1
F 0.266£ 0.072£ 0.554** 0.005£ 1
HCO3 0.685** 0.644** 0.747** 0.253£ 0.276 1
Cl 0.593** 0.595** 0.637** 0.542** 0.162£ 0.571** 1 SO4 0.509
**
0.467** 0.646** 0.757** 0.1123 0.489** 0.715** 1 NO3 0.258
£
-0.0593 0.184 £ 0.219£ 0.079£ 0.206£ 0.141£ 0.037£ 1
TH 0.873** 0.678** 0.489** 0.477** 0.304£ 0.846** 0.699** 0.571** 0.174£ 1
TDS 0.794** 0.654** 0.782** 0.499** 0.450* 0.904** 0.787** 0.730** 0.100£ 0.907** 1
EC 0.786** 0.687** 0.781** 0.514** 0.427* 0.906** 0.805** 0.739** 0.059£ 0.911** 0.996** 1 pH -0.628** -0.267£ -0.069£ -0.342£ -0.116£ -0.320£ -0.374* -0.232£ -0.401* -0.562* -0.450* -0.454* 1 *
Correlation is significant at the 0.05 level; ** Correlation is significant at the 0.01 level; £ Non-significant; EC: Electrical conductivity;
TDS: Total dissolved solids; TH: Total hardness
Conflict of Interests
Authors have no conflict of interests.
Acknowledgements
The authors are grateful for the financial support provided by Governor Generalship of Kurdistan Province, Iran.
References
1. Jeong CH. Effect of land use and urbanization on hydrochemistry and contamination of groundwater from Taejon area, Korea. Journal of Hydrology 2001; 253(1-4): 194-210.
2. Andre L, Franceschi M, Pouchan P, Atteia O. Using geochemical data and modelling to enhance the understanding of groundwater flow in a regional deep aquifer, Aquitaine Basin, south-west of France. Journal of Hydrology 2005; 305(1-4): 40-62.
3. Ostovari Y, Zar Sh, Harchegani H, Asgari K. Effects of geological formation on groundwater quality in Lordegan Region, Chahar-mahal-va-Bakhtiyari, Iran. International Journal of Agriculture and Crop Sciences 2013; 5(17): 1983-92.
4. Maleki A, Teymouri P, Rahimi R, Rostami M, Amini H, Daraei H, et al. Assessment of chemical quality of drinking water in rural area of Qorveh city, Kurdistan province, Iran. J Adv Environ Health Res 2014; 2(1): 22-9.
5. World Health Organization. Guidelines for
Drinking-Water Quality. 4th ed. Geneva, Switzerland: World Health Organization; 2011.
6. Nouri J, Mahvi AH, Babaei A, Ahmadpour A. Regional pattern distribution of groundwater fluoride in the Shush aquifer of Khuzestan County, Iran. Fluoride 2006; 39(4): 321-5.
7. Mahvi AH, Zazoli MA, Younecian M. Survey of fluoride concentration in drinking water sources and prevalence of DMFT in the 12 years old students in Behshahr city. J Med Sci 2006; 6(4): 658-61.
8. Dobaradaran S, Mahvi AH, Dehdashti S, Dobaradaran S, Shoara R. Correlation of fluoride with some inorganic constituents in groundwater of Dashtestan, Iran. Fluoride 2002; 42(1): 50-3.
9. Dobaradaran S, Mahvi AH, Dehdashti S, Ranjbar D, Abadi V. Drinking water fluoride and child dental caries in Dashtestan, Iran. Fluoride 2002; 41(3): 220-6. 10.Dobaradaran S, Mahvi AH, Dehdashti S. Fluoride
content of bottled drinking water available in Iran. Fluoride 2008; 41(1): 93-4.
11.Eaton AD, Franson MA. Standard Methods for the Examination of Water & Wastewater. Washington, DC: American Public Health Association; 2005.
12.Azami-Aghdash S, Ghojazadeh M, Pournaghi AF, Naghavi-Behzad M, Mahmoudi M, Jamali Z. Fluoride concentration of drinking waters and prevalence of fluorosis in iran: a systematic review. J Dent Res Dent Clin Dent Prospects 2013; 7(1): 1-7.
13.Institute of Standards and Industrial Research of Iran. Drinking water -Physical and chemical specifications. ISIRI No. 1053, the 5th Revision [Online]. [cited 2009]; Available from: URL:
180 J Adv Environ Health Res, Vol. 2, No. 3, Summer 2014
yID=5f6bbf1b-ac23-4362-a309-9ee95a439628
14.Cartona RJ. Review of the 2006 united states national research council report: fluoride in drinking water. FLUORIDE 2006; 39(3): 163-72.
15.Saxena V, Ahmed S. Dissolution of fluoride in groundwater: a water-rock interaction study. Environmental Geology 2001; 40(9): 1084-7.
16.Wenzel WW, Blum WE. Fluorine speciation and mobility in f-contaminated soils. Soil Sci 1992; 153(5): 357-64.
17.Raju DV, Raju NJ, Kotaiah B. Complexation of fluoride ions with alum-flocs at various pH values during coagulation and flocculation. Journal-Geological Society of India 1993; 42: 51-4.
18.Raju NJ, Dey S, Das K. Fluoride contamination in groundwaters of Sonbhadra District, Uttar Pradesh, India. Current Science 2009; 96(7): 979-85.
19.Yidana S, Sakyi P, Stamp G. Analysis of the Suitability of Surface Water for Irrigation Purposes: The
Southwestern and Coastal River Systems in Ghana. Journal of Water Resource and Protection 2011; 3(10): 695-710.
20.Environmental Protection Agency. Quality criteria for water. Washington, DC: US Environmental Protection Agency; 1976.
21.Gaillardet J, Dupre B, Louvat P, Allegre CJ. Global silicate weathering and CO2 consumption rates deduced from the chemistry of large rivers. Chemical Geology 1999; 159(1-4): 3-30.
22.Han G, Liu CQ. Water geochemistry controlled by carbonate dissolution: a study of the river waters draining karst-dominated terrain, Guizhou Province, China. Chemical Geology 2004; 204(1-2): 1-21. 23.Dutta J, Nath M, Chetia M, Misra AK. Monitoring of