A b s t r a c t. This paper presents the results of a study into the use of the texture parameters of barley kernel images in varietal classification. A total of more than 270 textures have been calcula-ted from the surface of single kernels and bulk grain. The measure-ments were performed in four channels from a 24 bit image. The results were processed statistically by variable reduction and general discriminant analysis. Classification accuracy was more than 99%.
K e y w o r d s: digital image analysis, automated kernel grading, image texture analysis, discrimination, barley
INTRODUCTION
Grading systems rely on visual inspection and a compa-rison of kernel samples. Grading decisions concerning ker-nels and other cereal grains require a visual inspection of the sample by trained personnel. Despite training, grading deci-sions are subjective and they are affected by the inspector individual experience. Digital image analysis provides an alternative to the manual classification of biological pro-ducts by integrating an image acquisition device with a com-puter (Jayaset al., 2000). Digital image analysis is believed to generate more accurate and consistent results than ana-lyses performed by humans, delivering an objective measu-re of the studied product featumeasu-res. Most kernel featumeasu-res ana-lyzed in a subjective grain inspection can be rapidly measu-red using machine vision. The application of digital image processing (especially image texture analysis and its classi-fication) could increase the number of correctly classified samples, thereby limiting the necessity of using less objecti-ve methods for grain classification. Varietal classification of kernel samples using machine vision is an objective and a quantitative method of measurement delivering highly re-liable grading parameters.
The boundary coordinates of an object can be used to ex-tract morphological features (Emadzadehiet al., 2010; Jayas et al., 2000). Morphological features are widely used in automatic grading, sorting, detection as well as quality inspe-ction of food products (Gancarzet al., 2007; Jayaset al., 2000). Grading systems relying on different morphological features in the classification of cereal grains and varieties have been reported in literature (Choudhary et al., 2009; Courtoiset al.,2010; Majumdar and Jayas, 2000c; Tahiret al., 2007). Majumdar and Jayas (2000c) present an imaging sys-tem and classification results for Canada Western Red Spring (CWRS) wheat, Canada Western Amber Durum (CWAD) wheat, barley, oats and rye using an algorithm based on mor-phological features. The above authors used 23 morpholo-gical features for the discriminant analysis. The classifica-tion accuracy for CWRS and CWAD wheat, barley, oats and rye was 98.9, 91.6, 97.9, 100 and 91.6%, respectively, when the model was tested on a data set (the total number of kernels used was 31 500).
The features extracted from the properties of pixels inside an object are called internal image features. The most important internal features are colour and image texture. Some investigations dealing with the use of different colour features were conducted for the purpose of classifying diffe-rent cereal grains and their varieties (Neumanet al.,1989a, b; Majumdar and Jayas, 2000a). Majumdar and Jayas (2000c) developed an algorithm based on colour features for the classification of individual kernels of CWRS and CWAD wheat, barley, oats and rye. The above authors used 18 colour features (including mean, variance, range of red, green and blue, hue, saturation and intensity) for the discriminant ana-lysis. The reported classification accuracy for CWRS and CWAD wheat, barley, oats and rye was 95.7, 94.4, 94.2, 97.6, and 92.5%, respectively, when the model was tested on a data set (the total number of kernels used was 31 500).
Int. Agrophys., 2012, 26, 81-90 doi:10.2478/v10247-012-0012-z
Application of image texture analysis for varietal classification of barley*
P. Zapotoczny
Department of Agri-Food Process Engineering, University of Warmia and Mazury, Heweliusza 14, 10-718 Olsztyn, Poland
Received February 22, 2011; accepted April 15, 2011
© 2012 Institute of Agrophysics, Polish Academy of Sciences
Corresponding author’s e-mail: [email protected]
*The paper was financed from the budget for science in Poland, grant No. 4498/B/P01/2010/39 2010-2013.
A A
Agggrrroooppphhyhyysssiiicccsss
The texture of a segmented area is an important feature for area description, which quantifies some characteristics of the grey-level variation within the object. Four types of methods: statistical, structural, transform-based, and model-based are the most commonly used in the practice of extract-ing textural features. Dependextract-ing on the number of pixels defining the local feature, statistical approaches can be sub-divided into first, second, and higher-order statistics. The features calculated using first-order statistics of an image are not textural features because they depend only on the inten-sity of individual pixels, and they are independent of the adjacent pixels. This features simply describes the grey level histogram of an image (Chandraratneet al.,2006). Chandra-ratneet al.(2006) defined second-order statistics as the like-lihood of observing a pair of grey values occurring at the end points of a dipole of random length placed in the image at a random location and orientation. These are the properties of pairs of pixel values. The pixel-value run length matrix (GLRM) encompasses higher-order statistics of the grey level histogram (Majumdar and Jayas, 2000c). Higher-order statistics estimate the properties of three or more pixels occurring at specific locations relative to each other. How-ever, several texture description methods are based on the Fourier spectrum, wavelet transform and fractal dimension (Liet al.,2001; Quevedoet al.,2002). The success of these techniques lies in the type of transform used to extract textu-ral features from the image (Bharatiet al.,2004). Finally, model-based texture analysis techniques generate an em-pirical model of each pixel in the image based on a weighted average of pixel intensities in its neighborhood.
Majumdar and Jayas (2000c) developed a digital image analysis (DIA) algorithm based on the textural features of individual grains to facilitate the classification of individual kernels of CWRS and CWAD wheat, barley, oats and rye. The textural features of individual kernels were extracted from different colours of images to determine the colour or the colour band combination that delivered the highest classification accuracy in cereal grains. A total of 25 texture features were used in the discriminant analysis (10 GLCM features, 12 GLRM features, and 3 grey level features). The original grey level value (250) was reduced to 32, 16, 8, and 4 grey level values, and the textural features extracted from each case were used in classification. The textural features extracted from the green colour band at maximum grey level value 8 produced the highest classification accuracy in cereal grains. Using the 15 most significant features, the authors demonstrated that the classification accuracy of CWRS and CWAD wheat, barley, oats and rye was 87.0, 95.7, 100.0, 100.0, and 81.8%, respectively, when the model was tested on a data set.
The overall aim of this research was to develop a machine vision system for identifying 5 varieties of Polish spring barley. The classification accuracy of 5 barley varieties was deter-mined using morphological and texture features.
Therefore, the objective of this study was to determine: – the suitability of morphological features for the
classifi-cation of individual kernels of 5 barley varieties; – the suitability of texture features for the classification of
individual kernels of 5 barley varieties;
– the effect of different colours (L, V, S) on classification accuracy.
MATERIALS AND METHODS
The experimental material comprised kernels of five varieties of Polish two-rowed spring barley: Blask, Stratus, STH 5604, STH 9731, STH 523. The material was harvested in 2005. The grain samples used in this study were obtained from the experimental plots of a plant breeding company in Strzelce. Kernel texture parameters were measured in indi-vidual kernels and in bulk (Fig. 1). The region of interest (ROI) for individual kernels was the area of kernel pro-jection (550 kernels were analyzed) and, additionally, the successive combination of pixels from the surface of five kernels. A total of 64 random selected ROIs were studied in bulk (the region was a square of 550 x 550 pixels). Two scans were performed in bulk to measure 128 ROIs. A tex-ture analysis was performed in four channels: brightness Y, saturation S, channels V (V=701B-114R-587G/1402) and U (U=886R-587G-299B/1227). Kernels were scanned in the Epson 4490 Photo flat scanner. The produced images were saved in 2754 x 4172 pixel format with 400 dpi resolution and 24-bit depth. Image analyses and texture measurements were carried out in the MaZda v. 4.5 application. From every ROI, 277 textures were identified for each channel. The fea-ture set used in this research (almost 277 parameters) was di-vided into the following groups: histogram, co-occurrence matrix (GLCM), run-length matrix (GLRM), gradient matrix, autoregressive model and Haar wavelet derived features. The list of textural features, as proposed by Materka (1999), Zieliñski and Strzelecki (2002), contains parameters based on a global statistical analysis of the grey level histogram: – mean value of lightness,m,
– variance of lightness distribution,s2, – histogram skewness,m3,
– histogram kurtosis,m4; parameters calculated on the basis of a gradient matrix:
• mean value of the absolute value of gradient,GrMean, • variance of the absolute value of gradient,GrVariance, • skewness of the absolute value of gradient,GrSkewness, • kurtosis of the absolute value of gradient,GrKurtosis;
parameters calculated based on the length of the pixel sequence matrix:
– inversive second-order moment marking the influence of short sequences (short run emphasis inverse moment), ShrtREmph,
– inversive second-order moment marking the influence of long sequences (long run emphasis inverse moment), LngREmph,
– non-uniform distribution of lightness level values, GLevNonUni,
– non-uniform distribution of sequence length values, RLNonUni,
– fraction of sequences in image, Fraction; parameters calculated on the basis of the co-occurrence matrix: • angular second-order moment,AngScMom, • contrast,Contrast,
• correlation,Correlat,
• variance of boundary distribution ,SumOfSqs, • inverse differential moment,InvDfMom,
• mean value of accumulative distribution,SumAverg, • variance of accumulative distribution,SumVarnc, • entropy of accumulative distribution,SumEntrp, • entropy,Entropy,
• variance of differential distribution,DifVarnc, – entropy of differential distribution,DifEntrp;parameters
calculated in the domain of image frequency:
• % fraction of maximum element of amplitudal spectrum in the entire image spectrum,Ep(u,v),
• Laplacian maximum spectrum,Lp,
• distance of maximum spectrum from the centre of the coordinate system,Rp2,
• angle of maximum spectrum,Ap2.
Data classification is one of main areas of interest in machine learning. Data may be classified under supervision or an unsupervised system may be applied. As regards the former, the classification error is estimated, and with regard to the latter – clusterization quality is assessed. Regardless of the applied method, the correctness of classification is determined by the discriminant ability of object attributes. In these types of problems, a decision has to be made as regards the number of objects and descriptive attributes that will guarantee the highest discriminant ability. Researchers should always be aware of the ‘curse of dimensionality’. Foley (1972) proposed a formula for determining the mini-mum number of objects where the maximini-mum error of the Bayesian classifier in a training set is not higher than 15%:
Q/N> 3, (1)
where:Q– number of objects,N– number of attributes. The above rule has been applied in this study.
Another serious problem in the choice of classification methodology is the ratio of non-significant to significant at-tributes. Even in the presence of attributes characterized by high discriminant ability, the information about the set may not be reliable when the strength of those attributes is ‘drowned out’ by non-significant parameters. For this rea-son, methods for reducing attribute space are applied. Attribute extraction or reduction methods may be deployed (Fisher coefficient, probability of error and average correla-tion coefficient and mutual informacorrela-tion). The three discus-sed attribute reduction methods have been applied in this study. Each method was employed to select 10 variables showing the greatest discriminant effect on the population. At the last stage, a general discriminant analysis (GDA) was performed for varietal classification. Prior to the analyses, variables were standardized in line with the below formula:
xj=x-x
d , (2)
where:xj– standardized variable,x– original variable,x– mean value,d– standard deviation.
RESULTS AND DISCUSSION
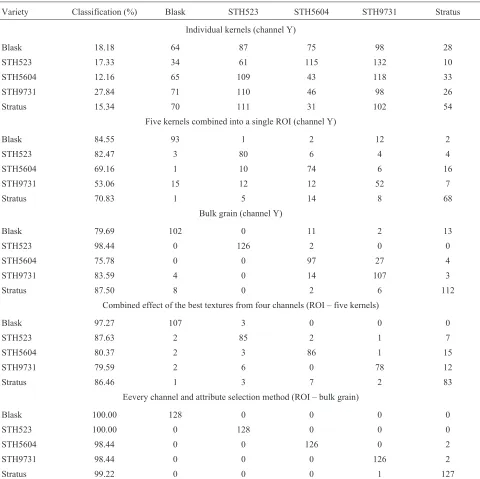
The discrimination of barley varieties based on textures calculated from the surface of a single kernel produced unsatisfactory results. Classification error was higher than 50% regardless of the attribute selection method and the applied discriminant analysis. The above could be due to the fact that textures were calculated from an insufficient area where organized structures could not be located. Sample results of varietal classification for channelYare presented in Table 1. The results of a linear discriminant analysis (LDA) are shown in Fig. 2.Varietal classification based on variables from five kernels combined into a single ROI in channels Y, V, U, S. To account for the produced results, the applied software was modified to combine the surface of several kernels into a single ROI. In theory, the objective of this procedure was to enable the calculation of textures from a higher number of pixels, thus improving classification quality.
Subject to variety, classification accuracy ranged from 53.06 to 84.55% (Table 1). Unsatisfactory results were reported for variety STH 97. Individual, incorrectly classi-fied cases were recognized in all of the analyzed experi-mental groups. Textures based on sum entropy, entropy and discrete wavelet transform were most often selected. The most effective discriminating variables from every selection method are presented in Table 2. The texture analysis performed in other channels (S, V, U) did not improve discrimination quality which was reported in the range of 56-85%. The best results were noted for var. Blask, and the least satisfactory results – for var. Stratus (Table 3).
In view of the results of previous analyses, a model ac-counting for the nine best variables from every channel was built to improve discrimination quality in further analyses. It was assumed that the combined effect of selected variables from each channel will have a much greater discriminant power than the variables from a single channel. The results of analyses for all investigated varieties are presented in Table 1. Discrimination quality was significantly impro-ved, reaching 97.27% for var. Blask. The classification qua-lity of var. Stratus also showed an improvement (86.46%). Discriminant function coefficients for the selected va-riables are presented in Table 4. Only vava-riables with coef-ficient value higher than 1 are displayed. The results of the
Variety Classification (%) Blask STH523 STH5604 STH9731 Stratus
Individual kernels (channel Y)
Blask 18.18 64 87 75 98 28
STH523 17.33 34 61 115 132 10
STH5604 12.16 65 109 43 118 33
STH9731 27.84 71 110 46 98 26
Stratus 15.34 70 111 31 102 54
Five kernels combined into a single ROI (channel Y)
Blask 84.55 93 1 2 12 2
STH523 82.47 3 80 6 4 4
STH5604 69.16 1 10 74 6 16
STH9731 53.06 15 12 12 52 7
Stratus 70.83 1 5 14 8 68
Bulk grain (channel Y)
Blask 79.69 102 0 11 2 13
STH523 98.44 0 126 2 0 0
STH5604 75.78 0 0 97 27 4
STH9731 83.59 4 0 14 107 3
Stratus 87.50 8 0 2 6 112
Combined effect of the best textures from four channels (ROI – five kernels)
Blask 97.27 107 3 0 0 0
STH523 87.63 2 85 2 1 7
STH5604 80.37 2 3 86 1 15
STH9731 79.59 2 6 0 78 12
Stratus 86.46 1 3 7 2 83
Eevery channel and attribute selection method (ROI – bulk grain)
Blask 100.00 128 0 0 0 0
STH523 100.00 0 128 0 0 0
STH5604 98.44 0 0 126 0 2
STH9731 98.44 0 0 0 126 2
Stratus 99.22 0 0 0 1 127
analyses suggest that the first three discriminant functions had the most profound effect on class differentiation. The variation explained by those functions reached 97%. The most frequently occurring texture variables were obtained from channel S, including textures (5,0) SumEntrp,(3,0) SumEntrpwhich had the greatest effect on discrimination in each function.
The coefficients standardized for canonical variables may be used to compare the magnitude and the direction of the variables share of every canonical function. The value of canonical averages describing the discriminant capacity of every variety are presented in Fig. 3 and Table 4. Varieties Blask and Stratus were best identified by the first discrimi-nant function, varieties STH 5694, STH 9731 – by the se-cond discriminant function, and var. STH 523 – by the third function. As shown by the results in Table 4, the fourth function had practically no effect on classification.
Bulk grain images were the next class of analyzed ima-ges. Four channels were examined, and the ROI was a ran-domly selected fragment of the image. The types of textures obtained from channel Y are presented in Table 2. The re-sults of the discriminant analysis are shown in Table 1. Classification quality was between 75 and 98%.
The most discriminant textures calculated from channel Ywere textures based on the discrete wavelet transform.
Similarly to previous results, the textures calculated in the remaining channels did not improve discrimination quality. The best result was noted for channel S where var. STH 523 was identified with more than 99% effectiveness. The least satisfactory results were reported for varieties Blask and STH 9731 (Table 3).
At the last stage, the results were analyzed by building a model of the three best variables from every selection method and channel, followed by an assessment of classification Number
Method of discrimination
F POE+ACC MI
Texture features Five kernels combined into a single ROI
1 S(0,5)Entropy 135dr_GLevNonU S(0,5)Entropy
2 S(5,0)SumEntrp WavEnHH_s-4 S(2,2)SumEntrp
3 S(0,4)Entropy S(1,0)DifVarnc S(5,0)SumEntrp
4 S(5,5)SumEntrp Teta1 45dgr_GLevNonU
5 S(4,0)SumEntrp WavEnHH_s-5 S(4,0)SumEntrp
6 S(2,2)SumEntrp WavEnHL_s-4 S(3,0)SumEntrp
7 S(4,4)SumEntrp WavEnHL_s-5 S(3,3)SumEntrp
8 S(3,3)SumEntrp S(4,-4)Entropy S(0,4)Entropy
9 S(2,-2)SumEntrp S(0,4)Correlat S(5,5)SumEntrp
10 S(3,0)SumEntrp S(3,-3)Entropy S(2,-2)SumEntrp
Bulk grain (channel Y)
1 Perc. 99% WavEnHH_s-8 S(3,0)SumAverg
2 S(5,0)SumAverg Perc.99% Perc.90%
3 45dgr_LngREmph S(5,5)Correlat WavEnLL_s-8
4 WavEnLL_s-7 S(5,0)DifEntrp WavEnLL_s-6
5 WavEnLL_s-6 GrNonZeros WavEnLL_s-3
6 WavEnLL_s-4 WavEnHL_s-8 WavEnLL_s-7
7 WavEnLL_s-3 WavEnLH_s-8 WavEnLL_s-4
8 WavEnLL_s-2 WavEnHH_s-6 WavEnLL_s-1
9 WavEnLL_s-1 WavEnHH_s-7 WavEnLL_s-2
10 WavEnLL_s-5 WavEnLL_s-8 WavEnLL_s-5
Variety Classification (%) Blask STH523 STH5604 STH9731 Stratus ROI- five kernels
Channel V
Blask 86.36 95 0 2 8 5
STH523 81.44 0 79 4 9 5
STH5604 72.90 4 8 78 4 13
STH9731 72.45 4 5 3 71 15
Stratus 63.54 8 3 19 5 61
Channel U
Blask 86.36 95 1 8 2 4
STH523 70.10 3 68 9 12 5
STH5604 59.18 5 11 58 11 13
STH9731 64.49 3 13 2 69 20
Stratus 56.25 4 6 8 24 54
Channel S
Blask 85.45 94 2 2 10 2
STH523 82.47 3 80 1 11 2
STH5604 74.77 3 2 80 4 18
STH9731 57.14 9 13 6 56 14
Stratus 61.46 7 0 21 9 59
ROI- bulk grain Channel V
Blask 71.88 92 0 10 14 12
STH523 97.66 0 125 0 3 0
STH5604 82.03 14 0 105 0 9
STH9731 82.64 5 7 1 119 12
Stratus 77.68 11 0 11 3 87
Channel U
Blask 75.78 97 4 0 27 0
STH523 96.88 4 124 0 0 0
STH5604 85.16 0 0 109 3 16
STH9731 79.86 13 0 3 115 13
Stratus 83.04 3 0 8 8 93
Channel S
Blask 68.75 88 8 1 27 4
STH523 99.22 1 127 0 0 0
STH5604 85.16 0 0 109 3 16
STH9731 70.14 24 0 3 101 16
Stratus 83.93 0 0 11 7 94
Texture features Channel Root1 Root2 Root3 Root4 Five kernels combined into a single ROI
(5,0)SumEntrp S 3.49 3.32 2.18
-45dgr_GLevNonU V - -1.18 1.33
-(4,-4)Entropy S 1.23 - 1.08
-(3,0)SumEntrp S -5.85 -4.71 -3.39
-(2,-2)SumEntrp S 2.60 3.82 - -1.61
Horzl_RLNonUni S - - -3.21 -1.24
45dgr_RLNonUni S - - 1.46 2.63
(4,-4)SumEntrp S - -1.68 - 1.73
Vertl_Fraction V - - - -2.31
S(0,1)DifEntrp V - -1.42 - 2.47
135dr_RLNonUni S - 1.11 - -1.36
S(5,-5)DifEntrp V - -1.09 -
-Cumulative percent 0.47 0.82 0.97 1.00
Bulk grain
S(0,2)SumAverg V 16.51 -23.72 12.30 5.50
WavEnLL_s-1 Y - -1.33 -1.55 -2.71
S(3,0)SumAverg S 1.18 13.57 -36.57 49.66
S(2,0)SumAverg U 8.32 251.13 -359.28 -88.96
WavEnLL_s-2 V -7.62 8.17 -1.81 7.97
S(2,-2)SumAverg S 34.61 -15.72 29.95 47.25
WavEnLL_s-1 V 15.82 -3.35 -2.20 1.98
S(4,0)SumAverg Y - -14.57 36.37 -49.61
S(3,0)SumAverg U 30.55 -226.70 400.18 -34.92
S(4,0)SumAverg U -26.19 -29.28 -35.95 146.27
S(2,2)SumAverg V -320.60 -204.45 -219.94 -117.02
S(2,-2)SumAverg V 295.24 226.24 208.98 96.88
S(3,0)SumAverg S 29.45 -242.79 276.51 280.74
Mean S 47.31 -6.81 45.54 46.68
S(0,1)SumAverg S -40.40 46.31 -60.78 -58.29
S(2,0)SumAverg S -58.25 212.98 -282.29 -286.72
Cumulative percent 0.64 0.82 0.97 1.00
Bulk grain
WavEnLL_s-8 U -0.95 0.077 0.80 -0.37
WavEnLL_s-8 Y -0.40 0.495 0.94 -0.07
Perc.99% Y 0.03 0.591 -0.30 -1.33
S(0,2)SumAverg V -2.14 0.963 -2.10 0.63
WavEnLL_s-1 S 1.90 -0.990 1.69 -0.95
Percent 90% Y 0.60 0.048 0.37 1.34
Cumulative percent 0.68 0.88 0.99 1.00
Fig. 3.Dispersion of canonical values of: a – root 2 vs. root 1, b – root 3 vs. root 1, c – root 3 vs. root 2, d – root 4 vs. root 2, e – root 2 vs. root 1, f – root 3 vs. root 1, g – 4 vs. root 1, h – root 3 vs. root 2.
-6 - 4 - 2 0 2 4 6 8
Root1 - 8 - 6 - 4 - 2 0 2 4 6 8 1 0 R o o t2 BLASK_5 STH523_5 STH5694_5 STH9731_5 STRATUS_5 Root2
-8 -6 -4 -2 0 2 4 6 8
Root2 -5 -4 -3 -2 -1 0 1 2 3 4 5 6 7 R o o t3 BLASK_5 STH523_5 STH5694_5 STH9731_5 STRATUS_5 Root3
-8 -6 -4 -2 0 2 4 6 8
Root2 -4 -3 -2 -1 0 1 2 3 4 5 R o o t4 BLASK_5 STH523_5 STH5694_5 STH9731_5 STRATUS_5 Root4
-6 -4 -2 0 2 4 6 8
Root1 -5 -4 -3 -2 -1 0 1 2 3 4 5 6 7 R o o t3 BLASK_5 STH523_5 STH5694_5 STH9731_5 STRATUS_5 Root3
-10 -8 -6 -4 -2 0 2 4 6 8 10 12 Root1 -6 -4 -2 0 2 4 6 8 10 12 R o o t2 BLASK_mass STH523_mass STH5604_mass STH9731_mass STRATUS_mass Root2
quality. A statistical model comprising 37 variables from four channels and three selection methods significantly improved discrimination effectiveness which reached 100% for varieties Blask and STH 523, while more than 98% correct classifications were reported in the remaining varie-ties (Table 1).
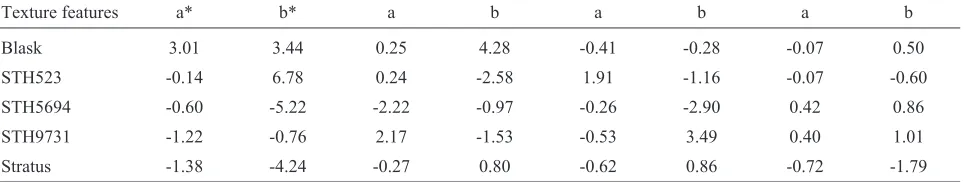
Four discriminant functions were isolated, and the first three explained variation in 97%. Textures with values higher than 1 are presented in Table 4. The highest number of variables in the final model were derived from channelsS andV. The values of variable coefficients were high, rea-ching more than 200 for textures S(2,2) SumAvergand S(2,-2) SumAverg. The canonical values for discriminant functions classifying varieties are presented in Table 5. Var. Blask was discriminated by the first and the second function, var. STH 523 – by the first function and much less by the second function, var. STH 5694 – by the second and the third function, var. STH 9731 – by the third function, and var. Stratus – by the first function. The above results are presented in Fig. 3.
Table 4 and Fig. 3 present the final results of the classification of barley varieties based on the minimum number of variables that support the highest classification quality. Six variables from channelsY, S, andUwere se-lected. Discrimination quality did not deteriorate in compa-rison with the models featuring a higher number of va-riables. Discrimination quality ranged from 99 to 100%. The lowest discrimination effectiveness was reported for var. Stratus, but the noted result was satisfactory.
CONCLUSIONS
1. The most satisfactory discrimination results were ob-tained by analyzing texture parameters in bulk grain images.
2. A statistical model comprising textures from the mea-surement of the four analyzed channels was built to improve discrimination quality. This approach contributed to more than 99% classification effectiveness.
3. The variable set was limited to six variables from three channels. An equal number of textures was investi-gated using wavelet analysis and statistical models.
Fig. 3.Continuation.
-1 0 -8 -6 -4 -2 0 2 4 6 8 1 0 1 2
Root1
-6 -5 -4 -3 -2 -1 0 1 2 3 4 5 6 7
R
o
o
t4
B LA SK _ma s s STH 5 2 3 _ ma ss STH 5 6 0 4 _m as s STH 9 7 3 1 _m as s STR A TU S_ ma s s
Root4
-6 -4 -2 0 2 4 6 8 1 0
Root2
-8 -6 -4 -2 0 2 4 6 8 10
R
o
o
t3
B LA SK _ ma s s STH 5 2 3 _ma s s STH 5 6 0 4_ ma s s STH 9 7 3 1_ ma s s STR A TU S_ ma ss
Root3
Texture features a* b* a b a b a b
Blask 3.01 3.44 0.25 4.28 -0.41 -0.28 -0.07 0.50
STH523 -0.14 6.78 0.24 -2.58 1.91 -1.16 -0.07 -0.60
STH5694 -0.60 -5.22 -2.22 -0.97 -0.26 -2.90 0.42 0.86
STH9731 -1.22 -0.76 2.17 -1.53 -0.53 3.49 0.40 1.01
Stratus -1.38 -4.24 -0.27 0.80 -0.62 0.86 -0.72 -1.79
*a – five kernels combined into a single ROI, b – bulk grain.
T a b l e 5.Canonical averages for every variety
REFERENCES
Bharati Manish H., Liu J.J., and MacGregor F., 2004.Image
texture analysis: methods and comparisons. Chemometrics and Intelligent Laboratory Systems, 72, 57-71.
Chandraratne M.R., Samarasinghe S., Kulasiri D., and
Bickerstaffe R., 2006.Prediction of lamb tenderness using
image surface texture features. J. Food Eng., 77, 492-499.
Choudhary R., Paliwal J., and Jayas D.S., 2009.Classification
of cereal grains using wavelet, morphological, colour, and textural features of non-touching kernel images. Biosys. Eng., 99, 330-337.
Courtois F., Faessel M., and Bonazzi C., 2010. Assessing
break-age and cracks of parboiled rice kernels by imbreak-age analysis techniques. Food Control, 21, 567-572.
Emadzadeh B., Razavi S.M.A., and Farahmandfar R., 2010.
Monitoring geometric characteristics of rice during proces-sing by image analysis system and micrometer measu-rement. Int. Agrophys., 24, 21-27.
Foley D.H., 1972.Considerations of sample and feature size. IEEE
Trans. Information Theory, 18, 618-626.
Gancarz M., Konstankiewicz K., Pawlak K., and Zdunek A.,
2007.Analysis of plant tissue images obtained by confocal
tandem scanning reflected light microscope. Int. Agro-physics, 21, 49-53.
Jayas D.S., Paliwal J., and Visen N.S., 2000. Multi-layer neural
networks for image analysis of agricultural products. J. Agric. Eng. Res., 77(2), 119-128.
Li J., Tan J., and Shatadal P., 2001.Classification of tough and
ten-der beef by image texture analysis. Meat Sci., 57, 341-346.
Majumdar S. and Jayas D.S., 2000a. Classification of cereal grains using machine vision: I. Morphology models. Am. Soc. Agric. Eng., 43(6), 1669-1675.
Majumdar S. and Jayas D.S., 2000b.Classification of cereal grains using machine vision: II. Color Models. Morphology models.Am. Soc. Agric. Eng.,43(6), 1677-1680.
Majumdar S. and Jayas D.S., 2000c. Classification of cereal grains using machine vision: III. Texture Models. Morpho-logy models. Am. Soc. Agric. Eng., 43(6), 1681-1687.
Materka A. and Strzelecki M., 1998.Texture Analysis Methods
– A Review. Technical University of £ódŸ, Institute of Electronics, COST B11 report, Brussels, Belgium.
Neuman M., Sapristein H.D., Shwedyk E., and Bushuk W.,
1989a. Wheat grain color analysis by digital image
pro-cessing: I. Methodology. J. Cereal Sci., 10(3), 175-182.
Neuman M., Sapristein H.D., Shwedyk E., and Bushuk W.,
1989b. Wheat grain color analysis by digital image
pro-cessing: II. Wheat class determination. J. Cereal Sci., 10(3), 183-188.
Quevedo R., Carlos L.G., Aguilera J.M., and Cadoche L., 2002. Description of food surfaces and microstructural changes using fractal image texture analysis. J. Food Eng., 53, 361-371.
Tahir A.R., Neethirajan S., Jayas D.S., Shahin M.A., Symons
S.J., and White N.D.G., 2007.Evaluation of the effect of
moisture content on cereal grains by digital image analysis. Food Res. Int., 40, 1140-1145.
Zieliñski K. and Strzelecki M., 2002.Computerized Analysis of