International Journal of Recent Scientific Research
Vol. 8, Issue, 3, pp. 16256-16260, March, 2017ISSN: 0976-3031
Research Article
Recent Scientific
Research
DOI: 10.24327/IJRSR
PREVALENCE OF METABOLIC SYNDROME AND ITS ASSOCIATION WITH
VARIOUS RISK FACTORS
Suprava Patel., Rachita Nanda
*
and Eli Mohapatra
Department of Biochemistry, All India Institute of Medical Sciences (AIIMS),
Raipur, Chhattisgarh
DOI: http://dx.doi.org/10.24327/ijrsr.2017.0803.0113
ARTICLE INFO
Article History:
Received 17th December, 2016 Received in revised form 21st January, 2017
Accepted 05th February, 2017
Published online 28th March, 2017
Key Words:
Metabolic Syndrome, Diabetes Mellitus, Dyslipidemia, Hypertension
ABSTRACT
Introduction: Metabolic syndrome (MetS) is regarded as a constellation of the altered metabolic profile. It is considered as pro-atherogenic as the adipose tissues are metabolically active to secrete non-esterified fatty acids initiating atherogenic changes. Active adipocytes also secrete pro-inflammatory mediators and bring about pro-inflammatory changes in various tissues. Being a potent contributor towards cardiovascular disease, it’s a disorder of major concern in public health domain. Objective: The aim of this study was to analyze the prevalence of MetS in the study population and its association with different variables.
Materials and Methods: The study was conducted during a camp organized by our institute. 246 adult individuals were enrolled for the camp. Following the informed consent, all demographic profile, serum lipid profile and fasting plasma glucose (FPG) were measured. The study population was categorized into three groups: (i)Non-MS group: those who did not meet the criteria for central obesity, (ii)High risk group: those who had central obesity but did not full fill the other two criteria for MetS and (iii)MS group: those who full filled the criteria for MetS as new International Diabetes Federation (IDF) definition.
Results: The prevalence of metabolic syndrome in this area was observed to be 20.7%. The study reflected significant association with age (p=0.001), gender (p<0.001), waist circumference (p<0.001), BMI (p<0.001), hypertension (p<0.001), FPG (p<0.001) and dyslipidemia (p<0.05). Hypertension has been significantly associated with MetS and found to significantly reduce the risk of developing MetS in subjects with normal BP (OR=0.17,CI:0.06-0.45).
Conclusion: The study revealed prevalence of MetS to be 20.7% in the study population and outlined the risk factors associated with it. This study would aid in formulating strategies for lifestyle modification, behavioral therapy, diet education and nutritional therapy.
Copyright © Suprava Patel et al, 2017, this is an open-access article distributed under the terms of the Creative Commons Attribution License, which permits unrestricted use, distribution and reproduction in any medium, provided the original work is properly cited.
INTRODUCTION
For years medicine has evidenced significant link between metabolic syndrome (MetS) with central obesity, hypertension, dyslipidemia, insulin resistance (IR) and diabetes mellitus (DM).(Després and Lemieux 2006) Metabolic syndrome is regarded as a constellation of the altered metabolic profile. The new International Diabetes Federation (IDF) definition of metabolic syndrome is that they must have central obesity with any two of the four factors: (i) raised triglyceride (TGL) level, (ii) reduced high density lipoprotein (HDL) levels, (iii) raised blood pressure (BP) and (iv) raised fasting plasma glucose (FPG). (Siddiqui and Gaikwad 2017) It is considered as pro-atherogenic as the adipose tissues are metabolically active to secrete non-esterified fatty acids initiating atherogenic changes. Active adipocytes also secrete pro-inflammatory mediators and
bring about inflammatory changes in various tissues. In 20% cases of MetS have also been associated with diabetes mellitus owing to beta-cell dysfunction due to inflammation. (Vega 2004) It is regarded as a potent contributor for cardiovascular disease (CVD) and hence of major public health concern. (Bays
Various Risk Factors
MATERIALS AND METHODS
The study was conducted during a camp organized by our institute after its approval by the Institutional Research Cell. Individuals were called for screening for diabetes mellitus and preparatory information were circulated in the area inscribed in leaflets, written both in English and in local language, a week before. All laboratory analyses were performed in our laboratory free of cost. 246 adult individuals were enrolled for the camp. Following the informed consent, the demographic profiles demographic profile were measured. Blood was collected for serum lipid profile and FPG.
Diagnostic criteria for MetS were followed as per new IDF definition:(Siddiqui and Gaikwad 2017)
Individuals must have
Central obesity: waist circumference (WC) in men ≥ 94cm and women ≥ 80cm.
Associated with any two of the following factors:
1. Elevated TGL - ≥ 150 mg/dl
2. Reduced HDL cholesterol - <40 mg/dl in males and <50 mg/dl in females
3. Raised BP – systolic ≥ 130 and Diastolic ≥ 85 mm of Hg 4. Raised FPG - ≥ 100 mg/dl
5. All hyperglycemics were subcategorized as pre-diabetic and diabetic as per the diagnostic criteria laid by American Diabetes Association (ADA,REYNOLDS 2017)
6. Diabetics: Individuals with FPG ≥ 126 mg/dl and/or HbA1c ≥ 6.5%. If any patient has A1c ≥6.5% but FPG < 126 mg/dl, that person was considered as diabetic. 7. Pre-diabetics: Individuals with FPG between 101 - 125
mg/dl and/or HbA1c =5.7 – 6.4%.
The study population was categorized into three groups
1. Non-MS group: those who did not meet the criteria for central obesity
2. High risk group: those who had central obesity but did not full fill the other two criteria for MetS
3. MS group: those who full filled the criteria for MetS as per new IDF definition
Statistical analysis was performed using IBM SPSS version 16.0. Causal association between the variables was determined by Chi-Square (χ2) test. Logistic regression analysis was used to evaluate the strength of association and to find the odds ratio to predict the likely risk factors for metabolic syndrome. For two tailed p-values of <0.05 was considered significant, with 95% confidence intervals.
RESULTS
The prevalence of metabolic syndrome in this area was observed to be 20.7% (n=51/246) whereas the prevalence of high risk for MS (subjects having central obesity as per waist circumference) was 33.7% (n=83/246). The observed prevalence of MetS according to study variables have been shown in table-1. The prevalence documented increasing trend with age. Highest prevalence of MetS was observed in hypertensive subjects (58%) followed by diabetic cases (50%).
Table 1 The observed prevalence of MetS according to thestudy variables
Variables Prevalence of MS
Age (years) ≤30, n=67 10%
31-40, n=76 14%
41-50, n=72 31%
51-60, n=27 30%
>60, n=4 75%
Gender Male n=173 20%
Female n=73 23%
BMI High, n=152 32%
Hypertension Present, n=26 58%
FPG Pre-diabetes, n=39 38%
Diabetes, n=30 50%
Dyslipidemia Present, n=176 22%
The mean values of the variables in the study population have been illustrated in figure-1. The mean age group was significantly higher for MS group compared to other two (p<0.001).
200
160
120
80 Non-MS
40 High risk
0 MS
Figure 1 Comparison of mean values of the variables in the study population
#significant difference in MS group as compared to non-MS and high risk group *significant different among all the three groups
^significant difference in MS and high risk group as compared to non-MS group $significant difference in MS group as compared to high risk group
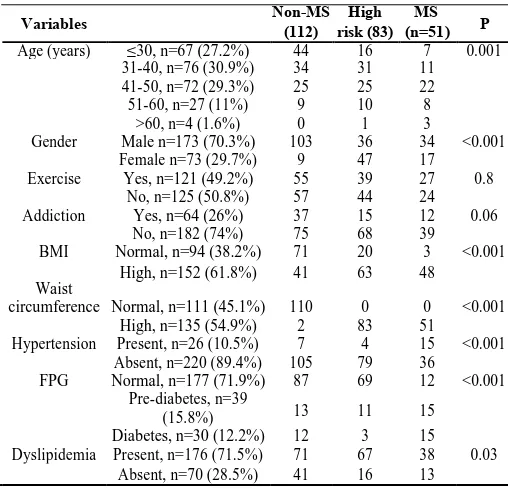
Table 2 Distribution and association of variables to thedemographic and biochemical profile
Variables Non-MS (112) risk (83)High (n=51)MS P
Age (years) ≤30, n=67 (27.2%) 44 16 7 0.001
31-40, n=76 (30.9%) 34 31 11
41-50, n=72 (29.3%) 25 25 22
51-60, n=27 (11%) 9 10 8
>60, n=4 (1.6%) 0 1 3
Gender Male n=173 (70.3%) 103 36 34 <0.001
Female n=73 (29.7%) 9 47 17
Exercise Yes, n=121 (49.2%) 55 39 27 0.8
No, n=125 (50.8%) 57 44 24
Addiction Yes, n=64 (26%) 37 15 12 0.06
No, n=182 (74%) 75 68 39
BMI Normal, n=94 (38.2%) 71 20 3 <0.001
Waist
High, n=152 (61.8%) 41 63 48
Normal, n=111 (45.1%) 110 0 0 <0.001
circumference
High, n=135 (54.9%) 2 83 51
Hypertension Present, n=26 (10.5%) 7 4 15 <0.001
Absent, n=220 (89.4%) 105 79 36
FPG Normal, n=177 (71.9%) 87 69 12 <0.001
Pre-diabetes, n=39
13 11 15
(15.8%)
Diabetes, n=30 (12.2%) 12 3 15
Dyslipidemia Present, n=176 (71.5%) 71 67 38 0.03
Similarly BMI, WC, TGL, VLDL, CHO: HDL and TG:HDL were also significantly different in the three groups. Both MS and high risk subjects had significantly higher BP compared to non-MS individuals (p<0.001). FPG was significantly higher in MS population as compared to non-MS subjects. The distribution of variables in both the groups is depicted in table-2.
The distribution of variables in both the groups is depicted in table-2. Chi-square study reflected significant association with age (p=0.001), gender (p<0.001), waist circumference (p<0.001), BMI (p<0.001), hypertension (p<0.001), FPG (p<0.001) and dyslipidemia (p<0.05) (table-2). The strength of association was calculated by multinomial logistic regression analysis and has been documented in table-3.
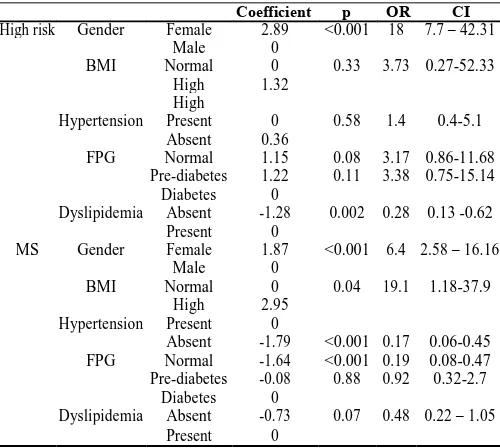
Table 3 Strength of association of different variables for predicting the risk of metabolic syndrome in the study
population
Coefficient p OR CI
High risk Gender Female 2.89 <0.001 18 7.7 – 42.31
Male 0
BMI Normal 0 0.33 3.73 0.27-52.33
High 1.32
High
Hypertension Present 0 0.58 1.4 0.4-5.1
Absent 0.36
FPG Normal 1.15 0.08 3.17 0.86-11.68
Pre-diabetes 1.22 0.11 3.38 0.75-15.14
Diabetes 0
Dyslipidemia Absent -1.28 0.002 0.28 0.13 -0.62
Present 0
MS Gender Female 1.87 <0.001 6.4 2.58 – 16.16
Male 0
BMI Normal 0 0.04 19.1 1.18-37.9
High 2.95
Hypertension Present 0
Absent -1.79 <0.001 0.17 0.06-0.45
FPG Normal -1.64 <0.001 0.19 0.08-0.47
Pre-diabetes -0.08 0.88 0.92 0.32-2.7
Diabetes 0
Dyslipidemia Absent -0.73 0.07 0.48 0.22 – 1.05
Present 0
Odds in female population is 18 times that of males to fall in high risk group as compared to non-MS group (CI:7.7-42.31;p<0.001). The likelihood developing MS in females was 6.4 times that of males (CI:2.58-16.16;p<0.001).. Subjects with raised BMI were found to be 19.1 times more likely to develop MS against non-MS population (1.18-37.9;p=0.04). Absence of dyslipidemia was found to reduce the chances of high risk when compared against the non-MS subjects (OR=0.28; CI:0.13-0.62;p=0.002). The risk of developing MS in individuals with normal BP and FPG was observed to be low as compared to non-MS population (OR=0.17;CI:0.06-0.45 and OR=0.19; CI:0.08-0.47, p<0.001 respectively).
DISCUSSION
The overall prevalence of MetS in the study group was 20.7% which was found to be within the world wide prevalence range of 10 -84%. (Kolovouet al. 2007) The prevalence depicted a rising trend after the age of 40 years and the mean age was significantly (p<0.01) higher in MS group as compared to other two groups. The observation was quite similar to the study by Ford et al who published prevalence of 6.7 % among the age group of 20-29 years, 20% in individuals aged 40-49 and 45% in those above 60 years.(Ford, Giles, and Dietz 2002) During the National Health and Nutrition Examination survey
(NHANES), Park et al evidenced for prevalence of 5% in individuals with normal weight, 22% to 60% in overweight and obese cases.(Parket al. 2003) We too recorded prevalence of 3% and 32% respectively in normal and overweight subjects. The BMI increased significantly in the three groups from non-MS to high risk to non-MS group. The prevalence of MetS in male (20%) and females (23%) observed in our study also found to be within the range 8-43% in men and 7-56% in women, published by Cameron et al. (Cameron, Shaw, and Zimmet 2004) Female population revealed higher prevalence of central obesity (88%) as compared to males (40%) that reflects the significant association (p<0.001) of gender with high risk and MS group in this study. Various other studies also reproduced high prevalence among postmenopausal females. (Jouyandehet
al. 2013; Pradhan 2014; Rochlani, Pothineni, and Mehta 2015) Logistic analysis depicted that females are 18 timesmore likely to develop MetS as compared to non-MS group. This might be due to the fact that most of them were housewives and leading a sedentary lifestyle. Besides, imbalance in estrogen receptors-α and –β ratio, especially in postmenopausal women, has been accounted for the altered metabolic profile in them (Barros and Gustafsson 2011).
Prevalence of MetS among pre-diabetics and diabetics was found to be 38% and 50% respectively. FPG was found to be significantly higher in MS individuals when compared to high risk cases. Nsiahet al in their study reported prevalence of 58% in type-2 DM and 60% as hypertensive.(Nsiah et al. 2015) Adipose tissue deposition curtails blood supply to the adipocytes generating hypoxic environment and initiates necrosis and macrophage infiltration. These changes stimulate release of pro-inflammatory mediators like tumor necrosis factor (TNF)-α, interleukin-6 (IL-6), plasminogen activator inhibitor-1 (PAI-1) and C-reactive protein (CRP) that initiate inflammatory changes in pancreatic β-cells and also promotes resistance of adipocytes and skeletal muscles to insulin by inhibiting receptor signaling.(Lau et al. 2005; Hotamisligil et
al. 1996; Deepa et al. 2006)Absence of dyslipidemiaattributed reduced risk of MetS as compared to the non-MS population. The pro-inflammatory mediators like TNF-α, IL-6 and PAI-1have been evidenced for their positive correlation with BMI, WC, triglyceridemia and low HDL cholesterol levels and hence induce atherogenesis.(Xydakis et al. 2004) Dyslipidemia also was found to be high in our study population (71.5%). In them, prevalence of MetS was found to be 22%. Calmon et al also have highlighted age-adjusted prevalence of MetS and dyslipidemia to be 31.2% and 24.1% respectively.(Florezet al. 2005).
Various Risk Factors
and Yu 2014; Bruder-Nascimento, da Silva, and Tostes 2014) Insulin has been known to induce vasodilatation by stimulating nitric oxide in endothelium and regulates sodium homeostasis by enhancing renal sodium resorption. Active secretion of aldosterone by RAS impairs insulin receptor signaling cascade. (Horitaet al. 2011; Brands and Manhiani 2012).
The major limitation of our study was that of being a cross-sectional study consisting of a small sample size, hence the results cannot be generalized to the whole population of the state. Large scale cohort studies are required to confirm the observations and initiate preventive actions.
CONCLUSION
The study revealed a higher prevalence of MetS in the study population and outlined the risk factors associated with it. This study would aid in formulating strategies for early diagnosis through effective screening programs for obesity, hypertension, altered lipid profile and glucose intolerance. Knowledge in understanding the risk factors for metabolic syndrome can help formulating preventive and therapeutic strategies like lifestyle modification, behavioral therapy, diet education and nutritional therapy and upgrading the overall health of the people.
Acknowledgements
We are thankful to all the technical and non-technical staff of our department for organizing the camp. We are very much grateful to the Admin and Finance sections of this institute for providing the financial support.
References
Barros, Rodrigo P. A., and Jan-Åke Gustafsson. 2011. “Estrogen Receptors and the Metabolic Network.” Cell
Metabolism 14 (3): 289–99. doi:10.1016/j.cmet.2011.
08.005.
Bays, Harold E., J. Michael González-Campoy, George A. Bray, Abbas E. Kitabchi, Donald A. Bergman, Alan Bruce Schorr, Helena W. Rodbard, and Robert R. Henry. 2008. “Pathogenic Potential of Adipose Tissue and Metabolic Consequences of Adipocyte Hypertrophy and Increased Visceral Adiposity.” Expert Review of
Cardiovascular Therapy 6 (3): 343–68. doi:10.1586/14
779072.6.3.343.
Brands, Michael W., and M. Marlina Manhiani. 2012. “Sodium-Retaining Effect of Insulin in Diabetes.”
American Journal of Physiology. Regulatory, Integrative
and Comparative Physiology 303 (11): R1101-1109.
doi:10.1152/ajpregu.00390.2012.
Bruder-Nascimento, Thiago, Marcondes AB da Silva, and Rita C Tostes. 2014. “The Involvement of Aldosterone on Vascular Insulin Resistance: Implications in Obesity and Type 2 Diabetes.” Diabetology & Metabolic
Syndrome 6 (August). doi:10.1186/1758-5996-6-90.
Cameron, Adrian J., Jonathan E. Shaw, and Paul Z. Zimmet. 2004. “The Metabolic Syndrome : Prevalence in Worldwide Populations.” Endocrinology and
Metabolism Clinics of North America 33 (2): 351–75.
doi:10.1016/j.ecl.2004.03.005.
Deepa, Raj, Kaliyaperumal Velmurugan, Kannan Arvind, Pillarisetti Sivaram, Cahoon Sientay, Saxena Uday, and
Viswanathan Mohan. 2006. “Serum Levels of Interleukin 6, C-Reactive Protein, Vascular Cell Adhesion Molecule 1, and Monocyte Chemotactic Protein 1 in Relation to Insulin Resistance and Glucose Intolerance--the Chennai Urban Rural Epidemiology Study (CURES).” Metabolism: Clinical and
Experimental 55 (9): 1232–38. doi:10.1016/j.metabol.
2006.05.008.
Després, Jean-Pierre, and Isabelle Lemieux. 2006. “Abdominal Obesity and Metabolic Syndrome.” Nature
444 (7121): 881–87. doi:10.1038/nature05488.
Florez, Hermes, Eglé Silva, Virginia Fernández, Elena Ryder, Tulio Sulbarán, Gilberto Campos, Gustavo Calmón, Emilio Clavel, Sumaya Castillo-Florez, and Ronald Goldberg. 2005. “Prevalence and Risk Factors Associated with the Metabolic Syndrome and Dyslipidemia in White, Black, Amerindian and Mixed Hispanics in Zulia State, Venezuela.” Diabetes Research
and Clinical Practice 69 (1): 63-77. doi:10.1016/j.
diabres.2004.11.018.
Ford, Earl S., Wayne H. Giles, and William H. Dietz. 2002. “Prevalence of the Metabolic Syndrome among US Adults: Findings from the Third National Health and Nutrition Examination Survey.” JAMA 287 (3): 356–59. Horita, Shoko, George Seki, Hideomi Yamada, Masashi
Suzuki, Kazuhiko Koike, and Toshiro Fujita. 2011. “Insulin Resistance, Obesity, Hypertension, and Renal Sodium Transport.” International Journal of
Hypertension 2011. doi:10.4061/2011/391762.
Hotamisligil, G. S., P. Peraldi, A. Budavari, R. Ellis, M. F. White, and B. M. Spiegelman. 1996. “IRS-1-Mediated Inhibition of Insulin Receptor Tyrosine Kinase Activity in TNF-Alpha- and Obesity-Induced Insulin Resistance.”
Science (New York, N.Y.) 271 (5249): 665– 68.
Jouyandeh, Zahra, Farnaz Nayebzadeh, Mostafa Qorbani, and Mojgan Asadi. 2013. “Metabolic Syndrome and Menopause.” Journal of Diabetes & Metabolic
Disorders 12: 1. doi:10.1186/2251-6581-12-1.
Kolovou, Genovefa D., Katherine K. Anagnostopoulou, Klelia D. Salpea, and Dimitri P. Mikhailidis. 2007. “The Prevalence of Metabolic Syndrome in Various Populations.” The American Journal of the Medical
Sciences 333 (6): 362-71. doi:10.1097/MAJ.0b013e31
8065c3a1.
Lau, David C. W., Bikramjit Dhillon, Hongyun Yan, Paul E. Szmitko, and Subodh Verma. 2005. “Adipokines: Molecular Links between Obesity and Atheroslcerosis.”
American Journal of Physiology. Heart and Circulatory
Physiology 288 (5): H2031-2041. doi:10.1152/ajpheart.
01058.2004.
Malhotra, A., B. P. Kang, S. Cheung, D. Opawumi, and L. G. Meggs. 2001. “Angiotensin II Promotes Glucose-Induced Activation of Cardiac Protein Kinase C Isozymes and Phosphorylation of Troponin I.” Diabetes
50 (8): 1918–26.
Nsiah, Kwabena, V Owusua Shang, K Agyenim Boateng, and FO Mensah. 2015. “Prevalence of Metabolic Syndrome in Type 2 Diabetes Mellitus Patients.”
Research 5 (2): 133–38. doi:10.4103/2229-516X.157170.
Park, Yong-Woo, Shankuan Zhu, Latha Palaniappan, Stanley Heshka, Mercedes R. Carnethon, and Steven B. Heymsfield. 2003. “The Metabolic Syndrome: Prevalence and Associated Risk Factor Findings in the US Population from the Third National Health and Nutrition Examination Survey, 1988-1994.” Archives of
Internal Medicine 163 (4): 427–36.
Pradhan, Aruna D. 2014. “Sex Differences in the Metabolic Syndrome: Implications for Cardiovascular Health in Women.” Clinical Chemistry 60 (1): 44–52. doi:10.1373/clinchem.2013.202549.
REYNOLDS, LYNDA. 2017. “ADA: Standards of Medical Care in Diabetes - 2017.” J Clin Appl Res Edu 40 (1): pp.142.
Rochlani, Yogita, Naga Venkata Pothineni, and Jawahar L. Mehta. 2015. “Metabolic Syndrome: Does It Differ Between Women and Men?” Cardiovascular Drugs and
Therapy 29 (4): 329–38. doi:10.1007/s10557-015-6593-6.
Siddiqui, Nafeha Sameen, and A. V. Gaikwad. 2017. “Metabolic Syndrome: A Growing Threat.” Accessed April 9. http://www.ksijmr.com/1.1.4.pdf.
Vega, G. L. 2004. “Obesity and the Metabolic Syndrome.”
Minerva Endocrinologica 29 (2): 47–54.
Xydakis, Antonios M., Christopher C. Case, Peter H. Jones, Ron C. Hoogeveen, Mine-Yine Liu, E. O’Brian Smith, Kathleen W. Nelson, and Christie M. Ballantyne. 2004. “Adiponectin, Inflammation, and the Expression of the Metabolic Syndrome in Obese Individuals: The Impact of Rapid Weight Loss through Caloric Restriction.” The
Journal of Clinical Endocrinology and Metabolism 89
(6): 2697–2703. doi:10.1210/jc.2003-031826.
Zhou, Ming-Sheng, Aimei Wang, and Hong Yu. 2014. “Link between Insulin Resistance and Hypertension: What Is the Evidence from Evolutionary Biology?” Diabetology
& Metabolic Syndrome 6 (1): 12.
doi:10.1186/1758-5996-6-12.
How to cite this article:
Suprava Patel., Rachita Nanda and Eli Mohapatra.2017, Prevalence of Metabolic Syndrome and Its Association With Various Risk Factors. Int J Recent Sci Res. 8(3), pp. 16256-16260. DOI: http://dx.doi.org/10.24327/ijrsr.2017.0803.0113