A b s t r a c t. Probability of a working day is defined as the fraction of workable days to all available days within a working period. So, this issue as a crucial role in farm management should be addressed accurately. This research was aimed to develop and verify a model in order to determine the probability of a work day for tillage practices in different regions by different weather and soil characteristics. One of the most restrictive factors for tillage operation is the soil moisture. In this study, a computer model was developed to estimate the soil moisture at tillage period by using meteorological data from previous years and soil characteristics data. The model was verified by a field test. In this test by inserting several sensors in 10-16 and 24-30 cm depths, soil moisture was measured and compared with simulation results of the model. Root mean squared error and modeling efficiency was found to be 2.96 and 0.822 for 10-16 cm soil depth and 4.62 and 0.711 for 24-30 cm soil depth, respectively, representing a good efficiency of the mo-del. Also, sensitivity of moisture estimation to several model para-meters was studied. The model was found to be very sensitive ton, while showed low sensitivity to á and the saturated hydraulic conductivity. Model sensitivity to primary soil moisture was me-dium at deeper depths and in first days of simulation and was low at shallower depths.
K e y w o r d s: workability limits, model, evaporation, hydraulic conductivity, verification
INTRODUCTION
Probability of a working day (PWD) is the fraction of workable days to all days in a work season, which often is used in management of agricultural mechanization. For example it is used to determine timeliness cost, optimum capacity of a machine and the required machine capacity.
Accurate information on the number of suitable days for field operations is important in design, development, and se-lection of efficient machinery systems for crop production. The number of suitable days varies widely with climate, soil characteristics, and type of operation. In order to predict the amount of work that can be accomplished, the time available within the optimal period for the required operation must be known. The time available varies considerably from year to year as weather conditions vary. Selection of the optimal machinery set for long-term production on the farm depends upon accurate assessment of the days available for per-forming each field operation (Rotz and Harrigan, 2005).
The most restrictive factor for tillage is the soil moisture. If tillage is performed in wet soil, it will result in soil com-paction and structural damage and if tillage is performed in dry soil, large clods are produced and energy consumption is increased too. Possibility of tillage has two aspects: – workability: effect of engaged tools with soil on structure,
compaction and fracture of soil;
– trafficability: possibility of tractors and farm machines passing on the soil surface.
The workability of soil indicates the condition when tillage operations can be performed for making the desired structure and shape of its surface (Hoogmoedet al., 2003). Rounsevell and Jones (1993) defined workability as a condi-tion in which soil tillage operacondi-tions such as ploughing and seedbed preparation can be performed. They defined traffi-cability as the capacity of soil to support and with stand traffic with negligible soil structural damage and no adverse effects on crop yield. Droogerset al. (1996) expressed that
Verification and sensitivity analysis of a model for determination of probability
of a working day for tillage
M. Khani
1*, A. Keyhani
1, M. Parsinejad
2, and R. Alimardani
1 1Department of Agricultural Machinery Engineering,2Department of Irrigation and Reclamation, University of Tehran, Karaj, Iran
Received February 25, 2010; accepted August 23, 2010
© 2011 Institute of Agrophysics, Polish Academy of Sciences
*Corresponding author’s e-mail: [email protected]
A A
soil trafficability is the condition that ‘soil traffic is possible without causing unfavorable compaction’. It seems that mini-mizing soil compaction is the main criterion. A workable soil is trafficable too, although the reverse is not necessarily true. As a result, estimation of workability can represent traffi-cability too. Rounsevell (1993) comprehensively reviewed models developed and applied to represent the soil work-ability and suitable days in the United States, Canada, and Europe.
Upper workability limit (UWL) can be defined as the upper limit of soil moisture when tillage operation is perfor-med. For tillage operations purposes, this limit is sometimes called the upper tillage limit (UTL), wet workability limit (WWT) or moisture threshold and workability threshold.
Lower workability limit (LWL) can be defined as the lower limit of soil moisture when tillage operation is performed, often called as the lower tillage limit (LTL) and dry workability limit (DWL). The optimum water content for tillage (OPT) can be defined as ‘the water content at which tillage operations can result in production of greatest proportion of small aggregates’ (Dexter and Bird, 2001).
The range of water content for tillage, over which tillage may satisfactorily be performed, is defined as the difference betweenUWLandLWL:
qRange=qUWL-qLWL . (1)
Various degrees of soil moisture content is assumed for UWLbut the most common is the (lower) plastic limit (PL) (de Toro and Hansson, 2004) and usually 0.9PLis assigned as the optimum water content for tillage (Dexter and Bird, 2001).
Muelleret al. (2003) compared five equations for deter-mining optimum water content for tillage and suggested use of correction factors for them.
There is no actualLWLbecause soil can be tilled even when very dry without damage to its structure. The only con-sideration is how much time and energy a farmer is prepared to use for tillage. Therefore its definition is somewhat arbit-rary. Dexter and Bird (2001) used the following definition forLWL: the water content at which the strength of the soil is twice the strength at the optimum water content. They esti-mated this limit from effective stress theory. According to the theory the needed stress for soil failure is related to soil water content and soil water suction. As the first approxi-mation, the following relationship may be applied:
tOPT=kcOPTyOPT, (2)
and
tLWL=kcLTLyLWL=2tOPT, (3)
where: thec-values are the degrees of saturation =q/qs. The coefficient, k, is assumed to be a constant which depends on the type of strength measurement. The main interest is in re-lative strength values, and so the value of k need not be
con-sidered.yis the matric potential of soil. A computer pro-gram can be used to determine numerically the value of the water content at the lower workability limit (LWL),qLWL, in
terms of the parameters of the van Genuchten equation and of the criteria included in Eqs (2) and (3).
There are two methods for determining probability of a working day as follow. Use of actual data of workdays:In this method the workability condition of soils in each region is studied for several years, thus, reliable results will be gained from the of the study and the results are only useful for the condition that study is conducted and can hardly be attributed to other conditions. So, for different types of soils, regions and operating conditions, separate studies are required. Edwards and Boehlje (1980) used this method for determination of probability of a working day in USA. Use of soil water balance models: In this method, soil moisture and its workability can be estimated by means of historical weather data and soil hydraulic characteristics, in previous years. Simalenga and Have (1992) in Tanzania, Rounsevell and Jones (1993) in England, Droogerset al. (1996) in the Netherlands, Cooperet al. (1997) in Scotland and Rotz and Harrigan (2005) in USA have used this method for determi-nation of probability of a working day.
This study was planned to develop and verify a model using meteorological data and soil characteristic that can efficiently determine the probability of a work day for tillage operations in different region by different weather and soil characteristics. Finally, the sensitivity analysis of the model was applied to the main inputs to determine the needed accuracy of these inputs for precise application of the model.
MATERIALS AND METHODS
Several simulation models have been developed for estimation of soil moisture regime, mainly for the purpose of determining crop water needs and irrigation scheduling. At tillage condition soil is usually bare and no plant transpi-ration occurs. In most simulation models, water reduction from root zone is assumed to be through evapotranspiration. In this study, a new model is developed to simulate bare soil moisture condition. By comparing soil moisture with workabi-lity limits, number of workdays is estimated by the model.
Using law of mass conservation, summation of input/ output water in a soil profile can be regarded as change in soil water storage for a defined period of time. In a water ba-lance equation, the upper boundary condition can then be de-fined as precipitation less evaporation, and the lower boun-dary is considered as free drainage.
Halfway within each soil compartment a node is defi-ned, the soil profile is therefore divided into a number of compartments of same specified thickness and the total time period into discrete time increments (time steps). Fluxes through these divisions are calculated to estimate changes in the soil water content. Fluxes are considered to be constant during an individual time step.
By dividing the soil profile into several depth incre-ments, moisture transfer between layers (depth increments) at different time steps is computed and by summing the net input water to moisture content at previous time step at each layer, new moisture content is calculated. This cycle is con-tinued until soil water content of each layer at all time steps of a day is determined. Soil moisture at each layer in each day is the average of soil moisture at time steps in daily working hours. The suitability of a given day for tillage ope-ration is determined by comparing the moisture of the upper soil layers for which tillage operation is influenced by. The moisture level in the remainder of the soil profile does not directly affect workability. By adding up the workable days, number of workdays is determined. The basic flowchart of the model is represented in Fig. 1.
The code for the model is written in Visual Basic 6.0 language.
The main components of model are evaporation and moisture transfer. Evaporation is assumed to take place in two stages. Stage one is the constant rate stage. At this stage, soil surface is wet and evaporation rate is controlled by weather condition and is equal to potential evaporation rate. Stage two is the falling rate stage. Reduction of soil moisture at surface results in lowering of the hydraulic conductivity of soil to a rate lower than the rate in which moisture migra-tes from lower depths to soil surface. The evaporation rate is then, less than that of potential evaporation. The point at which the second stage of evaporation begins is called thre-shold point. Potential evaporation (stage one evaporation) is computed by Penman-Monteith equation (Monteith, 1965):
(
)
(
)
Ep= Rn-Gs + cp ra
+ D
D
86.4r d
l g
/
, (4)
where:Ep– the potential soil evaporation (mm day-1),Rn– the
net radiation (MJ m-2day-1),Gs– the soil heat flux (MJ m-2
day-1),r– the air density (kg m-3),cp– the specific heat of
air (kJ kg-1°C-1),d–the vapor pressure deficit of the air (kPa),ra– the aerodynamic resistance (s m-1),l– the latent heat of vaporization (MJ kg-1),g– the psychrometric con-stant (kPa °C-1), and 86.4 is the conversion factor.
Actual evaporation at time stepj
Moisture at the end of time stepjand the beginning of time step
j+1
Average moisture at dayi
Comparing with workability limit and possibility of operation
End
Number of workdays Moisture at the end of
day i and the beginning of dayi+1
Compute daily potential evaporation
Potential evaporation at time stepj
Moisture at beginning of dayi
Moisture at beginning of time stepj
Moisture transfer at time stepj
Meteorological data Soil
characteristic Primary soil
moisture
Start
The main method for converting potential evaporation to actual evaporation at second stage of evaporation is Aydin et al. (2005) equation:
(
)
Ea E
tp ad ad p = - -1 log log log log
y y y y , (5)
where:Eais the actual evaporation rate (mm day-1),ytpis
the soil-water potential (matric potential) is at which actual evaporation starts to drop below that of potential,yad is the soil-water potential at air-dry, and y is the soil-water potential to be determined in situ betweenytpandyad. The
values of allyexpress are in kPa.
This equation was evaluated and verified by Aydin (1998) and Aydinet al. (2005). Threshold point is assumed to be equal to moisture content at field capacity (Agam et al., 2004). Assuming that the water potential at dry soil surface is at equilibrium with the atmosphere, the minimum water potential can be derived from the Kelvin equation (Kirby and Ringrose-Voase, 2000).
yad
T
mg RH
=Rg ln , (6)
where:yad– the water potential for air-dry conditions,T– the
absolute temperature (K),g– the acceleration due to gravity (981 cm s-2),m– the molecular mass of water (0.01802 kg mol-1),RH– the relative humidity of the air (fraction), Rg– the universal gas constant (8.3143 104kg cm2s-2mol-1K-1).
Residue cover on the soil surface results in reduction of evaporation rate. Diminishing of evaporation rate has linear relation to residue cover (Bond and Wills, 1970). In this model it is assumed that an increase in residue cover from 0 to 100% results in 0 to 50% potential evaporation reduction. The flux density is a function of soil hydraulic conduc-tivity and the gradient of the hydraulic head. One-dimen-sional flow of water in the soil is determined by Richard’s equation: ¶q ¶ ¶ ¶ q ¶y ¶ q
t= Z K Z-K
é ë
ê ( ) ( ) ,ùûú (7)
where:è– the volumetric water content (L3L-3),ø– soil suction (mm H2O), K(è) – hydraulic conductivity (mm day-1),Z– soil depth (mm) andt– time (day).
This equation is solved by numerical finite difference method. The model uses the explicit method in which it is assumed that matric potential and hydraulic conductivity, thus, water flux between two depth increments in a time step are constant. Also, it is assumed that a depth increment has uniform hydraulic characteristic:
( ) q q y y j i j i j i j i j i j K Z Z - = -+ æ è ç ç ç ö ø ÷ ÷ ÷ -- -- -1 1 2 1 1 1 1 1 1 D
D (j-1)
-( ) ( ) -+ æ è ç ç ç ö ø ÷ ÷ ÷ + -+ -K Z Z j i j i j i j j 1 2 1 1 1 1 1 y y D
D , (8)
Kij--11 2– soil hydraulic conductivity at the boundary of layer
j-1 andjat time stepi-1,Kij-+11 2– soil hydraulic conductivity at the boundary of layer j andj+1 at time stepi-1,yij--11– soil suction at layerj-1 at time stepi-1,yij-1 – soil suction at
layerjat time stepi-1,DZ(j-1)– height difference between layer j-1 and j, DZ( )j – height difference (discrepancy) between layerjandj+1.
For solution of this equation, hydraulic conductivity and soil water potential functions must be known. Van Genutchen equation (1980) was used for determination of soil water suction:
q=(qS-qr)[1+(ay) ]n -m+qr, (9)
where:y– the soil suction (mm H2O),qSandqr– saturated
and residual soil water content (mm3mm-3),a(m-1),nand m(dimensionless) are the soil-specific parameters defined by Mualem (1976) as:
m n
= -1 1. (10)
Unsaturated hydraulic conductivity is determined from Van Genutchen equation (1980):
(
)
K=K Ss e é- -Sem m
ë
ê ùûú
0.5 1 1 1 2
, (11)
K– unsaturated hydraulic conductivity of soil (mm H2O), Ks– saturated hydraulic conductivity of soil (mm H2O), Se– the relative saturation defined as:
Se r s r = -( ) ( ) q q
q q . (12)
For cases where measured information on workability limits is not available models such as the one developed in this study can be used to determine upper workability limit and optimum water content for tillage. Optimum water con-tent for tillage does not have any direct effect on the soil workability and the number of workdays but for determining the lower limit of workability it would be needed.
Lower workability limit is determined by use of Eq. (2). However, model user can adjust the workability limits based on long-term local experience and knowledge of cultivation condition such as type of soil, implement and tractor. Model inputs requirements are soil-water characteristics curve coef-ficients (Van Genutchen parameters), saturated hydraulic conductivity, saturated and residual soil water content, soil moisture at field capacity, permanent wilting point, thre-shold potential, daily precipitation, wind speed, air tempe-rature, air relative humidity, number of sunny hours, eleva-tion, latitude, wind measuring height, surface roughness, surface albedo and residue cover.
In order to be able to introduce the model with con-fidence, it should first be verified by actual data obtained from field experiments. For this purpose, a field test was conduc-ted in Karaj, Iran. Two WATERMARK sensors were placed vertically at two depths of 10 to 16 cm and 24 to 30 cm depths in a PVC pipe.
For a period of 21 days (from 1 to 21st of July 2008) the sensors were read 3 times a day (7 a.m., 12 a.m. and 5 p.m.) and soil moisture content was determined using calibration curve of each sensor. Regarding this fact that there were five pipes, two sensors in each pipe, three times data collection in each day and 21 day in verification periods, and then all collected data for the test were 630 data.
The model was run using the above input parameters. Depth increments thickness was set at 5 cm and time steps of 20 min were assumed. Moisture measurements were compa-red with moisture pcompa-rediction at third (10 to 15 cm) and sixth layer (25 to 30 cm). Measuring depths did not exactly coincide with simulation depths but depth increments thick-ness smaller than 5 cm is unusual.
Field capacity and permanent wilting point for the soil were determined by use of pressure plate apparatus. Hydrau-lic conductivity and soil water characteristic curve coef-ficients were determined by use of Rosetta model. This mo-del by use of basic information of soil such as soil moisture at field capacity and permanent wilting point, bulk density and soil texture (percentages of sand, silt and clay) and by artificial neural network method, determines some of soil characteristics.
Meteorological data was extracted from the local synoptic weather station near to the field under study (35’ 55" N, 1 312 m a.s.l.).
Simulated and observed soil water contents were statis-tically compared using the root mean squared error (RMSE) and model efficiency (EF):
(
)
RMSE
0.5
=
-å é
ë ê ê ê ê
ù
û ú ú ú ú =
S O
n
i i i
n 2
1
, (13)
(
)
(
)
(
)
EF=
- +å
-å
-å é
ë ê ê ê ê
ù
û ú ú ú ú =
=
=
O O S O
O O
i i
i n
i n
i i
n
2 2
1 1
2 1
, (14)
where:Si– simulated,Oi– observed, andO– average of observed volumetric moisture content.
Sensitivity analysis of the model is known as a method which is applied to the main inputs in order to determine the needed accuracy of these inputs for accurate application of the model. Sensitivity analysis was performed to primary soil moisture, saturated hydraulic conductivity and soil water characteristic curve coefficients (n,á). At first, the model was run at a base status, then each parameter was changed and the model was run again. Finally, moisture output at adjusted condition was compared with the base condition. Condition of verification period was assumed to be the base condition. Sensitivity of the model to the para-meters was studied by sensitivity coefficient (SC), which is defined as the ratio of the output change to the input change. Average soil moisture in all of the simulation period was determined as the output for the sensitivity analysis.
Sometimes changes of an input parameter results in an increase of moisture estimation in a part of simulation period and a decrease in other part of the period. With regard to determination of average moisture as the model output, sen-sitivity coefficient underestimates the importance of such parameter. Therefore, there is a need for a criterion that con-siders the absolute value of changes on moisture estimation in each day. Mean relative percentage deviation (MRPD) (Yang and Cenkowski, 1995) was used for such purpose:
MRPD= å
-= 100
1 n
A B
B
i i
i i
n
, (15)
where:Ai– estimated volumetric moisture content at
adjust-ed condition,Bi– estimated volumetric moisture content at
base condition.
at the adjusted state is less than that of the base state. In this situation it can not be said that change in the parameter causes overestimation or underestimation in moisture estimation in all simulation period.
RESULTS AND DISCUSSION
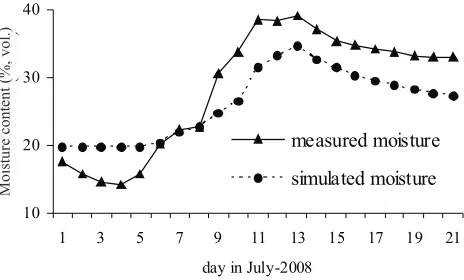
Results of verification test are demonstrated in Table 1. In addition, simulated and observed moisture contents at 10-16 cm depth (Fig. 2) and at 24-30 cm depth (Fig. 3) are graphically compared.
The test results indicate that the model was able to effectively simulate the measured values. The general trend of soil moisture variations was closely predicted by the model (Figs 2-3).
There are some errors that can cause an overestimation in the deference between observed and simulated moisture. Omitting or reducing these errors, the discrepancy between diagrams of observed and simulated moisture would be diminished; consequently verification statistically would be improved. Therefore, the performance of the model can be better than that is shown in verification test. The most impor-tant source of errors in verification test is sensor calibration. Other error sources could be related to moisture measure-ment that this is as a function of the accuracy of sensors, heat transfer between soil and surroundings, soil surface cracks, effect of temperature on the electrical resistance of the sen-sors and their presented numbers.
With these problems, however, there was a good corre-lation between simulated and measured moisture values. Also, with regard to this fact that there is no distinct boun-dary for workability limits, this model, therefore, has a good performance.
In determination of the probability of a working day, the main concern is the determination of the sum of workable days at work period that for programming of which is per-formed and the workability of a particular day is not essen-tial. If there is a overestimation or underestimation in all days of simulation period, discrepancy between simulated and measured moisture values cause an error in determina-tion of probability of working day. Otherwise, this produces no enormous errors on number of workdays and probability of working day because overestimation at a time period to some extent compensates by an underestimation in part of
period. As shown in Fig.3 at a part of verification period, simulated moisture is less than measured moisture but in another part of diagrams, this trend is reverse
.
Therefore the errors of the model created no crucial effect on the number of workdays.The rate of actual evaporation in dry soils is less than that of in wet soils but precipitation increases the moisture level of both soils by the same rate. Therefore in situations that there is a discrepancy between simulated and observed moisture and if the rate of moisture changes is not fast, after a time, this discrepancy gradually diminishes. Thus what-ever the rate of input and output of moisture in soil profile be high, the difference between simulated and observed moisture values would be high.
A sensitivity test was performed to analyze the effect of changes in input parameters on the model simulation (Table 2). Primary soil moisture content was found to be the only input data that would surely have an effect on the simulated results in all days of simulation period. Other parameters exceptn did not show to have such a significant effect.
Time of measure-ments
10-16 cm 24-30 cm
EF RMSE EF RMSE
7 a.m. 0.787 3.29 0.724 4.47
12 a.m. 0.772 3.64 0.728 4.52
5 p.m. 0.822 3.14 0.659 5.12
Average 0.822 2.96 0.711 4.62
T a b l e 1.Results of verification test
10 20 30 40
1 3 5 7 9 11 13 15 17 19 21
day in July -2008
M
oi
st
ur
e
co
nt
en
t(
%
v
ol
.)
measured moisture
simulated moisture
Fig. 2. Comparison between simulated and measured value at 10-16 cm depth.
10 20 30 40
1 3 5 7 9 11 13 15 17 19 21
day in July-2008
M
oi
st
ur
e
co
nt
en
t(
%
v
ol
.)
measured moisture
simulated moisture
Fig. 3.Comparison between simulated and measured value at 24-30 cm depth.
Moisture
content
(%,
vol.)
Moisture
content
(%,
Sensitivity of the model to primary soil moisture is relatively low at higher soil depths. The importance of primary soil moisture is high at first days of simulation and gradually losses its significance. Therefore, no data was available on the primary soil moisture; a rough value can be used for the model prior to the working period. Then, the final estimated soil moisture value for this period is assigned as the primary soil moisture for the main simulation period ie working season.
The rate of evaporation is high when the surface soil moisture is wet and upon drying, the available soil moisture from the lower depths is redistributed to soil surface. How-ever, as soil moisture at the surface decreases, the rate of eva-poration diminishes. The rate of moisture redistribution from the lower depths to soil surface decreases because of lower soil hydraulic conductivity. Therefore, the rate of moisture losses from dry soils is lower than that in wet condition. Effect of precipitation on increasing total moistu-re content of soil profile is comparable. Finally, the net input of moisture to soil profile in dry soil is more than that in wet soil. Therefore, the value of primary soil moisture is im-portant in the first days of simulation period.
The effect of different primary soil moisture on simula-tion result is illustrated in Fig. 4. It is clear that the differen-ces observed between the base simulation and adjusted simula-tions diminishes with time, which confirms the validity of our suggestion of starting the simulation ahead of time for cases in which observed initial condition is not available.
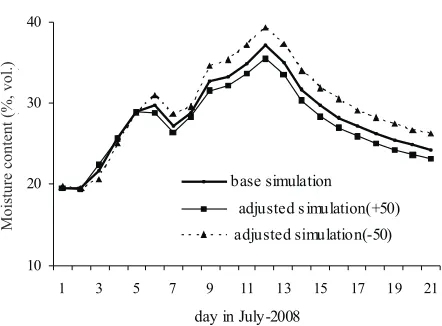
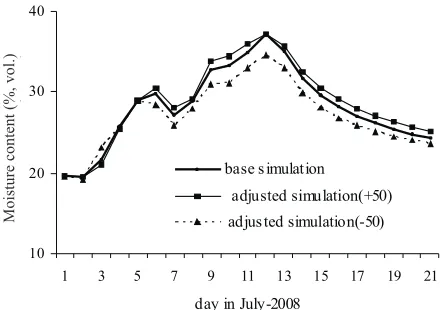
For coarser soils in which the saturated hydraulic conductivity is high, the rate of moisture transfer between two layers is high when a distinct water potential difference exists, but the rate diminishes with time and moisture trans-fer decreases. When saturated hydraulic conductivity is low, the rate of moisture transfer is initially low but it remains mainly constant. Stability of soil moisture within the soil profile after a time reduces the effect of saturated hydraulic conductivity value. Therefore, an exact determination of this parameter is not critical. The effect of different saturated hydraulic conductivity on simulation of soil moisture varia-tions is illustrated is shown in Fig. 5.n-parameter influences
the moisture transfer in two ways, namely, by changing the estimated values of unsaturated hydraulic conductivity and soil water potential. By a small increase innvalue, unsatu-rated hydraulic conductivity significantly increases and results in a vivid moisture transfer in soil profile. In addition, asnincreases, soil water potential at particular soil moisture decreases resulting in lowering the potential differences and, therefore, moisture transfer between two layers. How-ever, this effect is not as significant as increasing of hy-draulic conductivity. As described in the above section, after equilibrium in the soil profile, the effect of changes in n value decreases, nevertheless it is still important, to have an accurate estimate of this input parameter. The effect of different values of n parameter on simulation of soil moisture content is presented in Fig. 6.
Parameters
10-15 cm 25-30 cm
SC MRPD SC MRPD
PSM* 0.245 2.66 0.519 5.68
Ks -0.062 0.645 -0.023 0.683
n -0.844 7.97 -0.382 5.15
a 0.056 0.579 0.019 0.638
T a b l e 2.Effect of 10% increase of input parameters
10 20 30 40
1 3 5 7 9 11 13 15 17 19 21
day in July-2008
M
oi
st
ur
e
co
nt
en
t
(%
vo
l.)
base s imulation
adjus ted simulation(+25)
adjus ted simulation(-25)
Fig. 4.Effect of 25% change of primary soil moisture on moisture estimation at 10-15 cm depth.
10 20 30 40
1 3 5 7 9 11 13 15 17 19 21
day in July-2008
M
o
is
tu
re
co
n
te
n
t(
%
v
ol
.)
base simulation
adjusted s imulation(+50)
adjusted simulation(-50)
Fig. 5.Effect of 50% change of saturated hydraulic conductivity on moisture estimation at 10-15 cm depth.
Moisture
content
(%,
vol.)
Moisture
content
(%,
a-parameter influences the simulation process by changing the soil water potential. By increasing ina, the absolute value of soil water potential decreases. Therefore, potential differences and water transfer between two layers slows down. Again, moisture equilibrium effect within the soil profile lowers the significance of this parameter, but because this parameter along with thenvalue is one of the soil water characteristic curve coefficients, it should be deter-mined with high accuracy. The effect of different values ofa on simulation of soil moisture variations is shown in Fig. 7.
Sensitivity of the model to primary soil moisture was relatively low at shallower depths and was medium at deeper depths. The importance of primary soil moisture is high at first days of simulation and gradually will diminish its importance. Therefore, no data was available on the primary
soil moisture; a rough value can be used for the model prior to the working period. Then, the final estimated soil moisture value for this period is assigned as the primary soil moisture for the main simulation periodieworking period. The quantity of primary soil moisture is important at early days and by approaching to the soil surface or by increasing input and output of water to the soil profile ieevaporation and precipitation, this time reduced. So the length of the primary simulation period that performed for determination of primary moisture of the main simulation can be less than that of circumstance in which input and output rates is low.
It was found that the model is a very sensitive ton, while showed low sensitivity toaand saturated hydraulic conduc-tivity. So an exact determination of saturated hydraulic conductivity is not critical but the importance of this para-meter increases when input and output of moisture to the soil become high. Because there is not enough time for equili-brium among soil layers, as a consequence, instability of moisture in the soil profile is observed. In such situation, hydraulic conductivity is much important in moisture trans-fer as well as determination of new moisture to the soil layers. By the way, there is not required so high accuracy for determination of this parameter. Parameter a has condi-tions similar to that of the saturated hydraulic conductivity, but this parameter along with n is one of the soil water chara-cteristic curve coefficients and accordingly is determined with high accuracy.
CONCLUSIONS
1. The model was able to effectively simulate the actual condition. Some errors in verification test and input data cause an exaggeration in difference between simulation results and actual conditioniethe discrepancy between si-mulation results and actual condition is less than difference between simulation and test results. The verification test was performed in the hardest condition so it can be conclu-ded that the model in the most of conditions can work better than test condition.
2. Workability limits can not be precisely determined because soil behaviour does not change dramatically by changes in its moisture; therefore, boundary between workable and unworkable soil moisture is not distinct. Also, there exists no overestimation or underestimation as a trend in the whole process of verification. Hence, the model with regard to its objective has an acceptable performance.
3. The model has developed based on physical equa-tions and considering good efficiency of the model in the verification test; the model can be used for determination of probability of a working day for tillage operation in other conditions.
10 20 30 40
1 3 5 7 9 11 13 15 17 19 21
day in July-2008
M
oi
st
ur
e
co
nt
en
t
(%
vo
l.)
base simulat ion
adjusted simulation(+10) adjusted simulation(-10)
Fig. 6.Effect of 10% change ofnparameter on moisture estimation at 10-15 cm depth.
10 20 30 40
1 3 5 7 9 11 13 15 17 19 21
day in July-2008
M
oi
st
ur
e
co
nt
en
t
(%
vo
l.)
base s imulation
adjusted simulation(+50)
adjus ted simulation(-50)
Fig. 7.Effect of 50% change ofaon moisture estimation at 10-15 cm depth.
Moisture
content
(%,
vol.)
Moisture
content
(%,
REFERENCES
Agam N., Berliner P.R., Zangvil A., and Ben-Dor E., 2004.Soil water evaporation during the dry season in an arid zone. J. Geophys. Res., D16103, 109, 1-10.
Aydin M., 1998.A new model for predicting evaporation from bare field soil. Proc. Int. Symp. 2nd Chinese Nat. Conf. Rain-water Utilization. September 8-12, Xuzhou-Jiangsu, China. Aydin M., Yang S.L., Kurt N., and Yano T., 2005.Test of a
sim-ple model for estimating evaporation from bare soils in different environments. Ecol. Model, 182, 91-105. Bond J.J. and Willis W.O., 1970.Soil water evaporation: first
stage drying as influenced by surface residue and evapo-ration potential. Soil Sci. Soc. Am. J., 34, 924-928. Cadena Zapata M., Hoogmoed W.B., and Perdok U.D., 2002.
Field studies to assess the workable range of soils in the tropical zone of Veracruz, Mexico. Soil Till. Res., 68, 83-92. Cooper G., McGechan M.B., and Vinten A.J.A., 1997.The in-fluence of a changed climate on soil workability and availa-ble workdays in Scotland. J. Agric. Eng. Res., 68(3), 253-269. De Toro A. and Hansson P.A., 2004.Analysis of field machinery performance based on daily soil workability status using discrete event simulation or on average workday probability. Agric. Systems, 79, 109-129.
Dexter A.R. and Bird N.R.A., 2001.Methods for predicting the optimum and the range of soil water contents for tillage ba-sed on the water retention curve. Soil Till. Res., 57, 203-212. Droogers P., Fermont I.A., and Bouma J., 1996. Effects of
ecological soil management on workability and trafficability of a loamy soil in the Netherlands. Geoderma, 73, 131-145. Edwards W. and Boehlje M., 1980.Machinery selection
consi-dering timeliness losses. Trans. ASAE, 23(4), 810-815. Hoogmoed W.B., Cadena-Zapata M., and Perdok U.D., 2003.
Laboratory assessment of the workable range of soils in the
tropical zone of Veracruz, Mexico. Soil Till. Res., 74, 169-178.
Kirby J.M. and Ringrose-Voase A.J., 2000. Drying of some Philippine and Indonesian puddle rice soils following sur-face drainage: numerical analysis using a swelling soil flow model. Soil Till. Res., 57, 13-30.
Monteith J.L., 1965. Evaporation and environment. Proc. 19th Symp. Society on Experimental Biology. State and Move-ment of Water in Living Organisms, Swansea, Cambridge University Press, Cambridge, UK.
Mualem Y., 1976.A new model for predicting the hydraulic con-ductivity of unsaturated porous media. Water Resour. Res., 12, 513-522.
Mueller L., Schindler U., Fausey N.R., and Lal R., 2003. Com-parison of methods for estimating maximum soil water con-tent for optimum workability. Soil Till. Res., 72, 203-212. Rotz C.A. and Harrigan T.M., 2005.Predicting suitable days for
field machinery operations in a whole farm simulation, Appl. Eng. Agric., 21(4), 563-571.
Rounsevell M.D.A., 1993.A review of soil workability models and their limitations in temperate regions. Soil Use Manag., 9, 15-21.
Rounsevell M.D.A. and Jones R.J.A., 1993.A soil and agroclima-tic model for estimating machinery workdays: the basic model and climatic sensitivity. Soil Till. Res., 26, 179-191. Simalenga T.E. and Have H., 1992.Estimation of soil tillage
workdays in a semi-arid area. J. Agric. Eng. Res., 51, 81-89. Van Genuchten M.Th., 1980.A closed-form equation for
pre-dicting the hydraulic conductivity of unsaturated soils. Soil Sci. Soc. Am. J., 44, 892-898.