A Monthly Double-Blind Peer Reviewed Refereed Open Access International e-Journal - Included in the International Serial Directories Indexed & Listed at:
VOLUME NO.2(2012),ISSUE NO.7(JULY) ISSN2231-5756
CONTENTS
CONTENTS
CONTENTS
CONTENTS
Sr.No.
TITLE & NAME OF THE AUTHOR (S)
Page No.
1. THE POTENTIAL EFFECTS OF MANDATORY AUDIT FIRM ROTATION: EVIDENCE FROM NIGERIA
DR. FAMOUS I.O. IZEDONMI & KILLIAN O. OGIEDU
1 2. UNDERSTANDING THE DYNAMICS OF WORK - FAMILY INTERFACE THROUGH THE BOUNDARY THEORY: A REVIEW OF EMPIRICAL RESEARCH
RUKSANA BANU, DR. DURRISHAH BTE IDRUS & DR. VIJAYA KUMAR GUDEP
13 3. BUSINESS STRATEGIES OF BANKS: IT’S IMPACT ON CONSUMERS
DR. KAUP MOHAMED
18 4. A STUDY ON READER’S PERFERENCE OF THE GULF NEWS AND THE KHALEEJA NEWS PAPERS IN THE UAE
DR. K. DURGA PRASAD & BANDA RAJANI
22 5. LOCAL GOVERNMENT AUDIT IN NIGERIA: EFFECTIVENESS AND AUTONOMY
DR. FAMOUS I.O. IZEDONMI & KILLIAN O. OGIEDU
28 6. RETAILING AND CONSUMER BEHAVIOUR LINKAGES TO BRANDING OF WOMEN APPAREL
SAIJU M JOHN & DR. K. MARAN
38 7. DEVELOPING A KNOWLEDGE MANAGEMENT STRATEGY TO REDUCE COST OF QUALITY FOR AUTOMOBILE INDUSTRY
S.N.TELI, DR. V. S. MAJALI, DR. U. M. BHUSHI & SANJAY PATIL
45 8. PROFITABILITY AND CONSISTENCY ANALYSIS OF INFORMATION TECHNOLOGY SECTOR
DR. K. S. VATALIYA, RAJESH A. JADAV & MALHAR.G.TRIVEDI
49 9. IDENTIFICATION OF TECHNOLOGICAL NEEDS AND PROBLEMS OF POULTRY FARMERS FOR FORMULATION OF RESEARCH AND EXTENSION
PROGRAMMES IN ANIMAL HUSBANDRY
DR. P. MATHIALAGAN
54
10. MARK MODEL FOR IMPROVING THE PERFORMANCE OF TEMPORARY EMPLOYEES IN AUTOMOBILE INDUSTRY
DR. MU. SUBRAHMANIAN & ANJANI NAGARAN
58 11. EXPLORING THE FACTORS FOR CHANNEL SATISFACTION AMONG EMPLOYEES IN INDIAN RETAIL
AJMER SINGH, R. K. GUPTA & SATISH KAPOOR
63 12. EXECUTIVES’ PERCEPTION ABOUT PROJECT MANAGEMENT PRACTICES IN BEML BANGALORE
L. MYNAVATHI & DR. P. NATARAJAN
69 13. PERCEPTION, EXPECTATIONS AND EXPERIENCE OF PASSENGERS: AN ANALYTICAL STUDY OF USERS OF VAYU VAJRA BUS SERVICES IN
BANGALORE BY USING ACSI MODEL
DR. S. JOHN MANOHAR & SUSHEELA DEVI B.DEVARU.
75
14. MOMENTUM COEFFICIENT (Me) – AN EFFECTIVE TECHNICAL TOOL FOR PROJECTING TIME & PRICE TARGET CORRELATION IN THE PROGRESSION OF TRADABLE FINANCIAL SECURITIES
DR. PRAVIN MOKASHI
82
15. STUDY OF BRAND RECALL OF CONSUMER DURABLES AMONG CONSUMERS IN PUNJAB
BHAVNA PRASHAR & ANUPAMA SHARMA
84 16. TIME DEPENDENT ERROR DETECTION RATE: SOFTWARE RELIABILITY GROWTH MODELS V/S STATISTICAL TECHNIQUES
SANJEEV KUMAR & SACHIN GUPTA
89 17. EMERGING ISSUES OF DEVELOPING MARKETING TACTICS THROUGH INTERNET: EVIDENCE FROM CAPGEMINI
MADHUPARNA DAS & NILANJAN RAY
94 18. “SATYAMEV JAYATE” AAMIR KHAN’S TALK SHOW: AN AVANT-GARDE MARKETING CASE
GUNJN SINGH
100 19. EFFECTIVENESS OF KISAN CREDIT CARD SCHEME IN KARNATAK STATE
DR. RAMESH.O.OLEKAR
104 20. IMPACT OF FOREIGN EDUCATION PROVIDERS IN INDIA
DR. HANNAH FREDERICK
110 21. EMOTIONAL INTELLIGENCE AND STRESSORS AMONG WORKING COUPLES
H. L. NAGARAJA MURTHY
115 22. SOCIO-ECONOMIC CONDITIONS OF WOMEN WORKERS IN SOME SELECTED BRICK KILNS IN WEST BENGAL: AN EMPIRICAL STUDY WITH
SPECIAL REFERENCE TO NADIA DISTRICT
SWAPAN KUMAR ROY
121
23. TATA INDICA: NEW PRODUCT LAUNCH-OPERATIONAL ISSUES-MARKETING STRATEGIES
SHIKHA SINGH, MANMEET KOCHHAR & NILOSHA SHARMA
129 24. STUDY OF INVESTOR’S BEHAVIOR TOWARDS INVESTMENT IN FINANCIAL SECURITIES
RICHA TULI & ABHIJEET KHATRI
137 25. SOCIO ECONOMIC DETERMINANTS OF WOMEN EMPOWERMENT THROUGH MICRO FINANCE WITH SPECIAL REFERENCE TO COIMBATORE
DISTRICT
M. MUTHUMANI & K. GUNASUNDARI
142
26. LEVEL OF AWARENESS ABOUT MUTUAL FUNDS AMONG MANAGEMENT ACADEMICIANS IN RAJASTHAN- AN EMPIRICAL STUDY
DR. DHIRAJ JAIN & SAHARSH MEHRA
148 27. LEADERSHIP & MANAGEMENT STYLES WORKING HANDS ON WITH ORGANISATIONAL CULTURE
BISWAJIT PATTAJOSHI
156 28. A CRITICAL – ANALYTICAL STUDY OF THE BUSINESS STUDIES TEXT BOOK PRESCRIBED AT THE HIGHER SECONDARY CLASS OF KERALA STATE
MUJEEB RAHIMAN KATTALI
162 29. THE IMPACT OF WORKING RELATIONSHIPS AND DELIVERY OF EVP IN THE EMPLOYEE TURNOVER PROCESS
L. R. K. KRISHNAN & SUDHIR WARIER
167 30. OPPORTUNITIES OF INDIAN TOURISM INDUSTRY (WITH SPECIAL REFERENCE OF MEDICAL TOURISM)
K. N. MARIMUTHU
175
CHIEF PATRON
CHIEF PATRON
CHIEF PATRON
CHIEF PATRON
PROF. K. K. AGGARWAL
Chancellor, Lingaya’s University, Delhi
Founder Vice-Chancellor, Guru Gobind Singh Indraprastha University, Delhi
Ex. Pro Vice-Chancellor, Guru Jambheshwar University, Hisar
PATRON
PATRON
PATRON
PATRON
SH. RAM BHAJAN AGGARWAL
Ex. State Minister for Home & Tourism, Government of Haryana
Vice-President, Dadri Education Society, Charkhi Dadri
President, Chinar Syntex Ltd. (Textile Mills), Bhiwani
CO
CO
CO
CO----ORDINATOR
ORDINATOR
ORDINATOR
ORDINATOR
AMITA
Faculty, Government M. S., Mohali
ADVISORS
ADVISORS
ADVISORS
ADVISORS
DR. PRIYA RANJAN TRIVEDI
Chancellor, The Global Open University, Nagaland
PROF. M. S. SENAM RAJU
Director A. C. D., School of Management Studies, I.G.N.O.U., New Delhi
PROF. M. N. SHARMA
Chairman, M.B.A., Haryana College of Technology & Management, Kaithal
PROF. S. L. MAHANDRU
Principal (Retd.), Maharaja Agrasen College, Jagadhri
EDITOR
EDITOR
EDITOR
EDITOR
PROF. R. K. SHARMA
Professor, Bharti Vidyapeeth University Institute of Management & Research, New Delhi
CO
CO
CO
CO----EDITOR
EDITOR
EDITOR
EDITOR
DR. BHAVET
Faculty, M. M. Institute of Management, Maharishi Markandeshwar University, Mullana, Ambala, Haryana
EDITORIAL ADVISORY BOARD
EDITORIAL ADVISORY BOARD
EDITORIAL ADVISORY BOARD
EDITORIAL ADVISORY BOARD
DR. RAJESH MODI
Faculty, Yanbu Industrial College, Kingdom of Saudi Arabia
PROF. SANJIV MITTAL
University School of Management Studies, Guru Gobind Singh I. P. University, Delhi
PROF. ANIL K. SAINI
Chairperson (CRC), Guru Gobind Singh I. P. University, Delhi
DR. SAMBHAVNA
Faculty, I.I.T.M., Delhi
DR. MOHENDER KUMAR GUPTA
VOLUME NO.2(2012),ISSUE NO.7(JULY) ISSN2231-5756
DR. SHIVAKUMAR DEENE
Asst. Professor, Dept. of Commerce, School of Business Studies, Central University of Karnataka, Gulbarga
MOHITA
Faculty, Yamuna Institute of Engineering & Technology, Village Gadholi, P. O. Gadhola, Yamunanagar
ASSOCIATE EDITORS
ASSOCIATE EDITORS
ASSOCIATE EDITORS
ASSOCIATE EDITORS
PROF. NAWAB ALI KHAN
Department of Commerce, Aligarh Muslim University, Aligarh, U.P.
PROF. ABHAY BANSAL
Head, Department of Information Technology, Amity School of Engineering & Technology, Amity University, Noida
PROF. A. SURYANARAYANA
Department of Business Management, Osmania University, Hyderabad
DR. SAMBHAV GARG
Faculty, M. M. Institute of Management, Maharishi Markandeshwar University, Mullana, Ambala, Haryana
PROF. V. SELVAM
SSL, VIT University, Vellore
DR. PARDEEP AHLAWAT
Associate Professor, Institute of Management Studies & Research, Maharshi Dayanand University, Rohtak
DR. S. TABASSUM SULTANA
Associate Professor, Department of Business Management, Matrusri Institute of P.G. Studies, Hyderabad
SURJEET SINGH
Asst. Professor, Department of Computer Science, G. M. N. (P.G.) College, Ambala Cantt.
TECHNICAL ADVISOR
TECHNICAL ADVISOR
TECHNICAL ADVISOR
TECHNICAL ADVISOR
AMITA
Faculty, Government H. S., Mohali
MOHITA
Faculty, Yamuna Institute of Engineering & Technology, Village Gadholi, P. O. Gadhola, Yamunanagar
FINANCIAL ADVISORS
FINANCIAL ADVISORS
FINANCIAL ADVISORS
FINANCIAL ADVISORS
DICKIN GOYAL
Advocate & Tax Adviser, Panchkula
NEENA
Investment Consultant, Chambaghat, Solan, Himachal Pradesh
LEGAL ADVISORS
LEGAL ADVISORS
LEGAL ADVISORS
LEGAL ADVISORS
JITENDER S. CHAHAL
Advocate, Punjab & Haryana High Court, Chandigarh U.T.
CHANDER BHUSHAN SHARMA
Advocate & Consultant, District Courts, Yamunanagar at Jagadhri
SUPERINTENDENT
SUPERINTENDENT
SUPERINTENDENT
SUPERINTENDENT
SURENDER KUMAR POONIA
CALL FOR MANUSCRIPTS
CALL FOR MANUSCRIPTS
CALL FOR MANUSCRIPTS
CALL FOR MANUSCRIPTS
Weinvite unpublished novel, original, empirical and high quality research work pertaining to recent developments & practices in the area of Computer, Business, Finance, Marketing, Human Resource Management, General Management, Banking, Insurance, Corporate Governance and emerging paradigms in allied subjects like Accounting Education; Accounting Information Systems; Accounting Theory & Practice; Auditing; Behavioral Accounting; Behavioral Economics; Corporate Finance; Cost Accounting; Econometrics; Economic Development; Economic History; Financial Institutions & Markets; Financial Services; Fiscal Policy; Government & Non Profit Accounting; Industrial Organization; International Economics & Trade; International Finance; Macro Economics; Micro Economics; Monetary Policy; Portfolio & Security Analysis; Public Policy Economics; Real Estate; Regional Economics; Tax Accounting; Advertising & Promotion Management; Business Education; Management Information Systems (MIS); Business Law, Public Responsibility & Ethics; Communication; Direct Marketing; E-Commerce; Global Business; Health Care Administration; Labor Relations & Human Resource Management; Marketing Research; Marketing Theory & Applications; Non-Profit Organizations; Office Administration/Management; Operations Research/Statistics; Organizational Behavior & Theory; Organizational Development; Production/Operations; Public Administration; Purchasing/Materials Management; Retailing; Sales/Selling; Services; Small Business Entrepreneurship; Strategic Management Policy; Technology/Innovation; Tourism, Hospitality & Leisure; Transportation/Physical Distribution; Algorithms; Artificial Intelligence; Compilers & Translation; Computer Aided Design (CAD); Computer Aided Manufacturing; Computer Graphics; Computer Organization & Architecture; Database Structures & Systems; Digital Logic; Discrete Structures; Internet; Management Information Systems; Modeling & Simulation; Multimedia; Neural Systems/Neural Networks; Numerical Analysis/Scientific Computing; Object Oriented Programming; Operating Systems; Programming Languages; Robotics; Symbolic & Formal Logic and Web Design. The above mentioned tracks are only indicative, and not exhaustive.
Anybody can submit the soft copy of his/her manuscript anytime in M.S. Word format after preparing the same as per our submission guidelines duly available on our website under the heading guidelines for submission, at the email address: [email protected].
GUIDELINES FOR SUBMISSION OF MANUSCRIPT
GUIDELINES FOR SUBMISSION OF MANUSCRIPT
GUIDELINES FOR SUBMISSION OF MANUSCRIPT
GUIDELINES FOR SUBMISSION OF MANUSCRIPT
1. COVERING LETTER FOR SUBMISSION:
DATED: _____________
THE EDITOR IJRCM
Subject: SUBMISSION OF MANUSCRIPT IN THE AREA OF .
(e.g. Finance/Marketing/HRM/General Management/Economics/Psychology/Law/Computer/IT/Engineering/Mathematics/other, please specify)
DEAR SIR/MADAM
Please find my submission of manuscript entitled ‘___________________________________________’ for possible publication in your journals.
I hereby affirm that the contents of this manuscript are original. Furthermore, it has neither been published elsewhere in any language fully or partly, nor is it under review for publication elsewhere.
I affirm that all the author (s) have seen and agreed to the submitted version of the manuscript and their inclusion of name (s) as co-author (s).
Also, if my/our manuscript is accepted, I/We agree to comply with the formalities as given on the website of the journal & you are free to publish our contribution in any of your journals.
NAME OF CORRESPONDING AUTHOR:
Designation:
Affiliation with full address, contact numbers & Pin Code: Residential address with Pin Code:
Mobile Number (s): Landline Number (s): E-mail Address: Alternate E-mail Address:
NOTES:
a) The whole manuscript is required to be in ONE MS WORD FILE only (pdf. version is liable to be rejected without any consideration), which will start from the covering letter, inside the manuscript.
b) The sender is required to mention the following in the SUBJECT COLUMN of the mail:
New Manuscript for Review in the area of (Finance/Marketing/HRM/General Management/Economics/Psychology/Law/Computer/IT/
Engineering/Mathematics/other, please specify)
c) There is no need to give any text in the body of mail, except the cases where the author wishes to give any specific message w.r.t. to the manuscript. d) The total size of the file containing the manuscript is required to be below 500 KB.
e) Abstract alone will not be considered for review, and the author is required to submit the complete manuscript in the first instance.
f) The journal gives acknowledgement w.r.t. the receipt of every email and in case of non-receipt of acknowledgment from the journal, w.r.t. the submission of manuscript, within two days of submission, the corresponding author is required to demand for the same by sending separate mail to the journal. 2. MANUSCRIPT TITLE: The title of the paper should be in a 12 point Calibri Font. It should be bold typed, centered and fully capitalised.
3. AUTHOR NAME (S) & AFFILIATIONS: The author (s) full name, designation, affiliation (s), address, mobile/landline numbers, and email/alternate email address should be in italic & 11-point Calibri Font. It must be centered underneath the title.
4. ABSTRACT: Abstract should be in fully italicized text, not exceeding 250 words. The abstract must be informative and explain the background, aims, methods,
VOLUME NO.2(2012),ISSUE NO.7(JULY) ISSN2231-5756
5. KEYWORDS: Abstract must be followed by a list of keywords, subject to the maximum of five. These should be arranged in alphabetic order separated by commas and full stops at the end.
6. MANUSCRIPT: Manuscript must be in BRITISH ENGLISH prepared on a standard A4 size PORTRAIT SETTING PAPER. It must be prepared on a single space and
single column with 1” margin set for top, bottom, left and right. It should be typed in 8 point Calibri Font with page numbers at the bottom and centre of every page. It should be free from grammatical, spelling and punctuation errors and must be thoroughly edited.
7. HEADINGS: All the headings should be in a 10 point Calibri Font. These must be bold-faced, aligned left and fully capitalised. Leave a blank line before each
heading.
8. SUB-HEADINGS: All the sub-headings should be in a 8 point Calibri Font. These must be bold-faced, aligned left and fully capitalised.
9. MAIN TEXT: The main text should follow the following sequence:
INTRODUCTION REVIEW OF LITERATURE
NEED/IMPORTANCE OF THE STUDY STATEMENT OF THE PROBLEM OBJECTIVES
HYPOTHESES
RESEARCH METHODOLOGY RESULTS & DISCUSSION FINDINGS
RECOMMENDATIONS/SUGGESTIONS CONCLUSIONS
SCOPE FOR FURTHER RESEARCH ACKNOWLEDGMENTS REFERENCES APPENDIX/ANNEXURE
It should be in a 8 point Calibri Font, single spaced and justified. The manuscript should preferably not exceed 5000 WORDS.
10. FIGURES &TABLES: These should be simple, crystal clear, centered, separately numbered & self explained, and titles must be above the table/figure. Sources of data should be mentioned below the table/figure. It should be ensured that the tables/figures are referred to from the main text.
11. EQUATIONS: These should be consecutively numbered in parentheses, horizontally centered with equation number placed at the right.
12. REFERENCES: The list of all references should be alphabetically arranged. The author (s) should mention only the actually utilised references in the preparation of manuscript and they are supposed to follow Harvard Style of Referencing. The author (s) are supposed to follow the references as per the following:
•
All works cited in the text (including sources for tables and figures) should be listed alphabetically.•
Use (ed.) for one editor, and (ed.s) for multiple editors.•
When listing two or more works by one author, use --- (20xx), such as after Kohl (1997), use --- (2001), etc, in chronologically ascending order.•
Indicate (opening and closing) page numbers for articles in journals and for chapters in books.•
The title of books and journals should be in italics. Double quotation marks are used for titles of journal articles, book chapters, dissertations, reports, working papers, unpublished material, etc.•
For titles in a language other than English, provide an English translation in parentheses.•
The location of endnotes within the text should be indicated by superscript numbers.PLEASE USE THE FOLLOWING FOR STYLE AND PUNCTUATION IN REFERENCES: BOOKS
•
Bowersox, Donald J., Closs, David J., (1996), "Logistical Management." Tata McGraw, Hill, New Delhi.•
Hunker, H.L. and A.J. Wright (1963), "Factors of Industrial Location in Ohio" Ohio State University, Nigeria.CONTRIBUTIONS TO BOOKS
•
Sharma T., Kwatra, G. (2008) Effectiveness of Social Advertising: A Study of Selected Campaigns, Corporate Social Responsibility, Edited by David Crowther & Nicholas Capaldi, Ashgate Research Companion to Corporate Social Responsibility, Chapter 15, pp 287-303.JOURNAL AND OTHER ARTICLES
•
Schemenner, R.W., Huber, J.C. and Cook, R.L. (1987), "Geographic Differences and the Location of New Manufacturing Facilities," Journal of Urban Economics, Vol. 21, No. 1, pp. 83-104.CONFERENCE PAPERS
•
Garg, Sambhav (2011): "Business Ethics" Paper presented at the Annual International Conference for the All India Management Association, New Delhi, India, 19–22 June.UNPUBLISHED DISSERTATIONS AND THESES
•
Kumar S. (2011): "Customer Value: A Comparative Study of Rural and Urban Customers," Thesis, Kurukshetra University, Kurukshetra.ONLINE RESOURCES
•
Always indicate the date that the source was accessed, as online resources are frequently updated or removed.WEBSITES
TIME DEPENDENT ERROR DETECTION RATE: SOFTWARE RELIABILITY GROWTH MODELS V/S STATISTICAL
TECHNIQUES
SANJEEV KUMAR
ASST. PROFESSOR
MAHARAJA AGRASEN INSTITUTE OF TECHNOLOGY
ROHINI
SACHIN GUPTA
ASST. PROFESSOR
MAHARAJA AGRASEN INSTITUTE OF MANAGEMENT STUDIES
ROHINI
ABSTRACT
There are several software reliability growth models which have been proposed in the past decade. This paper summarizes existing software reliability growth models (SRGM's) described by Non-Homogeneous Poisson Processes. The SRGM's are classified in terms of the software reliability growth index of the error detection rate per error. The comparison made is based on various statistical techniques. The models parameters are estimated by least square estimation (LSE) and maximum likelihood estimation (MLE) methods. The methods of data analysis and comparison criteria are presented. The experimental results from actual data applications show good fit. A comparative analysis to evaluate the effectiveness of the existing models is performed. The maximum-likelihood estimations is used for the SRGM's are discussed for software reliability data analysis and software reliability evaluation by using some statistical tool.
KEYWORDS
Error detection rate per error, maximum likelihood estimation, non homogeneous poission process, software error, software reliability, software reliability growth models.
INTRODUCTION
n recent year’s (over the period of last two decade) software system such as operating system, control programs, and application programs have been more complex and larger than ever. It is quite natural to produce reliable software systems efficiently since the breakdown of the computer, which is caused by software errors results in a tremendous loss and damage of social life. Hence software reliability is one of the important key issues in modern era of software product development. In other words software reliability is one of the important issues of today’s software development [10]. Several software reliability models have been proposed during past decades. In Software development life cycle, software testing is the phase where a software system is tested to detect software errors remaining in the system and correct them. A Software reliability model describing such an error detection phenomenon is called software reliability growth model, SRGM [10]. An SRGM describe a software error detection process and estimate software remaining in the software. Using software reliability data analysis based on the SRGM, we can evaluate software reliability equation Goel and Okomoto [8], Littlewood [18], Musa [20], Yamda et al.[24]. This paper presents the useful methods of software reliability analysis based on SRGM’s described by Non-Homogeneous Poisson Process (NHPP’s) and comparison of SRGM’s is done with existing statistical techniques which are based on regression analysis. The software reliability growth index of the error detection rate per error which characterizes the software reliability testing phase is defined and the quantitative measures of software reliability evaluation are derived. Rest of the paper is described as follows. Section 2, contains the literature review. In section 3 some of the exiting SRGM’s are described with assumptions and notation used to form these models. Section 4 is having information about the statistical tools and curve fitting techniques based on principal of least square. Section 5 is having conclusion obtained on basis of comparison between the two models.
LITERATURE REVIEW
The efforts to improve the software development process are accompanied with parallel efforts aiming at ensuring high quality software systems. The software quality assurance consists of those procedures, techniques and a tool applied by professionals to ensure that a software product meets or exceeds pre-specified standards during software development cycles. The quality of the software system has many attributes such as complexities, maintainability, portability, usability, security, reliability, availability etc.
As the size and complexity of computer systems has grown significantly during the past decades. Computers are used in medical fields, businesses, chemical labs, air traffic control towers, ships, space ships, home appliances, communication, manufacture and many more. Software is a functioning element embedded in computers that plays vital role in the modern life. Errors are bound to happen as software is written by humans. Before, the focus was only on the design and reliability of the hardware. But, now increase in the demand of software has led to the study of the high quality reliable software development. Reliability is the most important aspect since it measures software failures during the process of software development. Software reliability is defined as the probability of failure free operation of a computer program for a specified time in a specified environment (Musa et al., 1987)[20]. Many researches have been conducted over the past decades (Pham, 2000; Lyu, 1996; Musa et al. 1987)[22] and still going on, to study the software reliability. A common approach for measuring software reliability is by using an analytical model whose parameters are generally estimated from available data on software failures (Lyu, 1996[19]; Musa et al. 1987 [22]). A software reliability growth model (SRGM) is a mathematical expression of the software error occurrence and the removal process. In early 1970’s, many software reliability growth models (SRGMs) have been proposed (Lyu, 1996[19]; Xie, 1991[27]; Musa et al., 1987 [22]). A Non- homogeneous Poisson process (NHPP) as the stochastic process has been widely used in SRGM. In the past years, several SRGMs based on NHPP which incorporates the fault detection or fault correction process by NHPP following the basic assumption of GO model.(Kapur et.al., 2010)[18] have been proposed by many authors (Yamada et al., 1986; 1987; 1993; Yamada and Ohtera, [25] 1990; Kapur and Garg, 1996[14]; Kapur and Younes, 1994;[17] Huang et al., 1997; 2007;[12,13]; Huang and Kuo, 2002;[11] Huang, 2005;[10] Bokhari and Ahmad, 2006; 2007 [5]; Ahmad et al., 2008; 2009;[6] ). The testing-effort can be represented as the number of CPU hours, the number of executed test cases, etc. (Yamada and Osaki, 1984 [23]; Yamada et al., 1986, 1993 [25, 26]). Most of these works on SRGMs modified the exponential NHPP growth model (Goel and Okumoto, 1979) [8] and incorporated the concept of testing-effort into an NHPP model to describe the software fault detection phenomenon.
However, the exponential NHPP growth model is sometimes insufficient and inaccurate to analyze real software failure data for reliability assessment. In this paper we show how to integrate a Log-logistic testing-effort function into inflection S-shaped NHPP growth models (Ohba, 1984; 1984a)[24] to get a better description of the software fault detection phenomenon.
The parameters of the model are estimated by Least Square Estimation (LSE) and Maximum Likelihood Estimation (MLE) methods. The statistical methods of data analysis are presented and the experiments are performed based on real data sets and the results are compared with other existing models.
VOLUME NO.2(2012),ISSUE NO.7(JULY) ISSN2231-5756
SOFTWARE RELIABILITY GROWTH MODELS
Let us consider an implemented software system which is tested in the software development. A software failure is defined as an unacceptable departure of program operation caused by a software error remaining in the system.
ASSUMPTIONS
1. A software system is subject to software failures at random times caused by errors present in the system. 2. The initial error content of the software system is a random variable.
3. The number of faults detected at any time instant is proportional to the remaining number of faults in the software. 4. The time between failure (k-1) and k depends on the time to failure (k-1).
5. Each time a failure occurs, the error which caused it, is immediately removed and no other errors are introduced.
NOTATIONS USED
)
(t
m
: Expected number of faults identified in (0,t], mean value function of NHPPa, b : constants, representing initial fault content and rate of fault removal per remaining for a software. b (t) : failure detection rate per fault
The testing time such as the calculation time or the machine execution time is generally used as the unit of error detection period which describes the time-dependent behavior of the cumulative number of errors detected by software testing.
Let {N(t), t>=0)} be a counting process representing the cumulative number of errors( or failures) detected in time interval(0,t]. Then the expected value of N(t) called a mean value function of an NHPP ,is defined by M(t). An SGRM based on an NHPP can usually be formulated as
Pr{N(t)=n}={M(t)}ne[-M(t)],t≥0 n!
(n=0,1,2,……) (1)
It is consider as
M(t)= 1 0
( )
m x d x
∫
(2) then m(t) is called an intensity function of an NHPP, which means the instantaneous error detection rate. Defining a(= M(∞)) as the expected cumulative number of errors to be eventually detected, i.e., the expected initial error content to be estimated, and can be easily shown as
l i m
t→ ∞ Pr{N(t)=n}= !
n a a
e n
−
(n=0,1,2,………..) (3)
which implies that N(t) obeys a Poisson distribution. with mean a after the testing of infinitely long duration. As a useful software reliability growth index, the error detection rate per error (per unit time) at testing time t is given by
( )
( )
[
( )]
m t
d t
a
M t
=
−
(4)We have the relationship between d(t) and M(t) as 1
0 ( ( ) )
( )
[1
]
d u du
M t
a
e
−∫
=
−
(5)The following definitions characterizing a software reliability growth aspect in software testing can be introduced. [11] Definition 1: M (t) is an increasing error detection rate (IEDR) (mean value) function if d(t) is non-decreasing in t,t≥0. Definition 2: M (t) is a decreasing error detection rate (DEDR) (mean value) function if d(t) is non-increasing in t, t ≥0. Definition 3: M (t) is a constant error detection rate (CEDR) (mean value) function if d(t) is constant (t ≥ 0).
Hence a software reliability growth process characterized by the IEDR (DEDR) function indicates increasing (decreasing) test efficiency. The following random variables are defined for deriving the quantitative measures for software reliability evaluation:
N (t): number of errors remaining in the system at testing time t, i.e., N (∞) - N(t), Xk: Time interval between (k - 1)st and kth failures(k=(1,2,……….n),
Sk: The kth failure occurrence time, ie, 1
k
i
Xi
=
∑
Then, the expectation and variance of
N
(t) are given by nr(t)= E[N
(t)]=
0
[ ( ) ]
t
d u du
ae
−
∫
= var[
N
(t)] (6)The so called software reliability is the conditional survival probability of Xk given that Sk-1=t and is given by
R x t
( / )
=
Pr{
X
k>
x S
|
k−1=
t
}
=
0 0
[ { (
( )
)
(
( )
)}]
t x t
a e
d u du
d u du
e
e
+
−
∫
−
∫
−
(7)which is independent of k. The software reliability presents the probability that a failure does not occur in (t, t+x].
EXISTING SRGM’S
There are two types of shape for the observed software reliability growth curve: exponential and s-shaped software reliability growth curves are called the exponential and s-shaped SRGM’s respectively. There are several software reliability growth models based on NHPP are briefly summarized below.
Goel and Okomoto [8] first proposed an SRGM based on NHPP. This model is called exponential SRGM, which describes a software failure detection phenomenon. The mean value function showing an exponential growth curve as
)
1
(
)
(
t
a
e
bt
m
=
−
−
, b>0 (8)where b is the error detection rate per error t an arbitrary testing time.
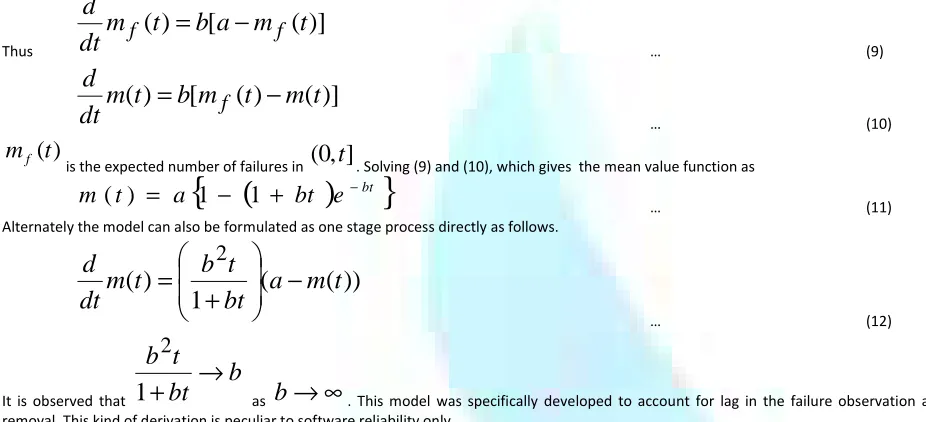
Delayed S-shaped SRGM [8] fault detection in this model is assumed to be a two-phase process consisting of failure detection and it's eventual removal by isolation. It takes into account the time taken to isolate and remove a fault and so it is important that the data to be used here should be that of fault isolation. It is further assumed that the number of faults isolated at any time instant is proportional to the number of faults remaining in the software. Failure rate and isolation rate per fault are assumed to be same and equal to b.
Thus
)]
(
[
)
(
t
b
a
m
t
m
dt
d
f
f
=
−
… (9)
)]
(
)
(
[
)
(
t
b
m
t
m
t
m
dt
d
f
−
=
… (10)
)
(t
m
fis the expected number of failures in
( t
0
,
]
. Solving (9) and (10), which gives the mean value function as(
)
{
bt}
e
bt
a
t
m
(
)
=
1
−
1
+
− … (11)Alternately the model can also be formulated as one stage process directly as follows.
))
(
(
1
)
(
2
t
m
a
bt
t
b
t
m
dt
d
−
+
=
… (12)
It is observed that
b
bt
t
b
→
+
1
2
as
b
→
∞
. This model was specifically developed to account for lag in the failure observation and its subsequent removal. This kind of derivation is peculiar to software reliability only.Another S-Shaped SRGM was proposed by Ohba[11] The model is called Inflection S-Shaped SRGM, which describes a software failure detection phenomenon with a mutual dependence of detected errors. In the error detection process, the more failures we detect, the more undetected failures become detectable. This NHPP model has mean value function of
M(t)=I(t)=
[1
]
[1
.
]
b t b t
a
e
c e
− −−
+
, b>0, c>0, (13)which shows an S-Shaped growth curve. The parameters b and c represent the failure detection rate and the inflection factor, respectively.
Here three models having M(t) ,mean value function with NHPP are compared for actual data. The models compared are : the NHPP model and two deterministic models of fitting curves ie logistic and Gompertz Curves, based on regression analysis . They are denoted as GO(Goel and Okomoto), LC (Logistic curve) and GC (Gompertz Curve) respectively .
The table below shows the result of cumulative number of detected error during the test and after the test . ie. Na and Ne is the estimated s-expected number of errors to be eventually detected based on each models .
Ie a e a
N
N
A
N
−
=
The result where
N
a=42 in the criterion of the accuracy of estimation ie 11 additional errors where detected during the subsequent on-line system test and the actual operational of the program.TABLE 1: ESTIMATION USING SRGM’S MODEL
Models
Criterion for Comparison F A Est. Error NHPP Model With M(t) 12.6 9.7% 37.9 GO Model 31.5 160.6% 109.5 LC Model 767 37.0% 26.5 GC Model 794 18.6% 34.2 Where “F” is the sum of square of the differences and is given by
2 10
1
(
k k)
i
F
N
N
∧
=
=
∑
−
N
k= Actual Cumulative number of errors
N
k ∧= Estimated number of errors detected upto time tk ( k=1,2.3………..10)
and
VOLUME NO.2(2012),ISSUE NO.7(JULY) ISSN2231-5756
STATISTICAL TECHNIQUE: CURVE FITTING
In this method the square of the difference between observed response and value predicted by the model is minimized. If the expected value of the response
variable is given by
m
ˆ t
(
)
(can be a mean value function of an SRGM), then the least square estimators of the parameters of the model may be obtained from n pairs of sample values (t1, y1), (t2, y2), …, (tn, yn) by minimizing J given by[
]
∑
=
−
=
ni
i
m
t
y
J
1
2
)
(
ˆ
… (14)
ti and yi observed values of explanatory and dependent variables respectively. For small and medium size samples least square estimation is preferred.
Linear – In this case the expected faults is considered to be linearly distributed as y = ax + b, where x represent time axis and y represent the number of faults.
Quadratic- This is the enhance version of liner method described above in which faults are assumed to be quadratic in nature given by, y= ax2+bx+c. It has been
seen that as the degree of equation increases the prediction error decreases.
Exponential – This is the alternate way when the degree of fitting the curve is not predictable. Exponential smoothing itself take care of fitting of curve besides the presence of number of curve in original data.
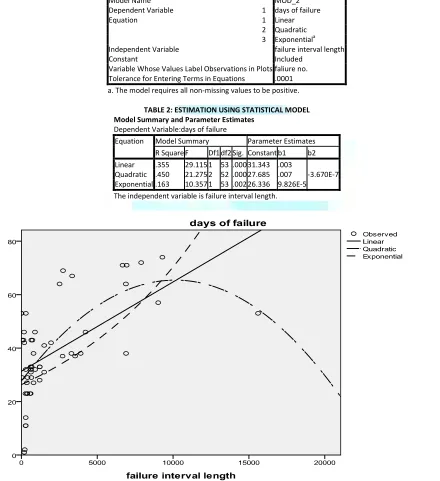
Model Description
Model Name MOD_2
Dependent Variable 1 days of failure
Equation 1 Linear
2 Quadratic 3 Exponentiala Independent Variable failure interval length
Constant Included
Variable Whose Values Label Observations in Plots faliure no. Tolerance for Entering Terms in Equations .0001 a. The model requires all non-missing values to be positive.
TABLE 2: ESTIMATION USING STATISTICAL MODEL Model Summary and Parameter Estimates
Dependent Variable:days of failure
Equation Model Summary Parameter Estimates R Square F Df1 df2 Sig. Constant b1 b2 Linear .355 29.115 1 53 .000 31.343 .003
Quadratic .450 21.275 2 52 .000 27.685 .007 -3.670E-7 Exponential .163 10.357 1 53 .002 26.336 9.826E-5 The independent variable is failure interval length.
MAXIMUM LIKELIHOOD ESTIMATION
Maximum Likelihood Estimation (MLE) method has been extensively adopted for estimation of parameters of SRGMs based upon NHPP [7]. We briefly discuss below the MLE procedure for two types of software failure data discussed above.
For the first type of data, suppose that estimation is to be performed at a specified time tk, not necessarily corresponding to a failure, and with total of mk
failures being experienced at time
m
k
t
t
t
1
,
2
,...,
∫
=
−
=
∏
k
t
dx
x
k
i
i
e
t
L
0
)
(
1
)
(
λ
λ
… (15)
The MLE of the Parameters can be obtained by maximizing Likelihood function or its Log likelihood function (log L).
If the software failure data is grouped into k points
(
t
i
,
y
i
)
; i = 1,2,…,k, where yiis the cumulative number of failure reports at time ti. Then the Likelihoodfunction L is given as follows:
[
]
{
}
∏
=
−
−
−
−
−
−
−
−
−
≡
k
i
t
m
t
m
i
i
y
y
i
i
i
i
e
i
i
y
y
t
m
t
m
L
1
)
(
)
(
1
1
1
1
)!
(
)
(
)
(
… (16)
Taking natural logarithm of (5.2.3) we get the log likelihood function
∑
∑
=
−
=
−
−
−
−
−
−
−
=
k
i
i
i
k
i
k
i
i
i
i
y
m
t
m
t
m
t
y
y
y
LogL
1
1
1
1
1
)
ln[
(
)
(
)]
(
)
ln[(
)!
]
(
… (17)
The MLE of the parameters of SRGM can be obtained by maximizing (eq. 17) with respect to the model parameters.
Likelihood functions for NHPP models are defined above as most of the stochastic models discussed in this thesis are based upon NHPP assumptions. Both the estimation procedures can also be applied to other stochastic processes. Maximum likelihood estimators possess many desirable properties such as consistency, efficiency, asymptotic normality and the invariance property. Hence it is the most preferred estimation procedure for relatively large sample size.
CONLCUSION
On the basis of table 1 and table 2 it can be concluded that sometime the regression analysis techniques are better than the SRGM’s models. The experimental results show that the proposed SRGM with Log-logistic testing-effort function can estimate the number of initial faults better than that of other models and that the Log-logistic testing-effort functions is suitable for incorporating into inflection S-shaped NHPP growth model.
REFERENCES
1. Barlow RE, Hunter LC. “Optimum preventive maintenance policies” Operations research 1960; 8: 90-100.
2. Bhatia D, Kumar .N, and. Bhudhiraja. R. K, “Duality thermo for non differentiable multi objective programs” Indian Journal of Pure and Applied Mathematics 28(8), 1997, 1031-1042.
3. Bittanti S. (Editor) “Software reliability modelling and identification” Lecture notes in Computer Science 1987; Berlin: Springer-Verlag. 4. Boehm BW. “Software risk management” Tutorial 1989; New York: IEEE Computer Society Press, Silver Spring, MD.
5. Bokhari, M.U. and Ahmad, N. (2006), “Analysis of a software reliability growth models: the case of log-logistic test-effort function”, In: Proceedings of the 17th IASTED International Conference on Modeling and Simulation (MS’2006), Montreal, Canada, pp. 540-545.
6. Bokhari, M.U. and Ahmad, N., “Software reliability growth modeling for Exponentiated Weibull functions with actual software failures data”, Advances in Computer Science and Engineering: Reports and Monographs, World Scientific Publishing Company, Singapore, Vol. 2, pp. 390-396. 2007
7. Cheung RC. “A user oriented software reliability growth model” IEEE Transactions on Software Engineering 1980; SE-6: 118-125.
8. Goel AL, Okumoto K. “Time dependent error detection rate model for software reliability and other performance measures” IEEE Transactions on Reliability 1979; R-28(3): 206-211.
9. Hossain S.A, Dahiya RC. “Estimating the parameters of a non-homogeneous poisson process model for software reliability” IEEE Transactions on Reliability 1993; 42(4): 604-612.
10. Huang, C.Y. and Kuo, S.Y. (2002), “Analysis of incorporating logistic testing-effort function into software reliability modeling”, IEEE Transactions on Reliability, Vol. 51, no. 3, pp. 261-270.
11. Huang, C.Y., Kuo, S.Y. and Lyu, M.R. (2007), “An assessment of testing-effort dependent software reliability growth models”, IEEE Transactions on Reliability, Vol. 56, no.2, pp. 198-211.
12. Huang, C.Y. (2005), “Performance analysis of software reliability growth models with testing-effort and change-point”, Journal of Systems and Software, Vol. 76, pp. 181-194.
13. Huang, C.Y., Kuo, S.Y. and Chen, I.Y. (1997), “Analysis of software reliability growth model with logistic testing-effort function”, In: Proceeding of 8th International Symposium on Software Reliability Engineering (ISSRE’1997), Albuquerque, New Mexico, pp. 378-388.
14. Kapur, P.K, Singh Ompal, Tendon Abhishek “Bicriterion release policy for a software reliability growth model incorporating the effect of change point” ICRITO-2010 p-214-224.
15. Kapur PK, Agarwala S, Younes S. Sinha AK. “On a general imperfect debugging software reliability growth model” Microelectronics and reliability 1994; 34(7): 1397-1403.
16. Kapur, P.K., Garg, R.B. and Kumar, S. , “Contributions to Hardware and Software Reliability”, 1999, World Scientific, Singapore.
17. Kapur, P.K. and Garg, R.B., “Modeling an imperfect debugging phenomenon in software reliability”, Microelectronics and Reliability, 1996, Vol. 36, pp. 645-650.
18. Kapur, P.K., Jha, P.C., and Bardhan, A.K., “Optimal Allocation of Testing Resource for a Modular Software”, 2004 Asia-Pacific Journal of Operational Research, Vol. 21, no. 3, pp. 333-354.
19. Littlewood B. “Software Reliability: Achievement and Assessment” 1987; Oxford: Blackwell. 20. Lyu MR (Editor) “Handbook of Software reliability engineering” 1996; New York: McGraw Hill. 21. Musa JD. “Software reliability data” 1980; Data and Analysis Center for Software, USA.
22. Musa. J. D., "A theory of software reliability and its application," IEEE Trans. Software Eng., vol. SE-1, pp. 312-327, Sept. 1975. 23. Pham H. “System Software Reliability” 2005; Springer Series in Reliability Engineering. Reliability and its Interdisciplinary Nature”.
24. S. Yamada, M. Ohba, and S. Osaki, "S-shaped reliability growth modeling for software error detection," IEEE Trans. Rel. , vol. R-32, pp. 475-478, 484, Dec. 1983.
25. S.Yamada, and S.Osaki, “s-Shaped Software Reliability Growth Models and their Applications” IEEE Trans Reliability.vol.R-33, No.4 1984 Oct, pp 289-292. 26. Xie M. “Software reliability modelling” 1991; World Scientific
27. Yamada H, Ohtera H, and Narihisa H. “Software reliability growth models with testing effort” IEEE Trans. On Reliability 1986; R-35(1): 19-23.
VOLUME NO.2(2012),ISSUE NO.7(JULY) ISSN2231-5756
REQUEST FOR FEEDBACK
Dear Readers
At the very outset, International Journal of Research in Commerce, IT and Management (IJRCM)
acknowledges & appreciates your efforts in showing interest in our present issue under your kind perusal.
I would like to request you to supply your critical comments and suggestions about the material published
in this issue as well as on the journal as a whole, on our E-mail i.e.
for further
improvements in the interest of research.
If you have any queries please feel free to contact us on our E-mail
.
I am sure that your feedback and deliberations would make future issues better – a result of our joint
effort.
Looking forward an appropriate consideration.
With sincere regards
Thanking you profoundly
Academically yours
Sd/-