International Journal of Engineering
J o u r n a l H o m e p a g e : w w w . i j e . i rModeling and Optimization of Surface Roughness of AISI2312 Hot Worked Steel in
EDM based on Mathematical Modeling and Genetic Algorithm
M. Azadi Moghaddam*, F. Kolahan
Department of Mechanical Engineering, Ferdowsi University of Mashhad, Mashhad, Iran
P A P E R I N F O
Paper history: Received 24 March 2013
Received in revised form 26 August 2013 Accepted 14 September 2013
Keywords:
Taguchi Technique Signal to Noise Analysis (S/N) Electrical Discharge Machining (EDM) Optimization
Genetic Algorithm (GA) Analysis of Variance (ANOVA)
A B S T R A C T
In this study the effect of input EDM parameters on the surface quality of 2312 hot worked steel parts has been modeled and optimized. The proposed approach is based on statistical analysis on the experimental data. The input parameters are peak current (I), pulse on time (Ton), pulse off time (Toff), duty factor (h)
and voltage (V). The experimental data are gathered using Taguchi L36 design matrix. In order to establish
the relations between input and output parameters, regression function has been fitted on the Signal to Noise ratios of the experimental data. The results of analysis of variance (ANOVA) revealed that pulse on time and peak currents significantly influence the surface quality. In the next stage, the developed model is embedded into a genetic algorithm to determine the optimal set of process parameters for any desired surface roughness (within feasible ranges). Using optimization results, a set of verification tests is performed to verify the accuracy of the optimization procedure in determining the optimal levels of machining parameters. Computational results indicate that the proposed modeling technique and genetic algorithm are quite efficient in modeling and optimization of EDM process parameters.
doi:10.5829/idosi.ije.2014.27.03c.09
1. INTRODUCTION1
Electrical discharge machining (EDM) is a non-conventional, thermo-electric process in which the material from work piece is eroded by a series of discharge sparks between the work and tool electrode immersed in a liquid dielectric medium. The electrical discharges melt and vaporize minute amounts of work material, which are then ejected and flushed away by the dielectric. EDM is an effective solution for machining hard conductive materials and reproducing complex shapes. This technique has been widely used in modern metal working industry for producing complex cavities in dies and moulds, which are otherwise difficult to create by conventional machining [1].
However, EDM is a costly process and hence proper selection of its process parameters is essential to increase production rate and improve product quality [2]. Metal removal process in EDM is characterized by
1*Corresponding Author Email: [email protected] (M. Azadi Moghaddam)
nonlinear, stochastic and time varying characteristics. In EDM, a quantitative relationship between the operating parameters and controllable input variables is often required [1].
EDM technique is especially useful when the work piece is hard, brittle and requires high surface finish. Therefore, the merits of the EDM technique become most apparent when machining such material as AISI 2312 hot worked steel parts which have very high hardness in reinforcement. In addition, mechanical and physical properties of hot worked steel such as hardness, toughness and high wear resistance has made it an important material for engineering components particularly in making moulds and dies [1-3].
Like any other machining processes, the performance of EDM is significantly affected by its process parameter settings. Important process parameters in EDM are peak current (I), voltage (V), pulse on time (Ton), pulse off time (Toff) and duty factor (h) [2, 4, 5]. These parameters, in turn, determine the process output characteristic, among which Surface Roughness (SR) is the most important one.
The superior performance of EDM over traditional machining technologies has already been proved in applying on materials with high strength, high hardness or more complicated shapes. Since the removal of meta in EDM is done by melting the unwanted parts of work piece by high temperature spark, many defects such as porosity, cracks, improper recast layer, residual stress are easily found on the work piece surface due to the rapid high temperature melting and cooling process during EDM. Thus, a comprehensive study to improve the surface roughness of EDMed work piece is the crucial topic. Many studies have noticed this unavoidable effect in EDM applications and have also proposed many prescriptions to fulfill the various criteria of industrial demanding. For instance, Mohri et al. [6-8] demonstrated that by adding powder into dielectric via EDM process, a mirror-like surface could be achieved. Luo et al. [9] suggested that either the low peak current or the short pulse duration for EDM could gain a better surface roughness in machining process. Narumiya et al. [10] improved the surface roughness of work piece by optimizing various combinations of powder added into dielectric. Saito et al. [11, 12] added conductive powders into dielectric to gain a better surface roughness on a large surface area of work piece in EDM process.
Kiyak and Cakır [13], have studied the effects of EDM parameter levels on surface roughness for machining of AISI P20 tool steel (40CrMnNiMo864) which is widely used in the production of plastic mold and die. It is observed that Surface roughness increases with increasing pulsed current and pulse time. Low current and pulse time produces minimum surface roughness that means good surface finish quality. The selection of these machining parameters is not useful because machining process generally becomes very slow. Material removal rate will be low and thus machining cost increases. This combination should be used in finish machining step of EDM process.
In recent years, statistical analysis and Design of Experiments (DOE) technique have increasingly been employed to establish the relationships between various process parameters and the process outputs in variety of manufacturing industries [2-5, 14].
2. FUNDAMENTAL PRINCIPLES OF EDM AND SURFACE ROUGHNESS
One of the most important features of the EDM method is its ability to work independently of the mechanical properties of the machined material. Once voltage is applied to the electrode and the work piece, electrons detached from the electrode (cathode) move accelerated towards the work piece. At the destination, they hit neutral dielectric molecules, removing more electrons. These electrons, in turn, accelerate the electron flow
towards the anode by similar collisions. This motion of electrons creates a leakage current in the dielectric, evaporating the dielectric fluid in this region. The current increases in the evaporating fluid. At the end, a
“plasma” channel is created between the electrode and the work piece [1]. Due to its high temperature, this channel melts/evaporates a “crater” on both the work piece and the electrode. After the plasma channel extinguishes, all of the evaporated and a part of the melted material is flushed away by the flow of dielectric fluid. A small “crater” is created on the surface of the electrode and the work piece. Craters created by a multitude of plasma channels allow the surface machining. One of the most important parameters in the EDM processing is surface roughness. To determine the most optimum material removal time, it should be ensured that the surface roughness stays within an acceptable range [1].
Parameters affecting the characteristics of the EDM process are found to be discharge current, gap voltage, pulse on-time, pulse off time and duty factor. In this study, the effects of EDM parameter levels on AISI 2312 hot worked steel have been investigated. As mentioned earlier, SR is the most important performance characteristic in EDM. In turn, these output characteristic is determined by the process parameter settings, such as peak current (I), voltage (V), pulse on time (Ton), pulse off time (Toff) and duty factor (h).
The main objectives of the present study are: 1) to establish the relationship between EDM process parameters and the process output characteristic (surface roughness), and 2) to determine the optimal parameter levels for minimum surface roughness by application of simulated annealing algorithm. The proposed procedure is based on statistical analysis of the experimental data. The article concludes with the verification of the proposed approach and a summary of the major findings.
As mentioned earlier, basic parameters affecting the EDM process are briefly defined as follows [1]:
v Discharge current (I): value of the current applied to the electrode during pulse on-time in the EDM. Discharge current is one of the primary input parameters of an EDM process and together with discharge duration and relatively constant voltage for given tool and work piece materials.
v Gap voltage (V): voltage applied between the electrode and the work piece during the EDM.
v Pulse on-time (ton): time for which current is applied to the electrode during each EDM cycle. The amount of removed material is directly proportional to the quantity of energy applied during Pulse on-time. This energy is controlled by the current and the on-time.
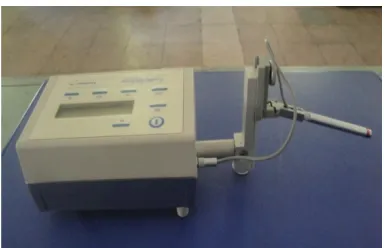
Figure 1. Die-sinking EDM machine used
Figure 2. Digital surface roughness tester and electronic balance
TABLE 1. Experimental set up and conditions
Equipment Specification
Machine tool EDM (Azarakhsh 304H), Cross Travel 3007kw, Iran ×250,
Work specimen material
2312 (40CrMnMoS86) hot worked steel with dimensions of 40×20×10 mm
Electrode Copper (99.8% purity and 8.98 g/cm
3 density)
with dimensions of Φ16×60 mm
Roughness tester Surtronic 3+ with 0.1 accuracy, Ra, German
Weighing
machine A&D, with 0.01 accuracy, Japan
Dielectric pure kerosene
TABLE 2. Design scheme of experimental parameters and levels for EDM
No Symbol Factor Unit Range L1 L2 L3
1 A TOFF μS 10 – 75 10 75 -
2 B TON μS 25-200 25 100 200
3 C I A 2.5-7.5 2.5 5 7.5
4 D h S 0.4-1.6 0.4 1 1.6
5 E V V 50-60 50 55 60
v Duty factor (η): Duty factor is a ratio of the pulse on time relative to the total cycle time. Generally, a higher duty factor means increased cutting efficiency.
The parameters explained above used as experimental variables define the value of roughness occurring on the surface of the work pieces. There is various simple surface roughness amplitude parameters used in industry, such as roughness average (Ra), root-mean-square (RMS) roughness (Rq), and maximum peak-to-valley roughness (Ry or Rmax), etc. [1]. The parameter Ra is used in this study. The average roughness (Ra) is the area between the roughness profile and its mean line, or the integral of the absolute value of the roughness profile height over the evaluation. Therefore, the Ra is specified by the following equation [1]:
( )x dx Y L Ra
L
ò
= 0 1
(1)
where Ra is the arithmetic average deviation from the mean line, L the sampling length, and Y the ordinate of the profile curve. There are many methods for measuring surface roughness, such as image processing, microscopes, stylus type instruments, profile tracing instruments, etc [1].
3. EXPERIMENTAL PROCEDURE AND DESIGN OF EXPERIMENTS (DOE)
In the present study, an Azerakhsh-304H die-sinking machine has been used to perform the experiments (Figure 1). The test specimens were of 40CrMnMoS86 hot worked steel. A total of 4 tests were performed on each samples, two tests on each side.
The electrodes were made of 16mm cylindrical shape copper. Pure kerosene was used as the dielectric fluid in all experiments. The 36 sets of data needed for modeling, are obtained using L36 Taguchi matrix. The Process parameters and levels used in the experiment, experimental set up and conditions are given in the Tables 1 and 2.
The SR is considered as the performance characteristic to evaluate the machining quality. The machining time for each test was 45 minutes. Furthermore, the experiments have been done in random order to increase accuracy.After machining, the surface finish of each specimen was measured with an automatic digital Surtronic (3+) SR tester (Figure 2).
4. ANALYSIS AND DISCUSSION OF THE EXPERIMENTAL RESULTS
space with small number of experiments [14]. It also makes use of signal–to noise (S/N) ratios as performance measures to optimize the output quality characteristic against such variations in noise factors. In this method, a loss function is defined to calculate the deviation between the experimental and desired values. This loss function is further transformed into S/N ratio. Based on the process under consideration, the S/N ratio calculation may be decided as “the Larger the Better, (LB)” or “the Smaller the Better, (SB)” as are given in the following equations [12]:
) 1 1 ( 10 / : 1 2
å
= -= mi yi m Log N S LB (2) ) 1 ( 10 / : 1 2
å
= -= m i i y m Log N S SB (3)In the above, S/N is the ratio calculated from the observed values, yi represents the experimentally observed value of the ith experiment, and m is the repeated number of each experiment. Since the SR is the measure of performance in EDM process, the SB criterion is selected for SR.
The matrix of experimental tests (L36), result of SR and its corresponding S/N ratio are shown in Table 3.
4. 2. Regression Modeling Many problems in engineering and science involve exploring the relationships between two or more variables. Regression analysis is a statistical technique that is very useful for these types of problems [15].
Regression models can be used to predict the behavior of input variables (independent variables) and output responses. In this paper, the output response is S/N's associated with experimental tests. In this study, various regression functions have been fitted on the data given in Table 3. Among these models, quadratic regression model was found to be the most appropriate in terms of estimating the real process. Equation (4) shows the adjusted second order regression model for EDM process: V × 0.0901 + V) × (I 000460 0. -I × T 0.00101 -I 0.00527 + T 0.000149 + 4.92 -T 0.0517 + 9.11 - = S/N on 2 2 on on ´ ´ ´ ´ ´ (4)
4. 3. Analysis of Variance (ANOVA) Analysis of variance (ANOVA) is a mathematical way to determine precision of modeling for a group of observations, which shows how the proposed model fits with experimental results [9]. ANOVA has been performed on the above model to assess their adequacy within the confidence limit of 95%. ANOVA results indicate that the model is adequate within the specified confidence limit. The calculated determination coefficient (R2) for this model is 95.2%. Result of ANOVA is shown in
Table 4. According to ANOVA procedure, large F–
value indicates that the variation of the process parameter makes a big change on the performance characteristics. In this study, a confidence level of 95% is selected to evaluate parameters significances [15-19].
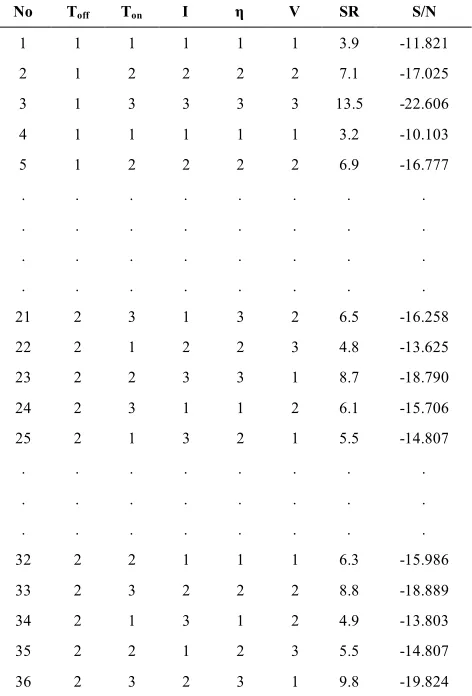
TABLE 3. Experimental lay out (L36), results of SR and S/N ratio
No Toff Ton I η V SR S/N
1 1 1 1 1 1 3.9 -11.821
2 1 2 2 2 2 7.1 -17.025
3 1 3 3 3 3 13.5 -22.606
4 1 1 1 1 1 3.2 -10.103
5 1 2 2 2 2 6.9 -16.777
. . . .
. . . .
. . . .
. . . .
21 2 3 1 3 2 6.5 -16.258
22 2 1 2 2 3 4.8 -13.625
23 2 2 3 3 1 8.7 -18.790
24 2 3 1 1 2 6.1 -15.706
25 2 1 3 2 1 5.5 -14.807
. . . .
. . . .
. . . .
32 2 2 1 1 1 6.3 -15.986
33 2 3 2 2 2 8.8 -18.889
34 2 1 3 1 2 4.9 -13.803
35 2 2 1 2 3 5.5 -14.807
36 2 3 2 3 1 9.8 -19.824
TABLE 4. Result of ANOVA for signal to noise ratio
Machining Parameters Degree of Freedom (Dof) Sum of Square (Ssj)
Adjusted
(Ssj) F-Value
A 1 2.937 2.937 2.62
B 2 246.909 246.909 110*
C 2 113.621 113.621 50.62*
D 2 2.021 2.021 0.90
E 2 4.104 4.104 1.83
Error 26 29.181 29.181 -
Total 35 398.771 - -
Figure 3. The effect of machining parameters on signal to noise (S/N)
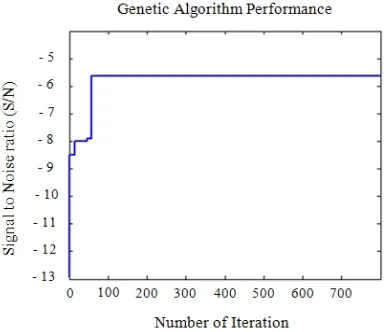
Figure 4. Genetic Algorithm convergence curve
TABLE 5. The best tuning parameters for the GA procedure No. of
Generations Population size Crossover rate mechanism Crossover Mutation rate
800 30 80% scatter 1%
TABLE 6. Results of confirmation experiments
Optimal Condition
Prediction Experiment Difference Error (%) S/N of
SR -6.4 -6.8 0.4 6.2
Parameter setting: (Toff = 20µs, Ton = 45 µs, I = 2.5 A, η = 0.4S, V =
60V)
The percent contribution of the EDM parameters on signal to noise ratio (S/N) is shown in Figure 3. According to Figure 3, pulse on time is the major factor affecting the S/N with 62% contribution. Whereas peak current, pulse off time, duty factor and voltage have smaller effects on S/N with 29, 1, 0.5 and 0.5% contributions, respectively. The remaining (7%) effects
are due to noise factors or uncontrollable parameters. Figure 4 shows the convergence curve towards the optimal solution.
5. GENETIC ALGORITHM
In this section, a Genetic Algorithm (GA) procedure is employed to determine the optimal machining parameters set in multi objective model. In the optimization process, the purpose is to maximize this objective function (Equation (4)). By doing so, the process parameters are calculated in such a way that the EDM parameters approach their desired values [20]. The best tuning parameters found for the algorithm are found through several test runs (Table 5).
6. CONFIRMATION EXPERIMENTS
To evaluate the adequacy of the proposed approach and statistical analysis, a verification test has been carried out based on the predicted value. The optimal levels of the process parameters are predicted based on S/N ratios given in Table 3. These settings should result in S/N ratios of -6.4. Table 6 shows the comparison between the predicted and experimental results using optimal process parameters. As indicated, the differences between predicted and actual process output is only 6.2%. Given the nature of EDM process and its many variables, these results are quite acceptable and prove that the experimental results are correlated with the estimated value.
7. CONCLUDING
performance would be optimized. The experimental result for the optimal setting shows that there is considerable improvement in the surface roughness; therefore, the proposed approach is quite capable in predicting and optimizing EDM process output. The approach proposed here, with minor changes, may be implemented for modeling and optimization of other manufacturing processes and engineering materials.
8. REFERENCES
1. Salman, Ö. and Kayacan, M. C., "Evolutionary programming method for modeling the edm parameters for roughness",
Journal of Materials Processing Technology, Vol. 200, No. 1, (2008), 347-355.
2. Lin, J. and Lin, C., "The use of the orthogonal array with grey relational analysis to optimize the electrical discharge machining process with multiple performance characteristics",
International Journal of Machine Tools and Manufacture, Vol. 42, No. 2, (2002), 237-244.
3. Yang, S.-H., Srinivas, J., Mohan, S., Lee, D.-M. and Balaji, S., "Optimization of electric discharge machining using simulated annealing", Journal of Materials Processing Technology, Vol. 209, No. 9, (2009), 4471-4475.
4. Hasçalık, A. and Çaydaş, U., "Electrical discharge machining of titanium alloy (Ti–6Al–4V)", Applied Surface Science, Vol. 253, No. 22, (2007), 9007-9016.
5. Fonda, P., Wang, Z., Yamazaki, K. and Akutsu, Y., "A fundamental study on Ti–6Al–4V's thermal and electrical properties and their relation to edm productivity", Journal of Materials Processing Technology, Vol. 202, No. 1, (2008), 583-589.
6. Mohri, N., Saito, N., Takawashi, T. and Kobayashi, K., "Mirror-like finishing by EDM(multi divided electrode method)", in Twenty-Fifth International Machine Tool Design and Research Conference. Vol., No., (1985), 329-336.
7. H. Narumiya, N. Mohri, N. Saito, H. Ootake, T. Takawashi, K. Kobayashi, “Finishing on the large area of work surface by EDM”, Journal of Japan Society of Precision Engineering Vol. 53, No. 1, (1987), 124-130.
8. Narumiya, H., Mohri, N. and Suzuki, M., "Surface modification by edm, research and technological development in nontraditional machining", in the Winter Annual Meeting of the ASME, Chicago,USA. (1988), 21-30.
9. Luo, Y., Zhang, Z., Yu, C. and Zhang, Y., "Mirror surface edm by electric field partially induced", CIRP Annals-Manufacturing Technology, Vol. 37, No. 1, (1988), 179-181. 10. Narumiya, H., Mohri, N., Saito, N., Ootake, H., Tsunekawa, Y.,
Takawashi, T., and Kobayashi, K., "Edm by powder suspended working fluid", in Proceedings of 9th International Symposium on Electromachining (ISEM IX). (1989), 5-8.
11. N. Saito, N. Mohri, “Improvement of machined surface roughness in large area EDM”, Journal of the Japan Society of Precision Engineering, Vol. 57, No. 6, (1991), 954-958. 12. Yan, B.-H. and Chen, S.-L., "Effects of dielectric with
suspended aluminum powder on edm", Journal-Chinese Society of Mechanical Engineers, Vol. 14, (1993), 307-307.
13. Kiyak, M. and Çakır, O., "Examination of machining parameters on surface roughness in EDM of tool steel", Journal of Materials Processing Technology, Vol. 191, No. 1, (2007), 141-144.
14. Rao, G. K. M., Rangajanardhaa, G., Rao, D. H. and Rao, M. S., "Development of hybrid model and optimization of surface roughness in electric discharge machining using artificial neural networks and genetic algorithm", Journal of Materials Processing Technology, Vol. 209, No. 3, (2009), 1512-1520. 15. Sarkar, S., Mitra, S. and Bhattacharyya, B., "Parametric
optimisation of wire electrical discharge machining of γ titanium aluminide alloy through an artificial neural network model", The International Journal of Advanced Manufacturing Technology, Vol. 27, No. 5-6, (2006), 501-508.
16. Kolahan, F., Golmezergy, R. and Moghaddam, M. A., "Multi objective optimization of turning process using grey relational analysis and simulated annealing", Applied Mechanics and Materials, Vol. 110-116, (2012), 2926-2932.
17. Vishwakarma, M., Parashar, V. and Khare, V., "Regression analysis and optimization of material removal rate on electric discharge machine for en-19 alloy steel", Vol. 2, No. 11, (2012) 18. Asal, V. D., Patel, R. I. and Choudhary, A. B., "Optimization of
process parameters of EDM using anova method", International Journal of Engineering Research and Applications, Vol. 3, No. 2, (2013), 1119-1125.
19. Kumar, A., Kumar, V. and Kumar, J., "Prediction of surface roughness in wire electric discharge machining (WEDM) process based on response surface methodology", International Jl. of Engineering &Technology, Vol. 2, No. 4, (2012), 708-719.
Modeling and Optimization of Surface Roughness of AISI2312 Hot Worked Steel in
EDM based on Mathematical Modeling and Genetic Algorithm
M. Azadi Moghaddam, F. Kolahan
Department of Mechanical Engineering, Ferdowsi University of Mashhad, Mashhad, Iran
P A P E R I N F O
Paper history: Received 24 March 2013
Received in revised form 26 August 2013 Accepted 14 September 2013
Keywords:
Taguchi Technique Signal to Noise Analysis (S/N) Electrical Discharge Machining (EDM) Optimization
Genetic Algorithm (GA) Analysis of Variance (ANOVA)
هﺪﯿﮑﭼ
ﻦﯿﺷﺎﻣﯽﻤﯿﻈﻨﺗيﺎﻫﺮﺘﻣارﺎﭘﺮﯿﺛﺎﺗﻖﯿﻘﺤﺗﻦﯾارد
مﺮﮔدﻻﻮﻓﺢﻄﺳﺖﯿﻔﯿﮐﺮﺑﯽﮑﯾﺮﺘﮑﻟاﻪﯿﻠﺨﺗيرﺎﮐ
رﺎﮐ
2312
لﺪﻣ
ﻪﻨﯿﻬﺑويزﺎﺳ
-ﺖﺳاهﺪﺷيزﺎﺳ
.
شورﻪﺑدﺎﻨﺘﺳاﺎﺑهﺪﺷﻪﺋاراشور
هدادﺮﺑويرﺎﻣآيﺎﻫ
ﺖﺳاﻪﺘﻓﺎﯾمﺎﺠﻧاﯽﺑﺮﺠﺗيﺎﻫ
.
يدورويﺎﻫﺮﺘﻣارﺎﭘ
،ﻪﺘﯿﺴﯾﺮﺘﮑﻟانﺎﯾﺮﺟﻞﻣﺎﺷ
نﺎﻣز
ژﺎﺘﻟوورﺎﮐرﻮﺘﮐﺎﻓ،ﺲﻟﺎﭘﯽﺷﻮﻣﺎﺧوﯽﻨﺷوريﺎﻫ
ﯽﻣيرﺎﮐ
ﺪﻨﺷﺎﺑ
.
ﻦﯿﻨﭽﻤﻫ ،
ناﻮﻨﻋ ﻪﺑﺢﻄﺳيﺮﺑز
ﺮﻓﯽﺟوﺮﺧﻪﺼﺨﺸﻣ
ا
هﺪﺷﻪﺘﻓﺮﮔﺮﻈﻧردﺪﻨﯾ
ﺖﺳا
.
هداديروآدﺮﮔرﻮﻈﻨﻣﻪﺑ
ﺶﯾﺎﻣزآ،ﻖﯿﻘﺤﺗﻦﯾامﺎﺠﻧاردزﺎﯿﻧدرﻮﻣيﺎﻫ
یﺎﻫ
ﯽﭼﻮﮔﺎﺗحﺮﻃزاهدﺎﻔﺘﺳاﺎﺑﯽﺑﺮﺠﺗ
L36
ﺖﺳاهﺪﺷمﺎﺠﻧا
.
ﻪﺼﺨﺸﻣويدورويﺎﻫﺮﺘﻣارﺎﭘﻦﯿﺑطﺎﺒﺗرادﺎﺠﯾارﻮﻈﻨﻣﻪﺑ
ﺎﺑﯽﺟوﺮﺧ
ﻪﺑ
ﻊﺑﺎﺗيﺮﯿﮔرﺎﮐ
،ﯽﻧﻮﯿﺳﺮﮔر لﺪﻣ
ﺰﯾﻮﻧﻪﺑلﺎﻨﮕﯿﺳﺮﯾدﺎﻘﻣﺮﺑﯽﻨﺘﺒﻣﯽﺿﺎﯾر
ﯽﺣاﺮﻃ هﺪﺷ ﺖﺳا
.
ﯽﻣنﺎﺸﻧﺲﻧﺎﯾراوﺰﯿﻟﺎﻧآﺞﯾﺎﺘﻧ
ﺪﻫد
ﯽﻬﺟﻮﺗﻞﺑﺎﻗرﻮﻃﻪﺑﻪﺘﯿﺴﯾﺮﺘﮑﻟانﺎﯾﺮﺟوﺲﻟﺎﭘﯽﻨﺷورنﺎﻣزﻪﮐ
ﯽﻣراﺮﻗﺮﯿﺛﺎﺗﺖﺤﺗارﺢﻄﺳﺖﯿﻔﯿﮐ
ﺪﻨﻫد
.
رد ﺶﺨﺑ
لﺪﻣﺪﻌﺑ
ردنﻮﯿﺳﺮﮔر
ﻢﺘﯾرﻮﮕﻟا ﮏﯿﺘﻧژ ﻪﺘﺷاﺬﮔ
هاﻮﺨﻟدﺢﻄﺳﯽﻓﺎﺻﺮﻫياﺮﺑﯽﻤﯿﻈﻨﺗيﺎﻫﺮﺘﻣارﺎﭘﻪﻨﯿﻬﺑحﻮﻄﺳﺎﺗﺪﺷ
)
ﻞﺑﺎﻗهدوﺪﺤﻣرد
لﻮﺒﻗ
(
ددﺮﮔﻦﯿﯿﻌﺗ
.
ﻪﺤﺻرﻮﻈﻨﻣﻪﺑ
ﻪﻨﯿﻬﺑشوريراﺬﮔ
ﻪﻋﻮﻤﺠﻣ،يرﺎﮐﻦﯿﺷﺎﻣﻪﻨﯿﻬﺑحﻮﻄﺳﻦﯿﯿﻌﺗرديزﺎﺳ
زايا
ﺶﯾﺎﻣزآ
یﺎﻫ
ﻪﻨﯿﻬﺑﺞﯾﺎﺘﻧزاهدﺎﻔﺘﺳاﺎﺑﯽﺑﺮﺠﺗ
مﺎﺠﻧايزﺎﺳ
ﺪﺷ
.
لﺪﻣﮏﯿﻨﮑﺗﻪﮐدادنﺎﺸﻧﯽﺗﺎﺒﺳﺎﺤﻣﺞﯾﺎﺘﻧ
ﻪﻨﯿﻬﺑشوروهﺪﺷﻪﺋارايزﺎﺳ
يزﺎﺳ
ﻪﻨﯿﻬﺑويزﺎﺳلﺪﻣردﮏﯿﺘﻧژﻢﺘﯾرﻮﮕﻟا
ﻦﯿﺷﺎﻣيﺎﻫﺮﺘﻣارﺎﭘيزﺎﺳ
ﺪﻧراديﺮﺛﻮﻣﯽﯾارﺎﮐﯽﮑﯾﺮﺘﮑﻟاﻪﯿﻠﺨﺗيرﺎﮐ
.