I
I
I
N
N
N
T
T
T
E
E
E
R
R
R
N
N
N
A
A
A
T
T
T
I
I
I
O
O
O
N
N
N
A
A
A
L
L
L
J
J
J
O
O
O
U
U
U
R
R
R
N
N
N
A
A
A
L
L
L
O
O
O
F
F
F
R
R
R
E
E
E
S
S
S
E
E
E
A
A
A
R
R
R
C
C
C
H
H
H
I
I
I
N
N
N
C
C
C
O
O
O
M
M
M
M
M
M
E
E
E
R
R
R
C
C
C
E
E
E
,
,
,
I
I
I
T
T
T
A
A
A
N
N
N
D
D
D
M
M
M
A
A
A
N
N
N
A
A
A
G
G
G
E
E
E
M
M
M
E
E
E
N
N
N
T
T
T
A Monthly Double-Blind Peer Reviewed Refereed Open Access International e-Journal - Included in the International Serial Directories
Indexed & Listed at: Ulrich's Periodicals Directory ©, ProQuest, U.S.A., Open J-Gage, India as well as in Cabell’s Directories of Publishing Opportunities, U.S.A.
C
C
C
CONTENTS
ONTENTS
ONTENTS
ONTENTS
Sr.
No.
TITLE & NAME OF THE AUTHOR (S)
Page No.
1
.
FORCASTING OF FINANCIAL MARKETS - APPLICATION OF FUZZY ASSOCIATION RULESBHAGIRATHI NAYAK, DR. C. NAHAK & DR. ARUN KR. MISRA
1
2
.
PERCEIVED QUALITY OF SERVICES RENDERED BY UNIVERSITY LIBRARY: A CASE STUDY OF PANJAB UNIVERSITY MAIN LIBRARY, CHANDIGARH, INDIADR. TESFATSION SAHLU DESTA
9
3
.
DYNAMIC COMPENSATION SYSTEM FOR PAKISTANRABIA MUSHTAQ
20
4
.
DESIGN AND IMPLEMENTATION OF EXAMPLE BASED ENGLISH-HINDI MACHINE TRANSLATION SYSTEMVIVEK DUBEY & DR. H. R. SHARMA
26
5
.
INDIAN TELECOMMUNICATION SECTOR: A PARADIGM SHIFTDR. HARSH DWIVEDI & KAVYA SAINI
29
6
.
A STUDY ON CONSTRUCTION OF EQUITY PORTFOLIO (OIL, IT, STEEL AND BANKING STOCKS) WITH REFERENCE TO THE SHARPE INDEX MODELP.VARADHARAJAN & DR. P VIKKRAMAN
38
7
.
A STUDY ON ECONOMIC EMPOWERMENT OF WOMEN THROUGH SELF HELP GROUPS IN MAHABUBNAGAR DISTRICT OF ANDHRA PRADESHM V S MAHENDRA, S ANANDA REDDY & M S BHAT
44
8
.
A STUDY ON THE RELATIONSHIP BETWEEN GOLD, SILVER AND NIFTYR.KARTHIKEYAN & DR. M. G. SARAVANARAJ
50
9
.
TV VIEWING PRACTICES OF INDIAN CHILDRENDR. PAVLEEN KAUR & DR. RAGHBIR SINGH
66
10
.
TOURISM POTENTIAL IN VELLORE REGION - AN EMPIRICAL STUDYDR. D. ASHOK
71
11
.
A STUDY ON STEPS TAKEN TO INPROVE CREDIT AND SAVINGS IN RURAL INDIADR. P. UMA RANI
73
12
.
HEALTHCARE SERVICES IN INDIA: A STRATEGIC PERSPECTIVEDR. PRESHTH BHARDWAJ & DR. JAYRAJ D. JADEJA
78
13
.
INCREASING WOMEN EMPLOYMENT IN IT INDUSTRY: AN ANALYSIS OF REASONSS. ANNAPOORNA & S. T. BAGALKOTI
87
14
.
IMPACT OF ORGANIZATIONAL CLIMATE, ROLE AMBIGUITY AND ROLE CONFLICT ON ORGANIZATIONAL COMMITMENT AMONG THE FACULTY IN ENGINEERING COLLEGESDR. T. G. VIJAYA & R. HEMAMALINI
90
15
.
PERFORMANCE APPRAISAL SYSTEM IN INCOME TAX DEPARTMENT: A CASE STUDYDR. TEJ SINGH & DR. RAJIV RATAN
95
16
.
ROBUST AWARENESS ON INDIAN INSURANCE INDUSTRY IN TIER THREE CITIESDR. T.V. MALICK, DR. V. SELVAM & N. ABDUL NAZAR
101
17
.
AWARENESS AND PERCEPTIONS OF E-BANKING CUSTOMERS IN CHHATTISGARH (INDIA)A. K. CHANDRA & D. K. GANGESHWAR
105
18
.
COMPARATIVE STUDY OF PARAMETRIC AND NON-PERAMETRIC VALUE AT RISK (VaR) METHODSVIKRANT VIKRAM SINGH, ANOOP MOHANTY & SUMIT GOYAL
109
19
.
A STUDY TO DETERMINE THE EFFECTIVENESS OF THE TRAINING PROGRAMMES AT ONE OF THE NAVRATNA COMPANY IN ELECTRONIC INDUSTRYDR. R. PADMAJA
118
20
.
IMPLEMENTATION OF CRM WITH INFORMATION TECHNOLOGY IN HIGHER EDUCATIONDR. NARINDER TANWAR
125
21
.
PERFORMANCE ANALYSIS OF SOFTWARE INDUSTRIES THROUGH VALUE ADDED APPROACH - AN EMPIRICAL STUDY ON INFOSYS LTD.DR. R. KRISHNAKUMAR
129
22
.
TECHNOLOGICAL SERVICES IN RURAL BANKING: A STUDY WITH REFERENCE TO BANK BRANCHES IN TIRUNELVELI DISTRICTD. DEVANDHIRAN & SREEHARI .R
133
23
.
VICKS VAPORUB - MOTHER’S TOUCH THERAPY: A CASE STUDYRAJNI KAMBOJ
141
24
.
THE RELATIONSHIP BETWEEN LOCUS OF CONTROL AND ROLE STRESS AMONG ENGINEERS AND PERSONNELR. SUBASREE
144
25
.
THE LEGAL LACUNAS OF AN INDIAN CORPORATION’S CRIMINAL LIABILITYDR. SHRUTI BEDI
149
INTERNATIONAL JOURNAL OF RESEARCH IN COMMERCE, IT & MANAGEMENT
CHIEF PATRON
CHIEF PATRON
CHIEF PATRON
CHIEF PATRON
PROF. K. K. AGGARWAL
Chancellor, Lingaya’s University, Delhi
Founder Vice-Chancellor, Guru Gobind Singh Indraprastha University, Delhi
Ex. Pro Vice-Chancellor, Guru Jambheshwar University, Hisar
PATRON
PATRON
PATRON
PATRON
SH. RAM BHAJAN AGGARWAL
Ex. State Minister for Home & Tourism, Government of Haryana
Vice-President, Dadri Education Society, Charkhi Dadri
President, Chinar Syntex Ltd. (Textile Mills), Bhiwani
CO
CO
CO
CO----ORDINATOR
ORDINATOR
ORDINATOR
ORDINATOR
AMITA
Faculty, E.C.C., Safidon, Jind
ADVISORS
ADVISORS
ADVISORS
ADVISORS
PROF. M. S. SENAM RAJU
Director A. C. D., School of Management Studies, I.G.N.O.U., New Delhi
PROF. M. N. SHARMA
Chairman, M.B.A., Haryana College of Technology & Management, Kaithal
PROF. S. L. MAHANDRU
Principal (Retd.), Maharaja Agrasen College, Jagadhri
EDITOR
EDITOR
EDITOR
EDITOR
PROF. R. K. SHARMA
Dean (Academics), Tecnia Institute of Advanced Studies, Delhi
CO
CO
CO
CO----EDITOR
EDITOR
EDITOR
EDITOR
DR. BHAVET
Faculty, M. M. Institute of Management, Maharishi Markandeshwar University, Mullana, Ambala, Haryana
EDITORIAL ADVISORY BOARD
EDITORIAL ADVISORY BOARD
EDITORIAL ADVISORY BOARD
EDITORIAL ADVISORY BOARD
DR. AMBIKA ZUTSHI
Faculty, School of Management & Marketing, Deakin University, Australia
DR. VIVEK NATRAJAN
Faculty, Lomar University, U.S.A.
DR. RAJESH MODI
Faculty, Yanbu Industrial College, Kingdom of Saudi Arabia
PROF. SANJIV MITTAL
University School of Management Studies, Guru Gobind Singh I. P. University, Delhi
PROF. ANIL K. SAINI
Chairperson (CRC), Guru Gobind Singh I. P. University, Delhi
DR. KULBHUSHAN CHANDEL
Reader, Himachal Pradesh University, Shimla
DR. TEJINDER SHARMA
INTERNATIONAL JOURNAL OF RESEARCH IN COMMERCE, IT & MANAGEMENT
DR. SAMBHAVNA
Faculty, I.I.T.M., Delhi
DR. MOHENDER KUMAR GUPTA
Associate Professor, P. J. L. N. Government College, Faridabad
DR. SHIVAKUMAR DEENE
Asst. Professor, Government F. G. College Chitguppa, Bidar, Karnataka
MOHITA
Faculty, Yamuna Institute of Engineering & Technology, Village Gadholi, P. O. Gadhola, Yamunanagar
ASSOCIATE EDITORS
ASSOCIATE EDITORS
ASSOCIATE EDITORS
ASSOCIATE EDITORS
PROF. NAWAB ALI KHAN
Department of Commerce, Aligarh Muslim University, Aligarh, U.P.
PROF. ABHAY BANSAL
Head, Department of Information Technology, Amity School of Engineering & Technology, Amity University, Noida
PROF. A. SURYANARAYANA
Department of Business Management, Osmania University, Hyderabad
DR. ASHOK KUMAR
Head, Department of Electronics, D. A. V. College (Lahore), Ambala City
DR. JATINDERKUMAR R. SAINI
Head, Department of Computer Science, S. P. College of Engineering, Visnagar, Mehsana, Gujrat
DR. V. SELVAM
Divisional Leader – Commerce SSL, VIT University, Vellore
DR. PARDEEP AHLAWAT
Reader, Institute of Management Studies & Research, Maharshi Dayanand University, Rohtak
S. TABASSUM SULTANA
Asst. Professor, Department of Business Management, Matrusri Institute of P.G. Studies, Hyderabad
TECHNICAL ADVISOR
TECHNICAL ADVISOR
TECHNICAL ADVISOR
TECHNICAL ADVISOR
AMITA
Faculty, E.C.C., Safidon, Jind
MOHITA
Faculty, Yamuna Institute of Engineering & Technology, Village Gadholi, P. O. Gadhola, Yamunanagar
FINANCIAL ADVISORS
FINANCIAL ADVISORS
FINANCIAL ADVISORS
FINANCIAL ADVISORS
DICKIN GOYAL
Advocate & Tax Adviser, Panchkula
NEENA
Investment Consultant, Chambaghat, Solan, Himachal Pradesh
LEGAL ADVISORS
LEGAL ADVISORS
LEGAL ADVISORS
LEGAL ADVISORS
JITENDER S. CHAHAL
Advocate, Punjab & Haryana High Court, Chandigarh U.T.
CHANDER BHUSHAN SHARMA
Advocate & Consultant, District Courts, Yamunanagar at Jagadhri
SUPERINTENDEN
SUPERINTENDEN
SUPERINTENDEN
SUPERINTENDENT
T
T
T
INTERNATIONAL JOURNAL OF RESEARCH IN COMMERCE, IT & MANAGEMENT
CALL FOR MANUSCRIPTS
CALL FOR MANUSCRIPTS
CALL FOR MANUSCRIPTS
CALL FOR MANUSCRIPTS
We
invite unpublished novel, original, empirical and high quality research work pertaining to recent developments & practices in
the area of Computer, Business, Finance, Marketing, Human Resource Management, General Management, Banking, Insurance,
Corporate Governance and emerging paradigms in allied subjects like Accounting Education; Accounting Information Systems;
Accounting Theory & Practice; Auditing; Behavioral Accounting; Behavioral Economics; Corporate Finance; Cost Accounting;
Econometrics; Economic Development; Economic History; Financial Institutions & Markets; Financial Services; Fiscal Policy;
Government & Non Profit Accounting; Industrial Organization; International Economics & Trade; International Finance; Macro
Economics; Micro Economics; Monetary Policy; Portfolio & Security Analysis; Public Policy Economics; Real Estate; Regional
Economics; Tax Accounting; Advertising & Promotion Management; Business Education; Business Information Systems (MIS);
Business Law, Public Responsibility & Ethics; Communication; Direct Marketing; E-Commerce; Global Business; Health Care
Administration; Labor Relations & Human Resource Management; Marketing Research; Marketing Theory & Applications;
Non-Profit Organizations; Office Administration/Management; Operations Research/Statistics; Organizational Behavior & Theory;
Organizational Development; Production/Operations; Public Administration; Purchasing/Materials Management; Retailing;
Sales/Selling; Services; Small Business Entrepreneurship; Strategic Management Policy; Technology/Innovation; Tourism,
Hospitality & Leisure; Transportation/Physical Distribution; Algorithms; Artificial Intelligence; Compilers & Translation; Computer
Aided Design (CAD); Computer Aided Manufacturing; Computer Graphics; Computer Organization & Architecture; Database
Structures & Systems; Digital Logic; Discrete Structures; Internet; Management Information Systems; Modeling & Simulation;
Multimedia; Neural Systems/Neural Networks; Numerical Analysis/Scientific Computing; Object Oriented Programming;
Operating Systems; Programming Languages; Robotics; Symbolic & Formal Logic; Web Design. The above mentioned tracks are
only indicative, and not exhaustive.
Anybody can submit the soft copy of his/her manuscript
anytime
in M.S. Word format after preparing the same as per our
submission guidelines duly available on our website under the heading guidelines for submission, at the email addresses,
or
.
GUIDELINES FOR SUBMISSION OF MANUSCRIPT
GUIDELINES FOR SUBMISSION OF MANUSCRIPT
GUIDELINES FOR SUBMISSION OF MANUSCRIPT
GUIDELINES FOR SUBMISSION OF MANUSCRIPT
1. COVERING LETTER FOR SUBMISSION:
DATED: _____________
THE EDITOR
IJRCM
Subject:
SUBMISSION OF MANUSCRIPT IN THE AREA OF .
(e.g. Computer/IT/Finance/Marketing/HRM/General Management/other, please specify)
.
DEAR SIR/MADAM
Please find my submission of manuscript titled ‘___________________________________________’ for possible publication in your journal.
I hereby affirm that the contents of this manuscript are original. Furthermore it has neither been published elsewhere in any language fully or partly, nor is it under review for publication anywhere.
I affirm that all author (s) have seen and agreed to the submitted version of the manuscript and their inclusion of name (s) as co-author (s).
Also, if our/my manuscript is accepted, I/We agree to comply with the formalities as given on the website of journal & you are free to publish our contribution to any of your journals.
NAME OF CORRESPONDING AUTHOR: Designation:
INTERNATIONAL JOURNAL OF RESEARCH IN COMMERCE, IT & MANAGEMENT
Residential address with Pin Code:
Mobile Number (s):
Landline Number (s):
E-mail Address:
Alternate E-mail Address:
2. INTRODUCTION: Manuscript must be in British English prepared on a standard A4 size paper setting. It must be prepared on a single space and single column with 1” margin set for top, bottom, left and right. It should be typed in 8 point Calibri Font with page numbers at the bottom and centre of the every page.
3. MANUSCRIPT TITLE: The title of the paper should be in a 12 point Calibri Font. It should be bold typed, centered and fully capitalised.
4. AUTHOR NAME(S) & AFFILIATIONS: The author (s) full name, designation, affiliation (s), address, mobile/landline numbers, and email/alternate email address should be in italic & 11-point Calibri Font. It must be centered underneath the title.
5. ABSTRACT: Abstract should be in fully italicized text, not exceeding 250 words. The abstract must be informative and explain the background, aims, methods, results & conclusion in a single para.
6. KEYWORDS: Abstract must be followed by list of keywords, subject to the maximum of five. These should be arranged in alphabetic order separated by commas and full stops at the end.
7. HEADINGS: All the headings should be in a 10 point Calibri Font. These must be bold-faced, aligned left and fully capitalised. Leave a blank line before each heading.
8. SUB-HEADINGS: All the sub-headings should be in a 8 point Calibri Font. These must be bold-faced, aligned left and fully capitalised. 9. MAIN TEXT: The main text should be in a 8 point Calibri Font, single spaced and justified.
10. FIGURES &TABLES: These should be simple, centered, separately numbered & self explained, and titles must be above the tables/figures. Sources of data should be mentioned below the table/figure. It should be ensured that the tables/figures are referred to from the main text.
11. EQUATIONS: These should be consecutively numbered in parentheses, horizontally centered with equation number placed at the right.
12. REFERENCES: The list of all references should be alphabetically arranged. It must be single spaced, and at the end of the manuscript. The author (s) should mention only the actually utilised references in the preparation of manuscript and they are supposed to follow Harvard Style of Referencing. The author (s) are supposed to follow the references as per following:
•
All works cited in the text (including sources for tables and figures) should be listed alphabetically.•
Use (ed.) for one editor, and (ed.s) for multiple editors.•
When listing two or more works by one author, use --- (20xx), such as after Kohl (1997), use --- (2001), etc, in chronologically ascending order.•
Indicate (opening and closing) page numbers for articles in journals and for chapters in books.•
The title of books and journals should be in italics. Double quotation marks are used for titles of journal articles, book chapters, dissertations, reports, working papers, unpublished material, etc.•
For titles in a language other than English, provide an English translation in parentheses.•
The location of endnotes within the text should be indicated by superscript numbers.PLEASE USE THE FOLLOWING FOR STYLE AND PUNCTUATION IN REFERENCES:
BOOKS
•
Bowersox, Donald J., Closs, David J., (1996), "Logistical Management." Tata McGraw, Hill, New Delhi.•
Hunker, H.L. and A.J. Wright (1963), "Factors of Industrial Location in Ohio," Ohio State University.CONTRIBUTIONS TO BOOKS
•
Sharma T., Kwatra, G. (2008) Effectiveness of Social Advertising: A Study of Selected Campaigns, Corporate Social Responsibility, Edited by David Crowther & Nicholas Capaldi, Ashgate Research Companion to Corporate Social Responsibility, Chapter 15, pp 287-303.JOURNAL AND OTHER ARTICLES
•
Schemenner, R.W., Huber, J.C. and Cook, R.L. (1987), "Geographic Differences and the Location of New Manufacturing Facilities," Journal of Urban Economics, Vol. 21, No. 1, pp. 83-104.CONFERENCE PAPERS
•
Garg Sambhav (2011): "Business Ethics" Paper presented at the Annual International Conference for the All India Management Association, New Delhi, India, 19–22 June.UNPUBLISHED DISSERTATIONS AND THESES
•
Kumar S. (2011): "Customer Value: A Comparative Study of Rural and Urban Customers," Thesis, Kurukshetra University, Kurukshetra.ONLINE RESOURCES
•
Always indicate the date that the source was accessed, as online resources are frequently updated or removed.WEBSITE
INTERNATIONAL JOURNAL OF RESEARCH IN COMMERCE, IT & MANAGEMENT
A STUDY ON THE RELATIONSHIP BETWEEN GOLD, SILVER AND NIFTY
R.KARTHIKEYAN
RESEARCH SCHOLAR, ANNA UNIVERSITY OF TECHNOLOGY COIMBATORE
LECTURER
DEPARTMENT OF MANAGEMENT STUDIES
TAMILNADU COLLEGE OF ENGINEERING
COIMBATORE – 641 659
DR. M. G. SARAVANARAJ
HEAD & PROFESSOR
DEPARTMENT OF MANAGEMENT STUDIES
MUTHAYAMMAL ENGINEERING COLLEGE
RASIPURAM
ABSTRACT
The study has attempted to analyze the need and importance of commodity market and the current position of the bullion in the stock exchange. The study is fully based on the secondary data from records and values of the bullion commodity in the exchange. From the analysis the value of data were collected and the collection of data were tabulated and presented in the appropriate places of various chapters. Besides the strategies was evaluated by analyzing and interpreting the values with the help of various technical ratios. Investor understands the basic elements of commodities market investing and their fund affect on the potential value of the investments over the years. The past performance is used as an important tool. Investors have to look for consistency, though it is known that new investments flow into top performing funds, based on performance ranking. The researchers suggested that the investors can take decision based on these results. Techniques and tools used helps to analyze the investment opportunities in the market. The research hopes that the suggestions will be implemented for the betterment of the investors and also for the general public to get an idea about the investment in a profitable manner.
KEYWORDS
Gold, Silver and Nifty, Commodities, Stock Exchange, Risk, Return.
INTRODUCTION
he study examines the impact of few economic indicators like gold and silver prices. The Commodity market plays a vital role in promoting economic growth through the mobilization of long-term savings and the savings get invested in the economy for production purpose. This study analysis the performance of the gold, silver & nifty to understand the concept and importance of the commodity market. Basically gold is an inflation hedge. If inflation of any country increases, investors will buy gold to balance their portfolio and the price of gold will move up. So during inflation the gold price rises and the stock market falls.
In an economy all the savings are not invested in the stock market. Certain portion of the money is invested as bank deposits. When people invest money directly in the stock market they have to bear the risk involved. Investing in stock market may give more return than the risk less return, but it also involves high risk. When money is deposited in Banks, the bank takes responsibility of the risk involved. Bank charge higher interest and gives guaranteed return to the investors. Since banks take the responsibility of risk, it charges high interest rate to the companies and pays less interest to deposits. It clearly shows that the proper and protected investment is of investing in the commodity market.
To accomplish the goal of earning a relatively high return in commodity market, an essential task for investors to develop investment objectives. So informed decision can be made regarding risk and return trade- off. There is some indirect relationship between these three things (i.e. gold, silver and nifty). So to assess the relationship between these three things the following study is carried out.
STATEMENT OF PROBLEM
To find out the overall information for investors, in which time to invest the money in commodities market and what is the movement of price in commodities market. It also helps to analyze when the trend will reverse and also to find out the best way to invest in the markets for the investors.
OBJECTIVES OF THE STUDY
• To study about the performance of the gold, silver and nifty during the period. • To study the impact of gold, silver BSE SENSEX.
• To understand the concept and importance of the commodities market. • To analyze the risk involved in the gold and silver prices.
• To rank the gold, silver based on their performance. • To analyze the general trend in the bullion market.
• To understand the up and down movement of price in bullion market. • To know the time to invest money in bullion commodity market by investors.
SCOPE OF THE STUDY
A better understanding of the commodity market trend will facilitate allocation of financial resources to the most profitable investment opportunity. The study also helps the customers to ascertain the risk and return of the commodities. This will help the investor viz, individuals, FIIS in identifying the commodity which would yield them higher return and lesser risk.
The result of this study indicates short-term relationship of specific macroeconomic elements to the Bombay stock exchange. Investors can predict the volatility of the stock market due to the changes in economic indicators.
LIMITATIONS OF THE STUDY
All the projects are hindered in their smooth flow by some problems. The problems arise in the form of constrains by time and scope of the study. The current project was also faced by certain problem. Some of the problems faced in the course of the project are as follows:
INTERNATIONAL JOURNAL OF RESEARCH IN COMMERCE, IT & MANAGEMENT
• Period of study is restricted to past half Year so the conclusion based on this report is limited to that extent. • The tools used for analysis is subject to inherent limitations.
• External factors which affect the price movement of the market. • It cannot allow for good forecasting or determination of price objectives. • Using of Secondary data.
RESEARCH METHODOLOGY
Research methodology is a way of systematically solving the research problem. Research Methodology deals with the research design used and other methods used to present the study. Here researcher describes the statement of the problem, objectives of the study.
TYPE OF RESEARCH
The descriptive method of research type employed in the study portrays the performance of the different prices of Gold, Silver were taken under study. Since descriptive research studies are concerned with describing the characteristics of a particular individual, or of a group, the same is used for studying the performance of the different prices in the market.
SOURCES OF DATA
The data was collected with secondary data collection method. Secondary data is the data collected from secondary sources. In this research it is collected through various journals, magazines and websites.
For the purpose of this study, the price movements are computed and studied. The risk free rate which is the rate of return of the 90 – day’s Treasury bill is obtained from the websites. The return values of the different markets, the standard deviation values used in the calculation of the Sharpe ratio, and the beta value used for the calculation of the Treynor ratio are manually calculated from the closing prices of Gold, Silver.
TOOLS AND TECHNIQUES USED
The two ways in which the analysis is done are Risk - adjusted performance evaluation by • Beta
• Mean
• Standard deviation • Sharpe ratio • Treynor ratio • Correlation
BETA
The degrees to which different portfolios are affected by these systematic risks as compared to the effect on the market as a whole is measured by Beta. The Beta factor describes the movement in a stock’s or portfolio’s returns in relation to that of the market return.
The main purpose of using slope or beta is to predict the change in the market. Beta is a measure of the market or non-diversible risk associated with any given security in the market. The formula for predicting Beta is as follows:
Returns = (P1-P0/P0)*100
Where,
P1 today’s close
P0 previous close
Beta = Cov (x,y) / var (x)
MEAN
A measure of the central tendency of a data set, the mean is the average value in a data set. It is determined by adding all the values and dividing the sum by the number of values in the data set.
Mean = ∑ Xi
--- n where, i = 1,2,3,….n
n = number of samples (or) number of values
STANDARD DEVIATION
The standard deviation is less affected than the range by extreme and untypical values. It is a very accurate measurement for showing how closely the values in the list cluster around or diverge from the average. The standard deviation is lower if the values cluster closely around the mean and becomes higher the more they diverge from it. For the mathematically inclined, the standard deviation is defined as the square root of the variance, or
Standard deviation = √∑(x-x) 2 _______ n
SHARPE RATIO
William Sharpe created a metric for fund performance, which enables the ranking of funds on a risk – adjusted basis. This measure is based on the comparison of “Excess return” per unit of risk, risk being measured by standard deviation. The standard deviation measures what is the average dispersion of the returns around the average value. If the standard deviation is high, the risk inherent in the returns of the mutual fund is high. Excess return is defined as the actual return of the fund less the risk free rate. The return on the 90-day treasury bill of the government is taken as the risk-free rate. This ratio is referred as reward to variability ratio (RVAR). It is expressed as:
Sharpe ratio = (Rp – Rf)/ σP
Where,
Rp is the average return of the fund
Rf is average risk free return
σP is total risk of the fund
TREYNOR RATIO
In the Sharpe ratio, we measure return per unit of standard deviation. Instead if we measured return per unit of beta, we have the Treynor measure of the performance. Treynor measure uses the market risk to rank funds, while Sharpe measure uses total return to rank funds. This ratio is referred as reward to volatility ratio (RVOL)
It is expressed as: Treynor’s ratio = (Rp – Rf)/β
INTERNATIONAL JOURNAL OF RESEARCH IN COMMERCE, IT & MANAGEMENT
Rp is the average return of the fund
Rf is average risk free return
β is total risk of the fund
CORRELATION
The correlation is one of the most common and most useful statistics. A correlation is a single number that describes the degree of relationship between two variables. The correlation coefficient may take on any value between plus and minus one.
-1.00 < r <+1.00
The sign of the correlation coefficient (+, -) defines the direction of the relationship, either positive or negative. A positive correlation coefficient means that as the value of one variable increases, the value of the other variable increases; as one decreases the other decreases. A negative correlation coefficient indicates that as one variable increases, the other decreases, and vice-versa. Taking the absolute value of the correlation coefficient measures the strength of the relationship. It is expressed as,
r = – (∑x∑y)/n
___________________________ √ (∑ -(∑x) ^2)/n) (∑ -(∑y) ^2)/n)
DATA ANALYSIS AND INTERPRETATION
In this chapter the average return, volatility, variability in returns and risk parameters of the commodity are analysed. The analysis is given in the form of tables and charts.
Risk arises out of the fact that returns do not remain constant or unchanged. Every change in return is a situation of risk for the investor. The simplest way to measure risk is to find out, over a period of time, the performance of the commodity in relation to the market indices
Since we know that mutual funds cannot be expected to deliver a pre-specified price, the measures of risk and return make little sense, unless we are able to say something about their adequacy. If the fund made 20% return in one period and 8% in another, we will not be able to say if 20% is too high or not high enough, or if 8% is too low. Therefore, we should be able to define what we can expect from the fund, in terms of risk and return.
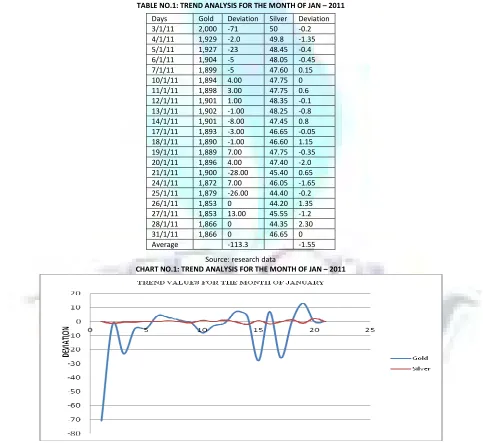
TABLE NO.1: TREND ANALYSIS FOR THE MONTH OF JAN – 2011
Source: research data
CHART NO.1: TREND ANALYSIS FOR THE MONTH OF JAN – 2011
INTERPRETATION
The above table shows that both the value of gold and silver price is in decreasing trend with -113.3 and -1.55. This shows that price of gold & silver increases in the beginning and decreases in the end of the month
INTERNATIONAL JOURNAL OF RESEARCH IN COMMERCE, IT & MANAGEMENT
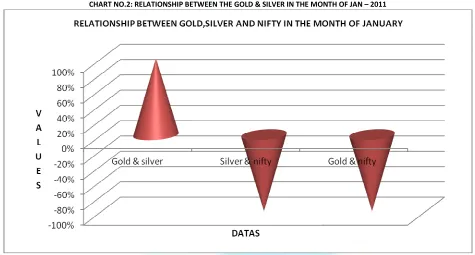
TABLE NO.2: RELATIONSHIP BETWEEN THE GOLD, SILVER AND NIFTY IN THE MONTH OF JAN 2011
Null hypothesis (H0): There is no relationship between gold, silver and nifty in the month of January. Alternative hypothesis (H1): There is relationship between gold, silver and nifty in the month of January.
Data GOLD & SILVER Gold & silver 0.943831 Silver & nifty -0.63036 Gold & nifty -0.56015 Source: research data
CHART NO.2: RELATIONSHIP BETWEEN THE GOLD & SILVER IN THE MONTH OF JAN – 2011
INTERPRETATION
The gold & silver with the value of 0.943831 and shows that there is positive relationship between them because silver is the by-product of gold. The silver & nifty has negative relationship because the value decreases with -0.63036. The gold & nifty also shows negative relationship with -0.56015 where it’s value is less than one.
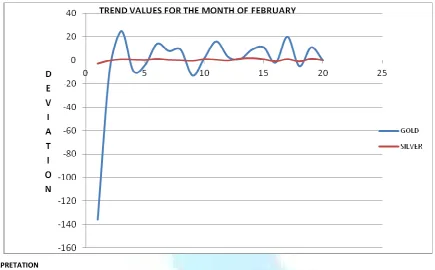
TABLE NO.3: TREND ANALYSIS FOR THE MONTH OF FEBRUARY - 2011
Source: research data
INTERNATIONAL JOURNAL OF RESEARCH IN COMMERCE, IT & MANAGEMENT
CHART NO.3: TREND ANALYSIS FOR THE MONTH OF FEBRUARY – 2011
INTERPRETATION
The above table shows that, the gold is in decreasing trend with the value of -49 and the silver is in increasing trend with the value of 4.7. This shows that gold price decreases continuously in this month.
TABLE .4: RELATIONSHIP BETWEEN THE GOLD, SILVER AND NIFTY IN THE MONTH OF FEBRUARY – 2011
Null hypothesis (H0): There is no relationship between gold, silver and nifty in the month of February. Alternative hypothesis (H1): There is relationship between gold, silver and nifty in the month of February.
Data GOLD & SILVER Gold & silver 0.9101 Silver & Nifty 0.5355 Gold & Nifty 0.2597
Source: research data
CHART NO.4: RELATIONSHIP BETWEEN THE GOLD, SILVER AND NIFTY IN THE MONTH OF FEBRUARY – 2011
INTERPRETATION
INTERNATIONAL JOURNAL OF RESEARCH IN COMMERCE, IT & MANAGEMENT
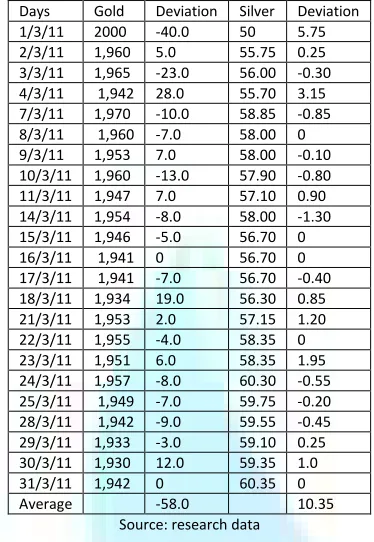
TABLE NO.5: TREND ANALYSIS FOR THE MONTH OF MARCH - 2011
Source: research data
CHART NO.5: TREND ANALYSIS FOR THE MONTH OF MARCH - 2011
INTERPRETATION
The above table shows that the gold prices is in decreasing trend with the values of-58.0. The silver prices increased by 10.35. The gold price decreases when the silver price increases in its value continuously.TABLE .6
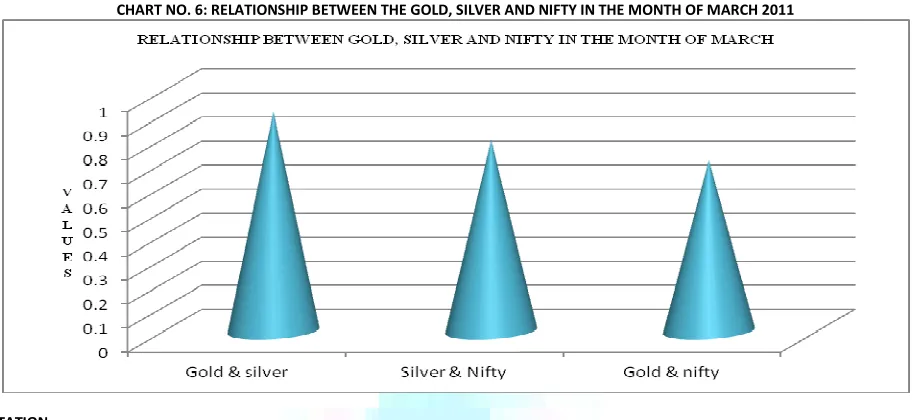
RELATIONSHIP BETWEEN THE GOLD, SILVER AND NIFTY IN THE MONTH OF MARCH 2011
Null hypothesis (H0): There is no relationship between gold, silver and nifty in the month of March. Alternative hypothesis (H1): There is relationship between gold, silver and nifty in the month of March.
Data GOLD & SILVER Gold & silver 0.9131 Silver & Nifty 0.7953 Gold & nifty 0.7106
Source: research data
INTERNATIONAL JOURNAL OF RESEARCH IN COMMERCE, IT & MANAGEMENT
CHART NO. 6: RELATIONSHIP BETWEEN THE GOLD, SILVER AND NIFTY IN THE MONTH OF MARCH 2011
INTERPRETATION
The gold & silver with the value of 0.9131 and shows that there is positive relationship between them because silver is the by-product of gold. The silver & nifty and gold & nifty has strong relationship because with the value of 0.7953 & 0.7106 respectively. This table shows that there is strong relationship between the gold, silver and nifty.
TABLE NO.7: TREND ANALYSIS FOR THE MONTH OF APRIL - 2011
Days Gold Deviation Silver Deviation 1/04/11 2,000 -59.0 50 10.50 4/04/11 1,941 2.0 60.50 1.00 5/04/11 1,943 15.0 61.50 0.90 6/04/11 1,958 0 62.40 -0.15 7/04/11 1,958 11.0 62.25 0.75 8/04/11 1,969 13.0 63.00 2.80 11/04/11 1,982 -7.0 65.80 -1.90 12/04/11 1,975 0 63.90 0.80 13/04/11 1,975 0 64.70 0 14/04/11 1,975 16.0 64.70 2.30 15/04/11 1,991 12.0 67.00 1.20 18/04/11 2,003 21.0 68.20 0.05 19/04/11 2,024 2.0 68.25 1.85 20/04/11 2,026 4.0 70.10 2.0 21/04/11 2,030 9.0 72.10 1.9 22/04/11 2,039 20.0 74.00 3.9 25/04/11 2,059 -18.0 77.90 -3.20 26/04/11 2,041 -1.0 74.70 -1.35 27/04/11 2,040 23.0 73.35 3.20 28/04/11 2,063 0 76.55 0
Average 63.00 26.55
Source: research data
INTERNATIONAL JOURNAL OF RESEARCH IN COMMERCE, IT & MANAGEMENT
INTERPRETATION
The above table shows that, the gold and silver is in increasing trend with the values of 63.00 and 26.55 respectively. This shows that gold and silver price increases continuously in this month.
TABLE .8: RELATIONSHIP BETWEEN THE GOLD, SILVER AND NIFTY IN THE MONTH OF APRIL – 2011
Null hypothesis (H0): There is no relationship between gold, silver and nifty in the month of October. Alternative hypothesis (H1): There is relationship between gold, silver and nifty in the month of October.
Data GOLD & SILVER Gold & silver 0.9106 Silver & Nifty 0.9012 Gold & Nifty 0.8426
Source: research data
CHART NO. 8: RELATIONSHIP BETWEEN THE GOLD, SILVER AND NIFTY IN THE MONTH OF APR - 2011
INTERPRETATION
The gold & silver with the value of 0.9106 and shows that there is positive relationship between them because silver is the by-product of gold. The silver & nifty and gold & nifty has strong relationship because with the value of 0.9012 & 0.8426 respectively. This table shows that there is strong relationship between the gold, silver and nifty.
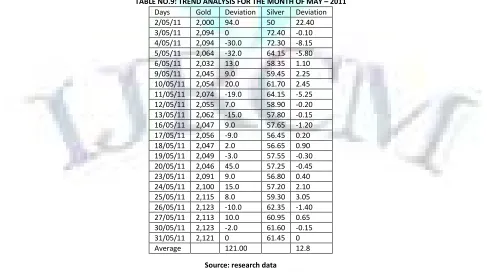
TABLE NO.9: TREND ANALYSIS FOR THE MONTH OF MAY – 2011
Source: research data
INTERNATIONAL JOURNAL OF RESEARCH IN COMMERCE, IT & MANAGEMENT
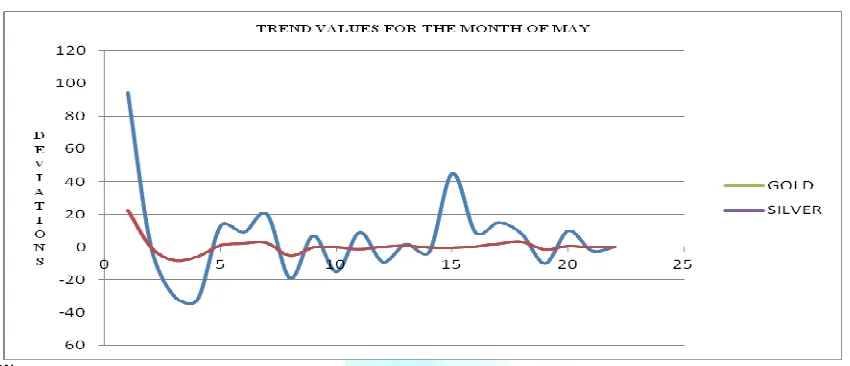
CHART NO.9: TREND ANALYSIS FOR THE MONTH OF MAY -2011
INTREPRETATION
The above table shows that the gold and silver prices are increasing with 121.00 and 12.8 respectively. There is an direct relationship between gold & silver prices.
TABLE 10: RELATIONSHIP BETWEEN THE GOLD, SILVER AND NIFTY IN THE MONTH OF MAY – 2011
Null hypothesis (H0): There is no relationship between gold, silver and nifty in the month of November. Alternative hypothesis (H1): There is relationship between gold, silver and nifty in the month of November.
Data GOLD & SILVER Gold & Silver 0.2075 Silver & Nifty 0.4914 Gold & Nifty -0.4587
Source: research data
CHART NO.10: RELATIONSHIP BETWEEN THE GOLD, SILVER AND NIFTY IN THE MONTH OF MAY 2011
INTERPRETATION
INTERNATIONAL JOURNAL OF RESEARCH IN COMMERCE, IT & MANAGEMENT
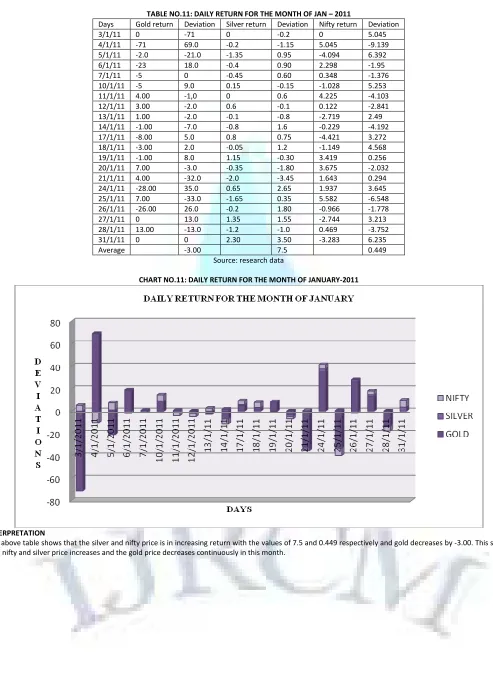
TABLE NO.11: DAILY RETURN FOR THE MONTH OF JAN – 2011
Days Gold return Deviation Silver return Deviation Nifty return Deviation
3/1/11 0 -71 0 -0.2 0 5.045
4/1/11 -71 69.0 -0.2 -1.15 5.045 -9.139 5/1/11 -2.0 -21.0 -1.35 0.95 -4.094 6.392 6/1/11 -23 18.0 -0.4 0.90 2.298 -1.95 7/1/11 -5 0 -0.45 0.60 0.348 -1.376 10/1/11 -5 9.0 0.15 -0.15 -1.028 5.253 11/1/11 4.00 -1,0 0 0.6 4.225 -4.103 12/1/11 3.00 -2.0 0.6 -0.1 0.122 -2.841 13/1/11 1.00 -2.0 -0.1 -0.8 -2.719 2.49 14/1/11 -1.00 -7.0 -0.8 1.6 -0.229 -4.192 17/1/11 -8.00 5.0 0.8 0.75 -4.421 3.272 18/1/11 -3.00 2.0 -0.05 1.2 -1.149 4.568 19/1/11 -1.00 8.0 1.15 -0.30 3.419 0.256 20/1/11 7.00 -3.0 -0.35 -1.80 3.675 -2.032 21/1/11 4.00 -32.0 -2.0 -3.45 1.643 0.294 24/1/11 -28.00 35.0 0.65 2.65 1.937 3.645 25/1/11 7.00 -33.0 -1.65 0.35 5.582 -6.548 26/1/11 -26.00 26.0 -0.2 1.80 -0.966 -1.778 27/1/11 0 13.0 1.35 1.55 -2.744 3.213 28/1/11 13.00 -13.0 -1.2 -1.0 0.469 -3.752 31/1/11 0 0 2.30 3.50 -3.283 6.235
Average -3.00 7.5 0.449
Source: research data
CHART NO.11: DAILY RETURN FOR THE MONTH OF JANUARY-2011
INTERPRETATION
INTERNATIONAL JOURNAL OF RESEARCH IN COMMERCE, IT & MANAGEMENT
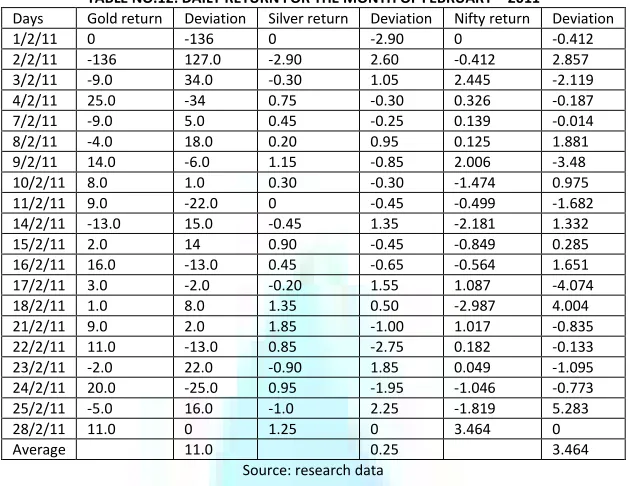
TABLE NO.12: DAILY RETURN FOR THE MONTH OF FEBRUARY – 2011
Days Gold return Deviation Silver return Deviation Nifty return Deviation
1/2/11 0 -136 0 -2.90 0 -0.412
2/2/11 -136 127.0 -2.90 2.60 -0.412 2.857 3/2/11 -9.0 34.0 -0.30 1.05 2.445 -2.119 4/2/11 25.0 -34 0.75 -0.30 0.326 -0.187 7/2/11 -9.0 5.0 0.45 -0.25 0.139 -0.014 8/2/11 -4.0 18.0 0.20 0.95 0.125 1.881 9/2/11 14.0 -6.0 1.15 -0.85 2.006 -3.48 10/2/11 8.0 1.0 0.30 -0.30 -1.474 0.975 11/2/11 9.0 -22.0 0 -0.45 -0.499 -1.682 14/2/11 -13.0 15.0 -0.45 1.35 -2.181 1.332 15/2/11 2.0 14 0.90 -0.45 -0.849 0.285 16/2/11 16.0 -13.0 0.45 -0.65 -0.564 1.651 17/2/11 3.0 -2.0 -0.20 1.55 1.087 -4.074 18/2/11 1.0 8.0 1.35 0.50 -2.987 4.004 21/2/11 9.0 2.0 1.85 -1.00 1.017 -0.835 22/2/11 11.0 -13.0 0.85 -2.75 0.182 -0.133 23/2/11 -2.0 22.0 -0.90 1.85 0.049 -1.095 24/2/11 20.0 -25.0 0.95 -1.95 -1.046 -0.773 25/2/11 -5.0 16.0 -1.0 2.25 -1.819 5.283
28/2/11 11.0 0 1.25 0 3.464 0
Average 11.0 0.25 3.464
Source: research data
CHART NO.12: DAILY RETURN FOR THE MONTH OF FEBRUARY-2011
INTERPRETATION
The above table shows that the nifty, gold and silver prices have positive return with 3.464, 11.0 and 0.25 respectively. This shows that nifty, gold and silver is increasing continuously in this month.
TABLE NO.13: DAILY RETURN FOR THE MONTH OF MARCH - 2011
Days Gold return Deviation Silver return Deviation Nifty return Deviation
1/3/11 0 -40.0 0 5.75 0 3.572
2/3/11 -40.0 45.0 5.75 -5.5 3.572 -4.82 3/3/11 5.0 -28.0 0.25 -0.55 -1.248 -0.898 4/3/11 -23.0 51.0 -0.30 3.45 -2.146 5.132 7/3/11 28.0 -38.0 3.15 -4.0 2.986 -3.289 8/3/11 -10.0 3.0 -0.85 0.85 -0.303 -1.228 9/3/11 -7.0 14.0 0 -0.10 -1.531 -0.967 10/3/11 7.0 -20.0 -0.10 -0.70 -2.498 1.057 11/3/11 -13.0 20.0 -0.80 1.70 -1.441 -2.237 14/3/11 7.0 -15.0 0.90 -2.20 -3.678 3.727 15/3/11 -8.0 3.0 -1.30 1.30 0.049 -1.684
16/3/11 -5.0 5.0 0 0 -1.635 2.38
17/3/11 0 -7.0 0 -0.40 0.745 4.383 18/3/11 -7.0 26.0 -0.40 1.25 5.128 -5.65 21/3/11 19.0 21.0 0.85 0.35 -0.522 -1.754 22/3/11 2.0 -6.0 1.20 -1.20 -2.276 3.108 23/3/11 -4.0 10.0 0 1.95 0.832 -2.05 24/3/11 6.0 -14.0 1.95 -2.50 -1.218 -1.83 25/3/11 -8.0 1.0 -0.55 0.35 -3.048 -0.344 28/3/11 -7.0 -2.0 -0.20 0.10 -3.392 5.24
29/3/11 -9.0 0 -0.45 0 1.848 0
Average 29.0 -0.10 1.848
INTERNATIONAL JOURNAL OF RESEARCH IN COMMERCE, IT & MANAGEMENT
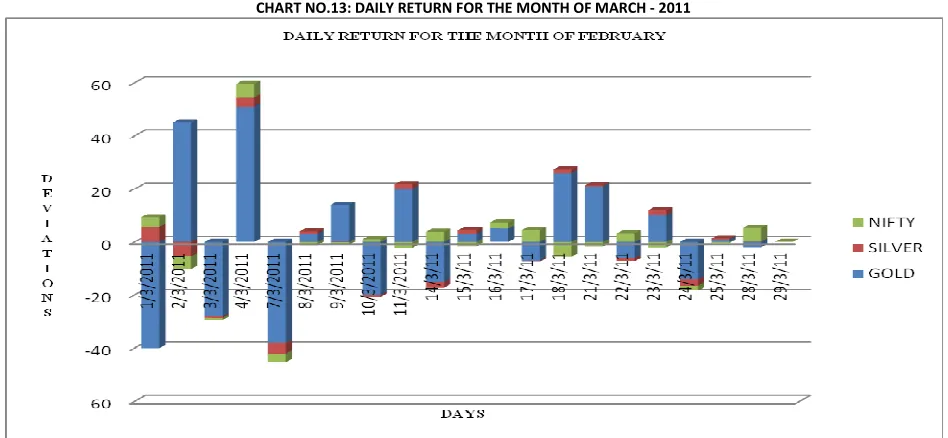
CHART NO.13: DAILY RETURN FOR THE MONTH OF MARCH - 2011
INTERPRETATION
The above table shows that the nifty and gold prices have a favorable return with 1.848 and 29.0 but the silver price shows the unfavorable return with -0.10. The silver prices are negative when it is compared to the gold and nifty.
TABLE NO.14: DAILY RETURN FOR THE MONTH OF APRIL - 2011
Days Gold return Deviation Silver return Deviation Nifty return Deviation
1/04/11 0 -59.0 0 10.50 0 -3.352
4/04/11 -59.0 61.0 10.50 -9.50 -3.352 -2.303 5/04/11 2.0 13.0 1.00 -0.10 -5.655 5.773 6/04/11 15.0 -15.0 0.90 -1.05 0.118 -1.032 7/04/11 0 11.0 -0.15 0.90 -0.914 -7.304 8/04/11 11.0 2.0 0.75 2.05 -8.218 14.643 11/04/11 13.0 -18.0 2.80 -4.70 6.425 -5.624 12/04/11 -7.0 7.0 -1.90 2.70 0.801 -5.924 13/04/11 0 0 0.80 -0.80 -5.123 3.054 14/04/11 0 16.0 0 2.30 -2.069 -3.894 15/04/11 16.0 -4.0 2.30 -1.10 -5.963 7.539 18/04/11 12.0 9.0 1.20 -1.15 1.576 2.013 19/04/11 21.0 -19 0.05 1.80 3.589 -8.836 20/04/11 2.0 2.0 1.85 0.15 -5.247 1.267 21/04/11 4.0 5.0 2.0 -0.10 -3.980 -8.188 22/04/11 9.0 11.0 1.9 2.0 -12.168 9.816 25/04/11 20.0 -38.0 3.9 -5.1 -2.352 8.682 26/04/11 -18.0 17.0 -3.20 1.85 6.330 -5.844 27/04/11 -1.0 24.0 -1.35 4.55 0.486 6.505
28/04/11 23.0 0 3.20 0 6.991 0
Average 25.0 4.03 6.991
Source: research data
INTERNATIONAL JOURNAL OF RESEARCH IN COMMERCE, IT & MANAGEMENT
INTERPRETATION
The above table shows that the gold, silver and nifty have a favorable return with 6.991, 25.0 and 4.03.So Gold, Silver and Nifty has a positive return.
TABLE NO.15: DAILY RETURN FOR THE MONTH OF MAY 2011
Days Gold return Deviation Silver return Deviation Nifty return Deviation
2/05/11 0 94 0 22.40 0 3.227
3/05/11 94.0 -94.0 22.40 -22.50 3.227 -7.91 4/05/11 0 -30.0 -0.10 -8.05 -4.683 1.247 5/05/11 -30.0 -62.0 -8.15 2.35 -3.436 6.235 6/05/11 -32.0 45.0 -5.80 6.90 2.799 3.096 9/05/11 13.0 -4.0 1.10 1.15 5.895 -12.553 10/05/11 9.0 11.0 2.25 0.20 -6.658 3.589 11/05/11 20.0 -39 2.45 -7.70 -3.069 1.732 12/05/11 -19.0 26.0 -5.25 5.05 -1.337 0.953 13/05/11 7.0 -22.0 -0.20 0.05 -0.384 -3.773 16/05/11 -15.0 24.0 -0.15 1.05 -4.157 2.363 17/05/11 9.0 -18.0 -1.20 1.40 -1.794 -1.312 18/05/11 -9.0 11.0 0.20 0.70 -3.106 8.601 19/05/11 2.0 -5.0 0.90 -1.20 5.495 -4.946 20/05/11 -3.0 48.0 -0.30 -1.95 0.549 -2.552 23/05/11 45.0 -36.0 -0.45 0.85 -2.003 5.705 24/05/11 9.0 6.0 0.40 1.70 3.702 -3.599
25/05/11 15.0 0 2.10 0 0.103 0
Average -45.0 2.40 0.103
Source: research data
CHART NO.15: DAILY RETURN FOR THE MONTH OF MAY 2011
INTERPRETATION
The above table shows that the nifty and silver have a favorable return with 0.103 and 2.40. But the gold price shows the unfavorable return with -45.0. The gold price is negative when it is compared to the nifty and Silver.
TABLE NO.16: RISK FOR GOLD, SILVER AND NIFTY
Months Risk
Gold Silver Nifty January 1.376 1.924 2.862 February 1.650 3.495 1.557 March 2.493 5.483 2.334 April 3.150 4.074 5.025 May 2.283 3.145 3.568
SOURCE: RESEARCH DATA INTERPRETATION
The standard deviation of Silver is found to be highest in the month of March and Nifty in the month of April. The highest standard deviation (Risk) is found to be 5.483.
INTERNATIONAL JOURNAL OF RESEARCH IN COMMERCE, IT & MANAGEMENT
CHART NO. 16: RISK FOR GOLD, SILVER AND NIFTY
TABLE NO.17: SHARPE RATIO FOR GOLD, SILVER AND NIFTY
Months Sharpe ratio RANKING
Gold Silver Nifty Gold Silver Nifty January -4.419 -3.118 -1.921 1 1 3 February -3.368 -2.048 -3.886 2 2 1 March -2.228 -1.111 -2.770 5 5 2 April -2.181 -1.794 -1.479 6 4 5 May -2.366 -1.881 -1.819 4 3 4
Source: research data
INTERPRETATION
The evaluation based on Sharpe ratio shows that the risk-adjusted performance of gold, silver and nifty is very low with high risk. Gold ranks first in the month of January. Next to that silver, nifty has a good return in the month of February. The performance of other months has normal risk and returns.
INTERNATIONAL JOURNAL OF RESEARCH IN COMMERCE, IT & MANAGEMENT
TABLE NO.18: BETA FOR GOLD, SILVER AND NIFTY
Months Beta
Gold Silver Nifty January -0.022 -0.00059 0.291 February 0.022 0.002 0.281 March -0.038 -1.69 0.0010 April 0.043 0.0007 0.328 May -0.027 -0.027 0.262
Source: research data
INTERPRETATION
The evaluation based on Beta shows that the risk-adjusted performance of gold, silver and nifty is moderate high with low risk. Nifty shows good return in the month of April. The performance of gold and silver other months has normal risk and returns.
CHART NO.18: BETA FOR GOLD, SILVER AND NIFTY
TABLE NO.19: TREYNOR RATIO FOR GOLD, SILVER AND NIFTY
Months Treynor ratio RANKING
Gold Silver Nifty Gold Silver Nifty January 276.08 10172.88 -18.83 1 1 1 February -285.91 -3536.98 -21.54 3 4 3 March 145.77 3596 -5601.7 5 2 5 April -159.89 -9604.34 -22.67 4 5 4 May 202.98 222.32 -21.02 2 3 2
Source: research data
INTERPRETATION
The evaluation based on the Treynor’s ratio shows a negative performance in all the months in gold, silver and nifty. From this gold and nifty show lowest risk level and has the highest returns. The lowest performance is seen in the silver. It has the highest risk rate.
CHART NO.19: TREYNOR RATIO FOR GOLD, SILVER AND NIFTY
FINDINGS
• The gold & silver with the value of 0.943831 and shows that there is positive relationship between them because silver is the by-product of gold. • In the month of January, February, April and May there is strong relationship between gold, silver and nifty.
• There is a negative relationship in the month of January.
INTERNATIONAL JOURNAL OF RESEARCH IN COMMERCE, IT & MANAGEMENT
• The standard deviation of the Silver is found to be highest in the month of March and Nifty in April. • The highest standard deviation (Risk) is found to be 5.483.
• The evaluation based on Sharpe ratio shows that the risk-adjusted performance of gold, silver and nifty is very low with high risk. Gold ranked first in the month of January.
• Silver and nifty has good return in the month of February has a good return. The performance of other months has normal risk and returns.
• The evaluation based on the Treynor’s ratio shows a negative performance in all the months in gold, silver and nifty. From this gold and nifty show lowest risk level and has the highest returns.
• The highest deviation in returns in the month of January in gold, silver and nifty is 6.117, 9.841 and -5.643.
SUGGESTIONS
For the successful investment, the investor should focus on the following
• Investor understands the basic elements of commodities market investing and their fund affect on the potential value of the investments over the years. • Investors fix their objectives; should fix their risk level and have to assess the risk associated with the different funds; this would help to select the fund
that meets their needs.
• Investors know about the past performance of the various funds. • Investors consider the tax implications.
• As the stock market have direct impact on Mutual Funds, knowledge of share market activities and share price movement is important to effectively manage the investments.
• In the field of management, dynamism and well-timed decisions are a must. A delayed decision even for a day reduces the returns for the fund and may increase the cost
• The investors carefully manage and plan the amount which they will be investing in the market.
CONCLUSION
From the investor’s point of view, it is always important to look at the commodities, which are ranked, as out-performers are able to consistently do so. Every time a ranking is published, it is found that fund appears in varying orders, with no clear consistent winning or losing prices. The past performance is used as an important tool. Investors have to look for consistency, though it is known that new investments flow into top performing funds, based on performance ranking. The quality of the fund managers also plays a vital part in deciding the performance of the commodity.
The stock market staged a smart rally on the strength of attractive valuations, strong economic growth, encouraging corporate results and foreign funds. An investor can succeed in his investments only when he is able to select the right fund. The investor should keenly watch the situations like market price, economy, company progress, returns, and the risk involved in a fund before taking particular decision. There will be direct impact between commodities and stock market relating to economic crisis all over the world.
BIBLIOGRAPHY
• Bhalla V.K”Investment Management”, S.Chand &Cmpany Ltd, New Delhi
• Donald E.fisher &RonaldJ.Jordan 1995 Sixth Edition,” Security analysis and Portfolio management”, Prentice-Hall of India, New Delhi,. • Jack Clark Francis ,1996,Fifth Edition “ investment analysis and management”, MCGraw- Hil, inc., New York,
INTERNATIONAL JOURNAL OF RESEARCH IN COMMERCE, IT & MANAGEMENT
REQUEST FOR FEEDBACK
Dear Readers
At the very outset, International Journal of Research in Commerce, IT and Management (IJRCM)
acknowledges & appreciates your efforts in showing interest in our present issue under your kind perusal.
I would like to request you to supply your critical comments and suggestions about the material published
in this issue as well as on the journal as a whole, on our E-mails i.e.
or
for further improvements in the interest of research.
If you have any queries please feel free to contact us on our E-mail
.
I am sure that your feedback and deliberations would make future issues better – a result of our joint
effort.
Looking forward an appropriate consideration.
With sincere regards
Thanking you profoundly
Academically yours
Sd/-