RESEARCH NOTE
AN INTEGRATED AHP-VIKOR METHODOLOGY FOR
PLANT LOCATION SELECTION
R. Tavakkoli-Moghaddam * andS.M. Mousavi
Department of Industrial Engineering and Center of Excellence for Intelligence Based Experimental Mechanics, College of Engineering, University of Tehran, P.O. Box
11155-4563, Tehran, Iran
[email protected] - [email protected]
M. Heydar
School of Industrial Engineering, Islamic Azad University - South Tehran Branch, P.O. Box 11365/4435, Tehran, Iran
*Corresponding Author
(Received: May 24, 2009 – Accepted: April 23, 2011)
Abstract Plant location selection has invariably a significant impact on the performance of many companies or manufacturing systems. In this paper, a new integrated methodology is structured to solve this selection problem. Two well-known decision making methods, namely analytic hierarchical process (AHP) and VlseKriterijumska Optimizacija I Kompromisno Resenje (VIKOR), are combined in order to make the best use of information available, either implicitly or explicitly. In addition, the Delphi method is utilized to select the most influential criteria by a few experts. The aim of using the AHP is to give the weights of the selected criteria. Finally, the VIKOR method is taken into account to rank potential alternatives. Finally, an application example demonstrates the suitability of the proposed methodology.
Keywords Decision Making, Plant Location Selection, AHP, VIKOR
ﻩﺪﻴﮑﭼ
ﺎﻬﺘﮐﺮﺷﺩﺮﮑﻠﻤﻋﻱﻭﺭﺮﺑﻱﺮﻴﮕﻤﺸﭼﻭﻢﻬﻣﺮﺛﺍﮏﺷﻲﺑﺕﻼﻴﻬﺴﺗﻥﺎﮑﻣﺏﺎﺨﺘﻧﺍ ﻳ
ﻱﺪﻴﻟﻮﺗﻱﺎﻬﻤﺘﺴﻴﺳﺎ
ﺩﺭﺍﺩ
.
ﻱﮊﻮﻟﻭﺪﺘﻣﮏﻳﻪﻟﺎﻘﻣﻦﻳﺍﺭﺩ ﻳ
ﺖﺳﺍﻩﺪﺷﻲﺣﺍﺮﻃ،ﺏﺎﺨﺘﻧﺍﻪﻠﺌﺴﻣﻦﻳﺍﻞﺣﻱﺍﺮﺑﺪﻳﺪﺟﻪﭼﺭﺎﭙﮑ
.
ﺭﻮﻬﺸﻣﺵﻭﺭﻭﺩ
ﻱﺎﻬﺷﻭﺭﻲﻨﻌﻳ،ﻱﺮﻴﮔﻢﻴﻤﺼﺗ AHP
ﻭ VIKOR ﻋﻼﻃﺍﺯﺍﺮﺘﻬﺑﻩﺩﺎﻔﺘﺳﺍﺭﻮﻈﻨﻣﻪﺑ،
ﺮﮕﻳﺪـﮑﻳﺎـﺑﺱﺮﺘـﺳﺩﺭﺩﺕﺎ
ﻩﺪﺷﺐﻴﮐﺮﺗ ﺪﻧ
.
ﺵﻭﺭﺯﺍﻱﺮﻴﮔﻢﻴﻤﺼﺗﻱﺎﻫﺭﺎﻴﻌﻣﻦﻳﺮﺗﺮﺛﻮﻣﻭﻦﻳﺮﺘﻬﺑﺏﺎﺨﺘﻧﺍﺭﻮﻈﻨﻣﻪﺑ،ﻦﻴﻨﭼﻢﻫ Delphi
ﻩﺩﺎﻔﺘﺳﺍ
ﺖﺳﺍﻩﺪﺷ
.
ﺵﻭﺭﺯﺍﻩﺩﺎﻔﺘﺳﺍﻲﻠﺻﺍﻑﺪﻫ AHP
ﻲـﻣﻲﺑﺎـﺨﺘﻧﺍﻱﺎﻫﺭﺎﻴﻌﻣﻥﺍﺯﻭﺍﻦﻴﻴﻌﺗ، ﺪـﺷﺎﺑ
. ﺵﻭﺭﺯﺍ،ﻪـﻣﺍﺩﺍﺭﺩ
VIKOR ﻪﻨﻳﺰﮔﺏﺎﺨﺘﻧﺍﻭﻪﺒﺗﺭﻦﻴﻴﻌﺗﻱﺍﺮﺑ
ﺳﺍﺎﻫ ﺖﺳﺍﻩﺪﺷﻩﺩﺎﻔﺘ
.
ﺩﺮﺑﺭﺎـﮐﻝﺎـﺜﻣﮏـﻳﻪﺋﺍﺭﺍﺎﺑﻪﻟﺎﻘﻣﻱﺎﻬﺘﻧﺍﺭﺩ ﻱ
،
ﺖﺳﺍﻩﺪﺷﺢﻳﺮﺸﺗﻱﺩﺎﻬﻨﺸﻴﭘﻱﮊﻮﻟﻭﺪﺘﻣﻥﺩﻮﺑﺪﻨﻣﺩﻮﺳ
..
1. INTRODUCTION
The plant location problem plays a very important role in minimizing the cost and maximizing the use of resources for many companies [1]. Location problems involve determining the location of one or more new facilities in one or more of several potential sites [2]. Many potential criteria, such as
criteria and the weights of the criteria are usually expressed in linguistic terms [3].
Previous studies have applied MCDM approaches to generate and solve facility location selection problems. Liang and Wang [4] developed an algorithm for facility site selection based on hierarchical structure analysis, where the ratings of various alternative locations under various subjective criteria and the weights of all criteria are assessed in linguistic terms represented by fuzzy numbers.
Brown and Gibson [7] and Buffa and Sarin [8] proposed a quantified model that classified the objective and subjective factors important to the specific location problem being addressed as: critical, objective, and subjective. Bhattacharya et al [9] proposed a holistic MCDM model for the facility location selection. They eliminated critical factors from their model and proposed a holistic method for the facility location selection based on Brown and Gibson [7] and Buffa and Sarin [8]. Tzeng and Chen [10] proposed a location model based on a fuzzy multi-objective approach. The model helped in determining the optimal number and sites of fire stations at an international airport, and also assisted the relevant authorities in drawing up optimal locations for fire stations. Kahraman et al [11] used four fuzzy multi-attribute group decision-making approaches in evaluating facility locations. These approaches were extended to select the best facility location alternative by taking into account quantitative and qualitative criteria. Heydar et al [3] solved temporary storage location problems using a multi-objective decision making (MODM) model. In their study, there were two main steps:
1) Locations were regarded as alternatives which their weights were calculated by using fuzzy TOPSIS with considering flexible attributes, and
2) Three objectives were defined. Chen [12] developed a multi-attributes decision making (MADM) approach for resolving the DC location selection problem under fuzzy environments based on a stepwise ranking procedure.
Some researchers used the analytic hierarchical process (AHP) as a stand-alone approach to make facility location decisions [13,14]. AHP enables the decision maker (DM) to structure a complex problem in the form of a simple hierarchy and to evaluate a large number of quantitative and
qualitative factors in a systematic manner with conflicting multiple criteria [15,16].
Kuo et al [17] proposed a decision support system (DSS) by integrating the fuzzy set theory and AHP in selecting a site for a convenience store (CVS). Also, Kuo et al [18] developed a DSS for locating the CVSs by integrating the fuzzy AHP and an artificial neural network (ANN). Partovi [19] presented a strategic solution to a facility location problem by using the QFD, AHP and ANP, simultaneously. He considered internal and external criteria. Kaboli et al [16] proposed a mathematical model for the site selection for a facility location problem. They used an AHP approach for the organizations seeking a site for new facility or a relocation of existing facilities.
Tavakkoli-Moghaddam and Hassanzadeh-Amin [20] developed a DSS for location selection on the basis of the HOQ concept adopting an analysis based on fuzzy logic. It has been assumed that there are some locations (alternatives) and they wanted to select the best one according to significant criteria. Razmi et al [21] designed a TOPSIS model to solve the complexity of facility location selection in Tehran, Iran. The method preferred the alternatives by quantifying criteria and it applied the AHP method for determining the importance coefficient of the weight of any effective factor. The most important and preference points in a region were chosen and then were evaluated by the use of geographic information system. Chou et al [22] presented a fuzzy simple additive weighting system (SAWS), for solving plant location selection problems by using objective/subjective attributes under group decision making conditions.
25, and 26].
In decision making problems, the DM has to choose the best alternative that satisfies all criteria. Generally, it is hard to achieve this goal, so a good compromise solution needs to be found. This problem maybe become complex when multiple DMs are involved [27, 28]. On the other hand, over the years many researchers focused on using different MCDM methods, but to this date, to the best of our knowledge, the VIKOR (VlseKriterijumska Optimizacija I Kompromisno Resenje that means Multi-Criteria Optimization and Compromise Solution) method has not been used for plant location problems.
To solve the above-mentioned problems in MCDM, a new integrated methodology based on AHP-VIKOR is proposed. In this methodology, two well-known decision making methods, namely AHP and VIKOR, are hybridized in order to make the best use of information available, either implicitly or explicitly. In addition, the Delphi method is applied to select the most influential criteria via expertise of experts. In this respect, AHP is utilized to give the weights of selected criteria. The main reason of applying the AHP in decision making process is that, considering the contingency of the outcome, the result of the AHP, criteria weights in this paper, would be more robust than any other method. This is mainly because the hierarchy structure of AHP makes the use of detailed information inherent in the nature of the problem. Moreover, in the literature the AHP is one of the most widely used MADM methods. As a matter of fact its hierarchical structure which is best suited with the structure of an MADM problem makes it more appealing for a decision making problem [29,30]. Finally, the VIKOR method is taken into account to rank alternative.
The VIKOR method provides the maximum group utility for the majority and minimum of an individual regret for the opponent. It introduces the multi-criteria ranking index based on the particular measure of closeness to the ideal solution. Furthermore, this method does not depend on the evaluation unit of a criterion function [24-26].
This paper is arranged into five sections. In Section 2, the proposed two-step AHP-VIKOR methodology is concisely provided. AHP and VIKOR methods and calculations are given to
clarify the new integrated methodology in detail. An application example of plant location selection in the MCDM environment is used to illustrate the feasibility of the proposed methodology in Section 3. In Section 4, a study on a sensitivity analysis is conducted. Finally, conclusions are offered in Section 5.
2. PROPOSED METHODOLOGY
During the last four decades many researchers devoted their times and efforts to best design methodologies for decision making purposes under different and, in most cases, conflict criteria. These proposed methodologies are designed in such a way that makes the use of MCDM methods as efficient as possible. In this paper, two well-known methods, namely AHP and VIKOR, are combined in order to rank alternatives with respect to criteria. Besides, the Delphi method is also used as a pre-step. The reason for using the Delphi method is to select the criteria among set of possible criteria defining all aspects of the under-consideration problem, and to provide alternative values with respect to each criterion in order to form the decision making matrix.
The Delphi method accumulates and analyzes the results of anonymous experts that communicate in written, discussion and feedback formats on a particular topic. Anonymous experts share knowledge skills, expertise and opinions until a mutual consensus is achieved [31,32]. This method consists of five procedures:
1) Select the anonymous experts 2) Conduct the first round of a survey
3) Conduct the second round of questionnaire survey
4) Conduct the third round of questionnaire survey
5) Integrate experts’ opinions to reach a consensus
any decision problem is the relative importance of each criterion. To resolve this issue, the well-known AHP is incorporated in the decision process.
To rank the alternatives, one of the most efficient methods (i.e., VIKOR method) that received enormous attention since its first introduction in 1998, is used [24, 25]. The VIKOR determines the compromise ranking-list, the compromise solution and the weight stability intervals. This ranking index is based on the closeness to the ideal solution [24]. The compromise ranking of alternatives is developed from the Lp-metric used in the compromise programming that was first introduced by Zeleny [35]. Assuming alternatives are denoted by a1,
a2,…, an, and the rating of alternative, say j, with respect to criteria i is denoted by fij, the VIKOR form of Lp-metric is as follows:
(
) (
)
[
]
. , , 2 , 1 ; 1
, /
1
1
* *
,
J j
p
f f f f w L
p n
i
p
i i ij i i j
p
K
= ∞ ≤
≤
− −
=
∑
=
−
In the VIKOR method, Lj,i and L∞,j are utilized to formulate ranking measures. In this method, as will be discussed in more detail later in this paper,
Lj,i is called Sj and L∞,j is known as Rj.
The compromise solution FC is a feasible solution that is the closest to the ideal solution F*. The compromise in this method means an agreement established by mutual concessions, represented by∆f = f*− fc. This point or solution belongs to the set of non-inferior solutions as illustrated in Figure 1.
Figure 1. Ideal and compromise solutions
The VIKOR method is a helpful MCDM
method, especially in those cases where the DM is not able to express his/her preference at the initial stage of the process [26]. The obtained compromise solution can be accepted because it provides the maximum group utility of the majority and the minimum of the individual regret of the opponent.
In this paper, we apply the VIKOR method for a plant selection problem because of the following reasons and advantages [36]:
1) Compromising is acceptable for conflict resolution.
2) There exists a linear relationship between each criterion function and a DM’s utility. 3) The criteria are conflicting and
non-commensurable (different units).
4) The alternatives are evaluated according to all established criteria (performance matrix). 5) A stability analysis determines the weight
stability intervals.
Hereafter, the steps of the proposed methodology will be explained in detail.
Step 1. Construct a committee of experts with
Kmembers.
Step 2. Ask each expert to suggest some criteria
upon which the decision model will be constructed and best alternative will be ranked accordingly.
Step 3. The Delphi method [27] is used until a
decision concerning agreed-upon criteria is reached.
Step 4. Construct a hierarchical model for the
selected criteria, and using the AHP method aggregated weights of criteria will be calculated. As in business, management and science, the knowledge, experience and expertise of some experts are often preferred among others in a group of experts. This can be expressed by assigning unequal weights λ to the experts, which lead us to the weighted AHP method.
Step 4.1. Use pair-wise comparison to get the degree of importance of each criterion.
∑
=
∏
kk k
k ijk
ij w
w λ λ
1
(1)
Step 4.3. Using a heuristic method, arithmetic average, each criterion weight is calculated. In so doing, first, sum the arrays in each column. Then, each array in each column is divided by its respective column sum to get a normalized matrix. Last, average each row to get all criteria weights.
Step 4.4. Check the consistency index. The consistency index of comparison matrix is (λmax–
n)/(n-1), whereλmax denotes the largest Eigen value of the comparison matrix, say matrix X. In the AHP, a comparison matrix is reciprocal, each array in this matrix represents the importance alternative
i over alternative j, and in our case alternatives are replaced by criteria.
Step 5. At this stage, the aggregated rating of
alternative under each criterion is determined by a group of DMs. This can be done similar to the approach used in the Delphi method. The only difference between them is the number of experts involved in the process. Like AHP, here it is assumed that each expert has its own weights. Therefore, the weighted Delphi method is used and summarized as follows [27]:
Step 5.1. K experts are asked to provide their evaluation and rating. In this method, each of the experts has a weight λk according to their degree of experience.
Step 5.2. First, the weighted average fij of all fijk is computed by
(
)
(
)
k ijk k ij
ij
f f
f
λ λ
λ λ
+ +
× + + × =
K K
1 1 1
(2)
Then for each expert, the deviation between the weighted average fij and fijk is computed.
Step 5.3. To reach a decision about group decision matrix a threshold value is defined [27]. If the distance between the weighted average and expert’s data is greater than this value, then the relevant expert is notified and the process will start and repeat from Step 5 until there is no distance value exceeding the threshold value. This process is repeated until two successive averages are
reasonably close to each other. It is assumed that the distance being less than or equal to 0.2 corresponds to two reasonably close estimates [37].
Step 6. Using the compromise ranking
(VIKOR), rank alternative from which the most appropriate one can easily be selected. The steps of the VIKOR method are as follows:
Step 6.1. Determine the best and worst values, also known as positive ideal and negative ideal solutions:
ij
i
j f
f*=max
(3) and
ij
i
j f
f− =min
Step 6.2. Calculate the values by
(
−) (
− −)
j j ij j
j f f f f
w * *
,Si and Ri:
(
) (
)
∑
=
− − −
= k j
j j ij j j
i w f f f f
S 1
* *
(4)
(
) (
)
[
− − −]
= j j ij j j
j
i w f f f f
R * *
max (5)
where, Si is Ai with respect to all criteria calculated by the sum of the distance for best value, and Ri is Ai with respect to the jth criterion, calculated by the maximum distance from the worst value. As implied by Eqs. (4) and (5), the linear normalization is used in VIKOR method.
Step 6.3. Calculate the following values:
i
i S
S*=min
i
i S
S− =max
i
i R
R*=min
i
i R
R− =max
(
−) (
−)
+= * − *
S S S S v Qi i
(
)
(
*) (
*)
1−v Ri −R R −R
− (6)
group utility, and R* is the minimum value of Ri, which is the minimum individual regret of the opponent. Thus, index Qi is obtained and based on the consideration of both the group utility and the individual regret of the opponent.
Step 6.4. Propose as the compromise solution the alternative
( )
A′ which is the best ranked by the measure Q if the two conditions, acceptance advantage and acceptance stability in decision making, are satisfied. The acceptance advantage holds whenever:( ) ( )
A Q A DQQ ′′ − ′ ≥ (7)
1 1
− =
m
DQ (DQ=0.25 if m≤4
)
(8) Where A′′ is in the second position in the ranking list determined by Eq. (8). Condition 2 is called acceptance stability in decision making. Under this condition, Q( )
A′ should be best ranked by S( )
A′or/and R
( )
A′ . This compromise solution is stable within the decision making process, which can be the strategy of maximum group utility or by consensus or by veto [36]. If one of the conditions is not satisfied, the set of compromise solution is proposed. If Condition 1 is not accepted( )m A A
A′, ′′,K, is the set of compromise solution. In this set A( )m is determined by the relation
( )
A Q( )
A DQQ m − ′ < for the maximum of M (the position of these alternatives are in closeness). If Condition 2 is not accepted, the stability in decision making is deficient. The compromise solutions is formed by A′andA′′.
Step 7.Select the best alternative. Choose
( )
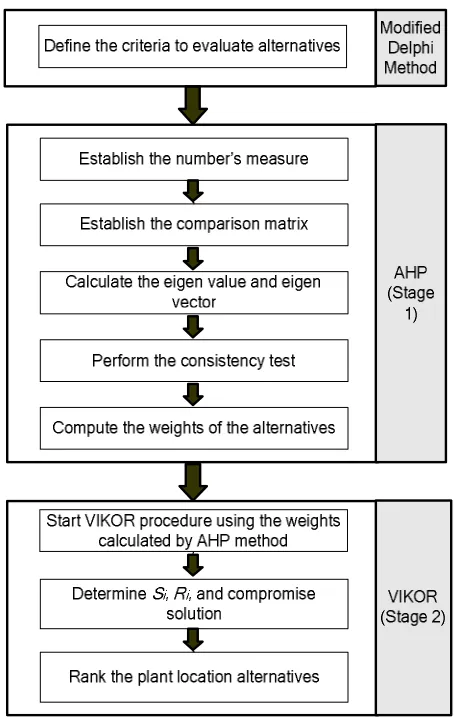
AQ ′ as the best solution with the minimum of Qi. Figure 2 illustrates the process of the proposed integrated methodology for plant location selection.
3. AN APPLICATION EXAMPLE
In this section, a home appliance manufacturer is regarded as an application example to demonstrate the efficiency of the proposed methodology.
The manufacturer wants to select a location to build a new plant. This manufacturer is concerned with the problem of selecting the best location in a specified region for a service facility such as a shopping center, fire station, factory, airport, warehouse, etc
.
After preliminary screening, three locations A1, A2 and A3 are chosen for further evaluation near Tehran. Firstly, a committee of fifteen experts was formed to conduct the assessment and to select the most appropriate criteria by the Delphi method. This is based on the pre-step or preliminary examination of the problem.Figure 2. Proposed integrated methodology
The result of this stage is five criteria including three benefit criteria and two cost criteria as follows:
3) Availability of material (C3) 4) Investment cost (C4)
5) Risks imposed on the site (C5)
It is worth noting that for decision making purposes, the number of DMs or Experts (Es) involved is limited to three. In other words, for the proposed integrated methodology a committee of three DMs is formed to provide data for the problem. As knowledge of each expert has a different value, each expert is assigned a weight as in the vector (4, 3, 2), where the weights of the first, second, and third DM are 4, 3 and 2.
The proposed methodology is then applied to solve this problem. The computational procedure is summarized as follows:
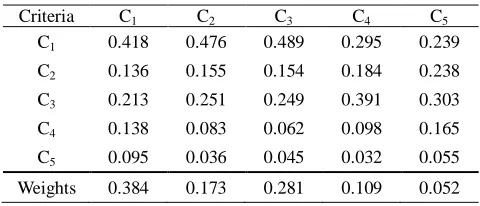
Before taking any action, it is sufficient to say that in order to rate an alternative with respect to criteria, a 9-point-scale system, as in AHP, is applied [39] (see Table 1). Based on Step 4 and according to the AHP, a hierarchy is constructed and using pair-wise comparison criteria weights are calculated. First, pair-wise comparison matrixes for each DM should be filled in (see Table 2). Then, these matrices using Eq. (1) are integrated to form a group matrix. The integrated matrix is normalized using the arithmetic average approach. Finally, as the last step in AHP, the weight of each criterion is calculated and tabulated (see Table 3).
The following calculation outlines how the entries in Table 3 can be obtained from Table 2. Consider two criteria C1 and C2. The experts’ comparison for C2 over C1 is (5, 7, 0.3). So, by using Eq. (1) we havew12 =0.476.
Using the same method for all criteria the comparison vector for criterion C2, as it can be seen form column two of Table 3, is (0.476, 0.155, 0.251, 0.083, 0.036).
These integrated pair-wise comparison value should be normalized. Then the arithmetic average approach is applied. Therefore, for C2 the normalized weight is w2 =0.173
.
Following the same procedure, the criteria weights are as vector (0.384, 0.173, 0.281, 0.109, 0.052).
After obtaining the criteria weights, now it is time to ask each expert for rating alternatives with respect to each criterion. This is done using a
9-point scale system in Table 2. The gathered data are shown in Table 4. According to this table, the ratings of each DM for alternative A1 are 7, 4 and 4, respectively.
Using Eq. (2), the integrated decision matrix will be as what appears in Table 5. In fact, the resulting table is reached after several interviews, since the deviation between each array and average exceed threshold set equal to 0.2 at the beginning of this study.
TABLE 1. Judgment scores in AHP
Score Explanation
Judgment
1 Two attributes contribute equally to the upper-level criteria
Equally
2 Experience and judgment slightly favor one attribute over another
Moderately
3
4 Experience and judgment strongly favor one attribute over another
Strongly
5 6 An attribute is strongly favored and its dominance is demonstrated in practice Very
strongly 7
8 The evidence favoring one attribute over another is of the highest possible order of affirmation
Extremely
9
The following shows the sample calculation for C2, 22
. 5 1 =
A , A2 =7 and A3=4.56.
Using the same procedure, the data in Table 5, final decision matrix, upon which the VIKOR method will be applied, can be filled in.
For ranking alternatives, according to Step 6 of the proposed methodology, the calculated data along with the final values of Qi is given in Table 6. Based on Eqs. (4), (5) and (6), the following calculations are considered forSi,Ri,Qi;i=1,2 ,3.
338 . 0 89 . 1 11 . 7
11 . 7 11 . 7
052 . 0 44 . 1 78 . 2
78 . 2 78 . 2 109 . 0 33 . 3 22 . 6
78 . 5 22 . 6
281 . 0 56 . 4 7
22 . 5 7 173 . 0 44 . 3 22 . 6
5 22 . 6 384 . 0
1
=
− −
+
− − +
− −
+
− − +
− − =
799 . 0 89 . 1 11 . 7 89 . 1 11 . 7 052 . 0 44 . 1 78 . 2 78 . 1 78 . 2 109 . 0 33 . 3 22 . 6 33 . 3 22 . 6 281 . 0 56 . 4 7 7 7 173 . 0 44 . 3 22 . 6 44 . 3 22 . 6 384 . 0 2 = − − + − − + − − + − − + − − = S 316 . 0 89 . 1 11 . 7 67 . 3 11 . 7 052 . 0 44 . 1 78 . 2 44 . 1 78 . 2 109 . 0 33 . 3 22 . 6 22 . 6 22 . 6 281 . 0 56 . 4 7 56 . 4 7 173 . 0 44 . 3 22 . 6 22 . 6 22 . 6 384 . 0 3 = − − + − − + − − + − − + − − = S 169 . 0 } 89 . 1 11 . 7 11 . 7 11 . 7 052 . 0 , 44 . 1 78 . 2 78 . 2 78 . 2 109 . 0 , 33 . 3 22 . 6 78 . 5 22 . 6 281 . 0 , 56 . 4 7 22 . 5 7 173 . 0 , 44 . 3 22 . 6 5 22 . 6 384 . 0 { 1 = − − − − − − − − − − =Max R 384 . 0 } 89 . 1 11 . 7 89 . 1 11 . 7 052 . 0 , 44 . 1 78 . 2 78 . 1 78 . 2 109 . 0 , 33 . 3 22 . 6 33 . 3 22 . 6 281 . 0 , 56 . 4 7 7 7 173 . 0 , 44 . 3 22 . 6 44 . 3 22 . 6 384 . 0 { 2 = − − − − − − − − − − =Max R 173 . 0 } 89 . 1 11 . 7 67 . 3 11 . 7 052 . 0 , 44 . 1 78 . 2 44 . 1 78 . 2 109 . 0 , 33 . 3 22 . 6 22 . 6 22 . 6 281 . 0 , 56 . 4 7 56 . 4 7 173 . 0 , 44 . 3 22 . 6 22 . 6 22 . 6 384 . 0 { 3 = − − − − − − − − − − =Max R 023 . 0 169 . 0 384 . 0 169 . 0 169 . 0 5 . 0 316 . 0 799 . 0 316 . 0 388 . 0 5 . 0 1 = − − + − − = Q 1 169 . 0 384 . 0 169 . 0 384 . 0 5 . 0 316 . 0 799 . 0 316 . 0 799 . 0 5 . 0
2 =
− − + − − = Q 009 . 0 169 . 0 384 . 0 169 . 0 173 . 0 5 . 0 316 . 0 799 . 0 316 . 0 316 . 0 5 . 0
3 =
− − + − − = Q
To obtain the final ranking of alternatives, two conditions in Step 6.5 should be verified so that the final ranking and compromise solution can be obtained. For the illustration purposes, using Eq. (7) we haveQ(A′)−Q(A′′)=0.014 < 0.25. The acceptance advantage (Condition 1) is not satisfied, although the stability in decision making is completely satisfied. Since Condition 1 is not satisfied, there must be a compromise solution consisting of first m alternative for which the inequality Q
( )
Am −Q( )
A′ <DQmust be attained. In this example m=2. In other words, the alternative in the second position (Q1) forms a compromise solution together with the alternative (Q3) in the first position.
TABLE 2. Inter-criteria comparisons matrix
Cri. No.
C1 C2 C3 C4 C5
E 1 E 2 E 3 E 1 E 2 E 3 E 1 E 2 E 3 E 1 E 2 E 3 E 1 E 2 E 3
C1 1 1 1 5 7 0.3 2 3 1 4 1 9 7 4 2
C2 0.2 0.14 3 1 1 1 0.3 3 0.2 0.5 8 3 2 9 7
C3 0.5 0.3 1 3 0.3 5 1 1 1 6 2 5 5 5 8
C4 0.25 1 0.11 2 0.12 0.3 0.16 0.5 0.2 1 1 1 3 4 2
C5 0.14 0.25 0.5 0.5 0.11 0.1 0.2 0.2 0.12 0.3 0.25 0.5 1 1 1
TABLE 3. Normalized integrated matrix
Criteria C1 C2 C3 C4 C5
C1 0.418 0.476 0.489 0.295 0.239
C2 0.136 0.155 0.154 0.184 0.238
C3 0.213 0.251 0.249 0.391 0.303
C4 0.138 0.083 0.062 0.098 0.165
C5 0.095 0.036 0.045 0.032 0.055
TABLE 4. Alternatives evaluation with respect to the criteria
Cri. No.
C1 C2 C3 C4 C5
E 1
E 2
E 3
E 1
E 2
E 3
E 1
E 2
E 3
E 1
E 2
E 3
E 1
E 2
E 3 A1 7 5 1 4 1 8 5 6 7 3 3 2 7 6 9
A2 3 3 5 9 7 3 1 4 7 1 2 3 1 1 5
A3 4 8 8 6 1 7 8 2 9 2 1 1 4 3 4
TABLE 5. Integrated evaluation matrix
Alter. C1 C2 C3 C4 C5
A1 5 5.22 5.78 2.78 7.11
A2 3.44 7 3.33 1.78 1.89
A3 6.22 4.56 6.22 1.44 3.67
TABLE 6. VIKOR method results
S R Q
Distance Rank Distance Rank Distance Rank A1 0.338 2 0.169 2 0.023 2
A2 0.799 3 0.384 3 1 3
A3 0.316 1 0.173 1 0.009 1
4. SENSITIVITY ANALYSIS
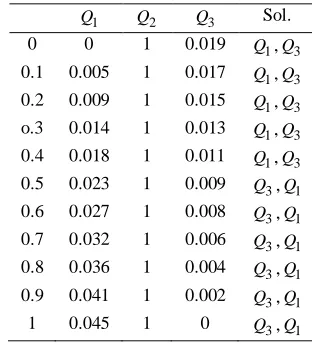
Although it is recommended that v = 0.5 should be used [37], the final ranking of alternatives heavily depends on this value. Hence, before any decision made, a sensitivity analysis is employed to further study its impact on our final ranking. Because, as in Step 6.3, the index rank of each alternative is obtained using a linear combination of closeness to the positive ideal point and negative ideal point or compromise solution, the value of this index heavily depends on the value of the v. For this reason, a sensitivity analysis is conducted to measure its impact on output or final ranking of alternatives. Following the application example in the previous section, different values in the range [0, 1] are assigned to v and the results tabulated as shown in Table 7.
Considering the first condition in Step 6.5, it is apparent that the alternative ranking changes from the third alternative to the first in the second position. Apparently, the value of v has impact on the ordering of alternatives no matter which comes first in the position. This phenomenon is mainly
because of the inequalityQ(a′)−Q(a′′)>0.25. The fifth column in the sensitivity analysis table illustrates the compromise solution based on the value of Qi and inequalityQ(a′)−Q(a′′)>0.25. Accordingly, the effect of changing value of v is depicted in Figure 3.
TABLE 7. Sensitivity analysis results
1
Q Q2 Q3 Sol. 0 0 1 0.019 Q1,Q3
0.1 0.005 1 0.017 Q1,Q3
0.2 0.009 1 0.015 Q1,Q3
o.3 0.014 1 0.013 Q1,Q3
0.4 0.018 1 0.011 Q1,Q3
0.5 0.023 1 0.009 Q3,Q1 0.6 0.027 1 0.008 Q3,Q1
0.7 0.032 1 0.006 Q3,Q1
0.8 0.036 1 0.004 Q3,Q1
0.9 0.041 1 0.002 Q3,Q1
1 0.045 1 0 Q3,Q1
0 0.2 0.4 0.6 0.8 1 1.2
1 2 3 4 5 6 7 8 9 10 11 Q1 Q2 Q3
Figure 3. Effect of v on alternatives ranking
5. CONCLUSIONS
potential sites in this case, for a plant location problem. For this purpose, an integrated methodology is structured, in which the Delphi method as a pre-step selects the most influential criteria via expertise of experts. Afterward, the VIKOR uses the AHP result weights as input weights. Finally, an application example of a home appliance manufacturer is presented to show the applicability and suitability of the proposed methodology. Also, a sensitivity analysis is employed to study the impact that parameter v may have on ranking alternatives.
Although the new integrated methodology is introduced for using in a plant selection problem, it can also be used with slight modifications in other decision making problems in a manufacturing industry. For further research, we may work on the topic that considers the proposed methodology in a fuzzy environment.
6. REFERENCES
[1] Yong, D., “Plant location selection based on fuzzy TOPSIS”, International Journal of Advanced Manufacturing Technology, Vol. 28, (2006), 839–844. [2] Heragu, S. S., “Facility Design”, PWS Publishing
Company, (1997).
[3] Heydar, M., Tavakkoli-Moghaddam, R., Mousavi, S. M. and Mojtahedi, S. M. H., “Fuzzy multi criteria decision making method for temporary storage design in industrial plants”, Proc. of the IEEE Int. Conf. on Industrial Engineering and Engineering Management (IEEM 2008), Singapore, (Dec. 8-11 2008), 1154–1158. [4] Liang G. S. and Wang, M. J. J., “A fuzzy multi-criteria decision-making method for facility site selection”,
International Journal of Production Research, Vol. 29, (1991), 2313–2330.
[5] Tavakkoli-Moghaddam, R., Azaron, A. and Mehrad-Pay, L., “Optimal control of service rate in a service center with lapse”, International Journal of Engineering Transactions B: Applications, Vol. 17, No. 3, (2004), 287–296.
[6] Chu, T. C., “Selecting plant location via a fuzzy TOPSIS approach”, International Journal of Advanced Manufacturing Technology, Vol. 20, (2002), 859–864. [7] Brown, P. A. and Gibson, D. F., “A quantified model for
facility site selection: An application to a multi-facility location problem”, AIIE Transactions, Vol. 4, (1972), 1–10.
[8] Buffa, E. S. and Sarin, R. K., “Modern production and operations management”, 8th ed., John Wiley and Sons, New York, (1987).
[9] Bhattacharya, A., Sarkar, B. and Mukherjee, S. K., “A new method for facility location selection: A holistic approach”, International Journal of Industrial
Engineering: Theory, Applications, and Practice, Vol. 11, No. 4, (2004), 330–338.
[10] Tzeng, G. -H. and Chen, Y. -W., “Optimal location of airport fire stations: A fuzzy multi-objective programming and revised genetic algorithm approach”,
Transportation Planning and Technology, Vol. 23, No. 1, (1999), 37–55.
[11] Kahraman, C., Ruan, D. and Dogan, I., “Fuzzy group decision-making for facility location selection”,
Information Sciences, Vol. 157, (2003), 135–153. [12] Chen, C. T., “A fuzzy approach to select the location of
the distribution center”, Fuzzy Sets and Systems, Vol. 118, (2001), 65–73.
[13] Min, H., “Location planning of airport facilities using the analytic hierarchy process”, Logistics and Transportation Review, Vol. 30, No. 1, (1994), 79–94. [14] Yang., J. and Lee, H., “An AHP decision model for
facility location selection”, Facilities, Vol. 15, (1997), 241–254.
[15] Badri, M. A., “Combining the analytic hierarchy process and goal programming for global facility location-allocation problem”, International Journal of Production Economics, Vol. 62, (1999), 237–248. [16] Kaboli, A., Aryanezhad, M. B., Shahanaghi, K. and
Tavakkoli-Moghaddam, R., “A holistic approach based on MCDM for solving location problems”,
International Journal of EngineeringTransactionsA: Basics, Vol. 20, No. 3, (2007), 251–262.
[17] Kuo, R. J., Chi, S. C. and Kao, S. S., “A decision support system for locating convenience store through fuzzy AHP”, Computers and Industrial Engineering, Vol. 37, (1999), 323–326.
[18] Kuo, R. J., Chi, S. C. and Kao, S. S., “A decision support system for selecting convenience store location through integration of fuzzy AHP and artificial neural network”, Computers in Industry, Vol. 47, (2002), 199– 214.
[19] Partovi, F. Y., “An analytic model for locating facilities strategically”, Omega, Vol. 34, No.1, (2006), 41–55. [20] Tavakkoli-Moghaddam, R. and Hassanzadeh-Amin, S.,
“A decision support system for facility location selection based on a fuzzy house of quality method”, Proc. of the International Conference on Enterprise Information Systems (ICEIS 2008), 403–406.
[21] Razmi, J., Tavakkoli-Moghaddam, R., Zairi, M. and Mousavi, N., “Application of TOPSIS, AHP and GIS in a multi-attribute model to solve location problem for bank branches: An empirical study in Iran”,
International Journal of Excellence in Public Sector for Management, Vol. 1, No. 2, (2007), 21–34. [22] Chou, S. -Y., Chang, Y. -H. and Shen, C. -Y., “A fuzzy
simple additive weighting system under group decision-making for facility location selection with objective/subjective attributes”, European Journal of Operational Research, Vol. 189, (2008), 132–145. [23] Yang, T. and Hung, C. -C., “Multiple-attribute decision
making methods for plant layout design problem”,
[24] Opricovic, S., “Multi-criteria optimization of civil engineering systems”, Faculty of Civil Engineering, Belgrade, 1998.
[25] Opricovic, S. and Tzeng, G. H., “Multi-criteria planning of post earthquake sustainable reconstruction”,
Computer-Aided Civil and Infrastructure Engineering, Vol. 17, (2002), 211–220.
[26] Opricovic, S. and Tzeng, G. -H., “Compromise solution by MCDM methods: A comparative analysis of VIKOR and TOPSIS”, European Journal of Operational Research, Vol. 156, (2004), 445–455.
[27] Buyukozkan, G. and Ruan, D., “Evaluation of software development projects using a fuzzy multi-criteria decision approach”, Mathematics and Computers in Simulation, Vol. 77, (2008), 464–475.
[28] Satty, T. L., “Multi-criteria decision making: The analytical hierarchy process”, RWS Publications, Pittsburgh, PA, (1988).
[29] Kahraman, C., Cevik, S., Yasin Ates, N. and Gulbay, M., “Fuzzy multi-criteria evaluation of industrial robotic systems”, Computers & Industrial Engineering, Vol. 52, (2007), 414–433.
[30] Önüt, S. and Soner, S., “Transshipment site selection using the AHP and TOPSIS approaches under fuzzy environment”, Waste Management, Vol. 28, No. 9, (2008), 1552–1559.
[31] Taskin Gumus, A., “Evaluation of hazardous waste transportation firms by using a two step fuzzy-AHP and TOPSIS methodology”, Expert Systems with Applications, Vol. 36, (2009), 4067–4074.
[32] Dağdeviren, M., Yavuz, S. and Kılınç, N., “Weapon selection using the AHP and TOPSIS methods under fuzzy environment”, Expert Systems with Applications, Vol. 36, (2009), 8143–8151.
[33] Chen, S. J. and Hwang, C. L., “Fuzzy multiple attribute decision making: Methods and applications”, Springer, Berlin, (1992).
[34] Chang, C. -W., Wu, C. -R. and Chen, H. -C., “Using expert technology to select unstable slicing machine to control wafer slicing quality via fuzzy AHP”, Expert Systems with Applications, Vol. 34, No. 3, (2008), 2210–2220.
[35] Zeleny, M., “Multiple Criteria Decision Making” McGraw-Hill, New York, (1982).
[36] Opricovic, S. and Tzeng, G. -H., “Extended VIKOR method in comparison with outranking methods”,
European Journal of Operational Research, Vol. 178, (2007), 514–529.
Chen, L. Y. and Wang, T. -C., “Optimizing partner’s choice in IS/IT outsourcing projects: The strategic decision of fuzzy VIKOR”, International Journal of Production Economics, Vol. 120, (2009), 233-242.
[37] Rao, R. V., “A decision making methodology for material selection using an improved compromise ranking method”, Materials and Design, Vol. 29, (2008), 1949–1954.