Volume 11, Number 6 June 2000
NSW
Public
Health
Bulletin
ISSN 1034 7674State Health Publication PH 000085
CONTENTS
Helen Moore, Lee Taylor and Louisa Jorm Epidemiology and Surveillance Branch NSW Department of Health
INTRODUCTION
Monitoring and reporting on the health of our population is a basic responsibility of NSW Health. It is the means by which we measure the health system’s performance at the broadest level and identify, highlight, and target emerging health issues. As such, it is fundamental to the rational planning and development of population-based and clinical health programs and services.
The health of the people of New South Wales: Report of the Chief Health Officer 2000 is the third in a series that began in
1996. The report:
• provides a comprehensive overview of the health of the
people of NSW
• presents trends in key health indicators
• demonstrates health differentials
• highlights emerging health priorities and new health data
sources.
It is intended for a wide variety of users, including health professionals and health consumers.
This edition of the report contains information on around 200 health indicators. Many of these have been retained and updated from the 1997 Report. Other indicators from 1997 have been dropped, to allow the addition of new content on emerging priorities, while keeping the size of the report manageable.
The report has four sections:
• determinants of health
• overall health status
• health of specific populations
• health priority areas.
Each of the four sections of the report is divided into several chapters.
THE HEALTH OF THE PEOPLE OF NEW
SOUTH WALES: REPORT OF THE CHIEF
HEALTH OFFICER, 2000
89 The health of the people ofNew South Wales: Report of the Chief Health Officer, 2000
95 The making of the Chief Health Officer’s Report, 2000
97 New South Wales Mothers and Babies Report, 1998
99 Reporting on Indigenous Health: Report of the Chief Health Officer, 2000
101 Improving the quality and management of Aboriginal and Torres Strait Islander health information in NSW
104 Multicultural Family Help Kit
105 Refugee health in NSW
107 FactSheet : Meningococcal disease
108 Infectious Diseases: June 2000
108 Trends
108 Introduction of the Australian
Section One
Determinants of health includes chapters on the NSW
population, social determinants of health, the environment, and health-related behaviours. The chapter focusing on social determinants of health includes new indicators of income, education and family structure analysed by Health Area. The chapter on the environment has been considerably expanded since the last report, and includes previously unpublished information about water quality. The health-related behaviours chapter presents previously unpublished data from the 1997 and 1998 NSW Health Surveys, and includes new information on deaths and illness attributable to smoking, alcohol use, and use of illicit drugs.
Section Two
Overall health status presents information about life
expectancy, death rates, causes of death, self-rated health, use of health care, and causes of hospitalisation.
Section Three
Health of specific populations examines differentials in
health among population groups. Chapters examining the health of Aboriginal and Torres Strait Islander peoples, people born overseas, and socioeconomic groups, have
been substantially revised and improved since the 1997 edition of the report. This section also includes a new chapter on rural and remote health, which introduces the use of the Accessibility–Remoteness Index for Australia (ARIA) classification, and a chapter on the health of NSW mothers and babies.
Section Four
Health priority areas presents recent information on key
health issues including cardiovascular diseases, diabetes mellitus, cancer, asthma, injury and poisoning, mental health, oral health and communicable diseases.
The report presents the latest available data wherever possible, including a range of previously unpublished data from the 1997 and 1998 NSW Health Surveys. It is accompanied by a Web version, which can be accessed at www.health.nsw.gov.au/public-health/chorep/chorep.html. Over time, new and more detailed, or updated, content will be added to the Web version to ensure that readers always have access to the most current information in the interval between hard copy editions. Both versions of the report depend heavily on data sets and analytic tools made available through our Health Outcomes Information Statistical Toolkit (HOIST) data warehouse.
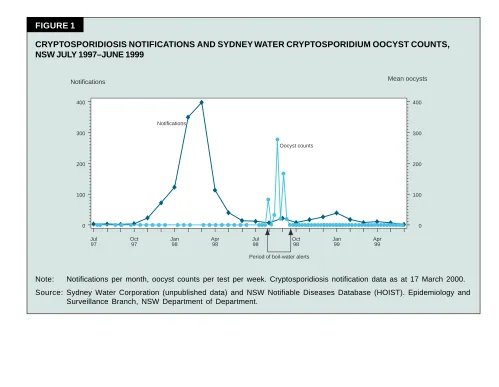
FIGURE 1
CRYPTOSPORIDIOSIS NOTIFICATIONS AND SYDNEY WATER CRYPTOSPORIDIUM OOCYST COUNTS, NSW JULY 1997–JUNE 1999
Notifications Mean oocysts
0 100 200 300 400
Jul 97
Oct 97
Jan 98
Apr 98
Jul 98
Oct 98
Jan 99
Apr 99
0 100 200 300 400
Period of boil-water alerts Notifications
Oocyst counts
Note: Notifications per month, oocyst counts per test per week. Cryptosporidiosis notification data as at 17 March 2000. Source: Sydney Water Corporation (unpublished data) and NSW Notifiable Diseases Database (HOIST). Epidemiology and
HIGHLIGHTS OF THE REPORT
Social determinants of health
In NSW in 1996, one in five households had a weekly income of less than $300. More than 579,000 people were receiving the aged pension, about 270,000 were receiving disability or sickness benefits, and 289,000 were receiving unemployment benefits. The unemployment rate among NSW males rose from 7.0 per cent in 1989 to 13.3 per cent in 1993 and then declined to 6.5 per cent in 1999. Among females the rate rose from 7.5 per cent to 11.3 per cent and then declined to 7.8 per cent over the same period. In 1996, 51 per cent of males and 61 per cent of females had no post-school qualifications. One in ten NSW families were single-parent families.
Health and the environment
Air quality in the Sydney region has improved. Over the period 1994–1997, the goal for atmospheric nitrogen dioxide concentration was not exceeded, although ozone levels were more variable. The number of days in Sydney when atmospheric fine particles exceeded the desired goal declined between 1979 and 1992, with some fluctuations since then, while concentrations of lead in the air have declined steadily. The first representative survey of air quality in NSW homes found elevated levels of fine particles in homes where smoking occurred, and in those with wood
burning heaters.
The bacteriological quality of Sydney and Hunter water supplies has improved in recent years, with consistently low levels of faecal and total coliform counts reported. Figure 1 shows that in July 1998, Cryptosporidium oocysts and Giardia cysts were detected at high levels in Sydney water, prompting the issue of a series of ‘boil-water’ alerts. There was no significant increase, however, in reports of cryptosporidiosis in Sydney residents, with 0–2 cases reported per week. Notification levels were well below those recorded during the swimming pool-associated outbreak in November 1997–May 1998. Taken together, the surveillance data suggest that the contamination did not pose a major risk to human health.
Health-related behaviours
In the 1997 NSW Health Survey, two-thirds of men and less than half of women reported adequate levels of physical activity. In the 1997 and 1998 surveys, 50 per cent of men and 35 per cent of women reported being overweight or obese, an increase from the 1989–90 figures of 44 and 30 per cent, respectively. Figure 2 shows that in the same surveys, women were more likely to report eating adequate amounts of fruit and using low or reduced fat milk, while men were more likely to report eating adequate amounts of breads and cereals. Around 20 per cent of men
FIGURE 2
USUAL DAILY FOOD INTAKE BY SEX, PERSONS 16 YEARS AND OVER, NSW 1997–98.
0 20 40 60 80
100 0 20 40 60 80 100
Males Females
Per cent Per cent
Estimated Estimated Number Number
16.7
396,000 21.0 511,000
Vegetables recommended quantity
Daily food intake
39.5
936,000 51.5 1,256,000
Fruit recommended quantity
23.8
542,000 10.8 257,000
Bread and cereals recommended quantity
38.0
856,000 53.1 1,233,000
Milk usually low/reduced fat
Note: Recommended daily quantity of fruit=300 grams or more. Recommended daily quantity of vegetables=300 grams or more. Recommended daily quantity of bread and cereal=210 grams or more. (NHMRC, 1995).
and women reported drinking alcohol at hazardous or harmful levels, while 27 per cent of men and 21 per cent of women reported current smoking. Smoking rates have been relatively static in NSW over the past five years. In NSW in 1998, 324 males and 63 females died from opiate overdose. The male death rate from this cause has more than doubled in the past 10 years.
The health of people born overseas
More than one quarter of NSW residents at the 1996 Census were born overseas. Twenty per cent of people spoke a language other than English at home. The most common non-English languages were Chinese, Arabic, Italian and Greek. In the period 1993–1998, NSW residents born in overseas countries experienced lower death rates than Australian-born residents.
At the 1997 and 1998 NSW Health Surveys, men and women born in many overseas countries were less likely to report ‘excellent’ or ‘very good’ health compared with NSW residents overall. Men and women born in New Zealand, and men born in Vietnam and Lebanon, were more likely to be smokers than NSW residents generally. Men and women born in New Zealand also had higher rates of harmful or hazardous alcohol consumption. In 1997 and 1998, NSW children born in many overseas countries had more teeth affected by decay than did their Australian-born counterparts.
The health of Aboriginal and Torres Strait Islander peoples
At the 1996 Census, the indigenous population in NSW numbered 109,925—more than one-quarter of the national indigenous population. Forty per cent of the NSW indigenous population was aged less than 15 years compared with 21 per cent of the non-indigenous population, while less than three per cent of the indigenous population was aged 65 years and over, compared with 13 per cent of the non-indigenous population. In the period 1990–1998, rates of prematurity, low birth-weight and perinatal mortality were one-and-a-half to two times higher among babies of indigenous mothers compared to babies of non-indigenous mothers.
At the 1997 and 1998 NSW Health Surveys, there were higher reported rates of smoking, hazardous or harmful alcohol consumption, and psychosocial distress in indigenous when compared to non-indigenous people. Figure 3 shows that in 1997–98, indigenous people received haemodialysis treatment at much higher rates than non-indigenous people, particularly in rural areas.
The health of rural and remote populations
Living in a remote area may influence health by restricting access to health services and to health-promoting messages. The ARIA classification can be used to measure the association between remoteness of residence and
Rural residents
Urban residents
Non-indigenous females Indigenous females Non-indigenous males Indigenous males
Non-indigenous females Indigenous females Non-indigenous males Indigenous males
Rate per 100,000 population
0 50 100 150 200
FIGURE 3
PERSONS RECEIVING HAEMODIALYSIS BY INDIGENOUS STATUS AND URBAN–RURAL HEALTH AREA OF RESIDENCE, NSW 1997–98.
Note: Haemodialysis was classified according to the ICD-9 code V56.0. Records where indigenous status was not stated were classified as non-indigenous. Health Areas in Greater Sydney, Hunter and Illawarra were classified as urban. Rates were age-adjusted using the Australian population as at 30 June 1991.
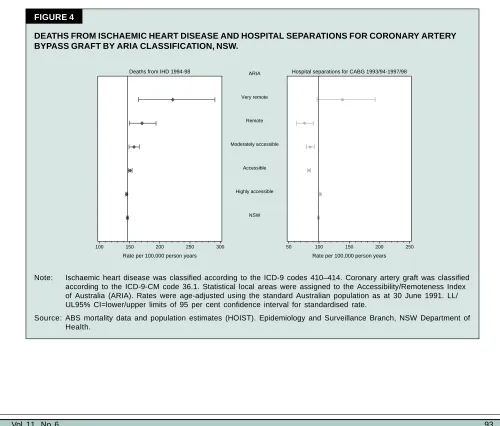
health. When applied to death rates from road injury, the classification shows the death rates among residents of remote localities to be over twice that of NSW residents generally. Figure 4 shows that death rates due to ischaemic heart disease are also higher among residents of very remote areas compared to NSW overall.
The health of socioeconomic groups
In the period 1993–1998, the NSW local government areas (LGAs) with the lowest socioeconomic status (SES) had the highest rates of premature death (from any cause) among both males and females. In both sexes a similar association existed for premature death from cardiovascular disease, and for injury and poisoning in men. In children aged less than 15 years, there was a trend towards a higher death rate from injury and poisoning with increasing social disadvantage, though this was more apparent in boys than girls.
At the 1997 and 1998 NSW Health Surveys, residents of the least socioeconomically disadvantaged postcode areas were more likely to rate their health as ‘excellent’ or ‘very good’ compared to people living in the more disadvantaged postcode areas. Smoking, overweight or
obesity, and hazardous or harmful alcohol consumption were also associated with socioeconomic disadvantage, with rates of each of these being higher among the most disadvantaged postcode areas. Figure 5 shows that psychosocial distress was associated with socioeconomic disadvantage, and was consistently higher among females than males.
CONCLUSION
The health of the people of New South Wales: Report of the Chief Health Officer, 2000 provides an update of the
key population health indicators in New South Wales, covering physical and mental health status, and environmental and behavioural risk factors. The report uses standard definitions and data that allow for meaningful comparisons to be made between individual health conditions and risk factors, and between different health conditions and health service areas within the State. There are two versions of the report available via the Internet. The first is a facsimile of the printed report, in Adobe Acrobat® (PDF) format. The second version is in
the form of an interactive Web site, which contains links to downloadable files of the graphs and tables for each
100 150 200 250 300 50 100 150 200 250
Deaths from IHD 1994-98 Hospital separations for CABG 1993/94-1997/98
Rate per 100,000 person years Rate per 100,000 person years
Very remote ARIA Remote Moderately accessible
Accessible Highly accessible
NSW
FIGURE 4
DEATHS FROM ISCHAEMIC HEART DISEASE AND HOSPITAL SEPARATIONS FOR CORONARY ARTERY BYPASS GRAFT BY ARIA CLASSIFICATION, NSW.
Note: Ischaemic heart disease was classified according to the ICD-9 codes 410–414. Coronary artery graft was classified according to the ICD-9-CM code 36.1. Statistical local areas were assigned to the Accessibility/Remoteness Index of Australia (ARIA). Rates were age-adjusted using the standard Australian population as at 30 June 1991. LL/ UL95% CI=lower/upper limits of 95 per cent confidence interval for standardised rate.
FIGURE 5
PSYCHOSOCIAL DISTRESS BY SOCIOECONOMIC DISADVANTAGE SCORE FOR POSTCODE OF RESIDENCE AND SEX, NSW 1997 AND 1998.
5 10 15 20 5 10 15 20
Males Females
Per cent Per cent
Most disadvantaged 5th Quintile 4th Quintile 3rd Quintile 2nd Quintile Least disadvantaged
1st Quintile NSW
Note: Psychosocial distress was measured using the Kessler 10 (K10) questionnaire. Raw K10 scores were transformed so that the NSW mean was 50 and standard deviation was 10. Postcode areas were classified into quintiles by scores based on the ABS Index of Relative Socioeconomic Disadvantage (IRSD) (see the Methods section of the Report p.265). LL/UL95% CI=Lower and upper limits of the 95 per cent confidence interval for the point estimate. Source: NSW Health Survey 1997 and 1998, ABS census data and SEIFA index (HOIST). Epidemiology and Surveillance
Branch, NSW Department of Health.
indicator, that can be used by readers for presentations and in their own documents. The interactive version will be expanded to include extra indicators in most chapters, and existing indicators will be updated as more recent data becomes available. In addition, chapters containing new indicators are planned.
ACKNOWLEDGEMENTS
Many people from within the Department of Health, the area health services and universities have contributed to the report, The health of the people of New South Wales:
Report of the Chief Health Officer, 2000. These include:
Pam Albany, Garth Alperstein, Nicola Atkin, Anna Bacik, Jane Bell, Bill Bellew, Sue Campbell-Lloyd, Jennifer Chipps, Tim Churches, Stephen Corbett, Christine Cowie, Leanne Erkes, Mary Fien, Shing Chung Fung, Michael Giffin, Elizabeth Harris, Jim Hyde, Devon Indig, Louisa Jorm, Jill Kaldor, Ed Kraa, Kim Lim, Lynne Madden, Jeremy McAnulty, Margaret McDonald, Rob Menzies, Helen Moore, Jane Moxon, Hanna Noworytko, Ru Nguyen,
Catriona O’Neill, Tim Owen, Anton Poder, Michele Puech, Gay Rixon, Michael Ryan, Peter Sainsbury, Neil Shaw, Vicky Sheppeard, Isabella Smith, Lee Taylor, Sara Thackway, Angela Todd, Phillip Vita, Belinda Walsh, Peter Waples, Peter Whitecross, Vladimir Williams, Anne Williamson and Margaret Williamson.
Copies of The health of the people of New South Wales: Report of the Chief Health Officer 2000 are available from the Better Health Centre Publications Warehouse, Locked Bag 5003, Gladesville NSW 2111; telephone (02) 9816 0452; fax (02) 9816 0492; or from the Public Health Division Web site at